?Mathematical formulae have been encoded as MathML and are displayed in this HTML version using MathJax in order to improve their display. Uncheck the box to turn MathJax off. This feature requires Javascript. Click on a formula to zoom.
Abstract
Understanding the mechanisms of explosions is important for minimising devastating hazards. Due to the complexity of real chemistry, a single-step reaction mechanism is usually used for theoretical and numerical studies. The purpose of this study is to look more deeply into the influence of chemistry on detonation initiated by a spontaneous wave. The results of high-resolution simulations performed for one-step models are compared with simulations for detailed chemical models for highly reactive and low reactive mixtures. The calculated induction times for H2/air and for CH4/air are validated against experimental measurements for a wide range of temperatures and pressures. It is found that the requirements in terms of temperature and size of the hot spots, which can produce a spontaneous wave capable to initiate detonation, are quantitatively and qualitatively different for one-step models compared to detailed chemical models. The time and locations when the exothermic reaction affects the coupling between the pressure wave and spontaneous wave are considerably different for a one-step and detailed models. The temperature gradients capable to produce detonation and the corresponding size of hot spots are much shallower and, correspondingly, larger than those predicted using one-step models. The impact of the detailed chemical model is particularly pronounced for the methane-air mixture. In this case, not only the hot spot size is much greater than that predicted by a one-step model, but even at the elevated pressure, the initiation of detonation by a temperature gradient is possible only if the temperature outside the gradient is rather high, so that can ignite a thermal explosion. The obtained results suggest that the one-step models do not reproduce correctly the transient and ignition processes, so that interpretation of the simulations performed using a one-step model for understanding mechanisms of flame acceleration, DDT and the origin of explosions must be considered with great caution.
1. Introduction
Understanding the causes and mechanisms of explosions is essential for minimising the explosion hazard in many industrial processes such as coal mines and natural gas pipelines, hydrogen energy, nuclear, chemical and other industries [Citation1–4]. Historically, explosions of methane/air mixtures are long time known to occur in coal mines [Citation5] and the mining industry, have one of the highest injury and fatality rates. Understanding the causes and mechanisms of explosions is essential for improving safety measures and minimising devastating hazards. In the worst case, explosions may be accompanied by detonation resulting in a considerable pressure rise and serious damage. If ignited in a confined area (pipes, tunnel, etc.) the flame accelerates and may undergo the deflagration-to-detonation transition (DDT), which can present significant hazards. Since the discovery of the deflagration-to-detonation transition more than 150 years ago, a large number of experimental, theoretical and numerical studies have been undertaken in an attempt to understand the fundamental mechanisms and processes which lead to DDT (see e.g. the reviews [Citation6,Citation7]). However, despite many years of intensive research, there are still many questions that are poorly understood, and the mechanisms of flame acceleration and DDT remain one of the main challenges in the combustion physics.
Because of the complexity of real chemical kinetics, the majority of numerical simulations undertaken in an attempt to understand the nature of DDT used a simplified one-step Arrhenius model. To justify this approach, some authors (e.g. [Citation8]) argued that:
for many practical situations, an extensive description of the details of the chemical pathways is unnecessary. Instead, it is more important to have an accurate model of the fluid dynamics coupled to a model for the chemical-energy release that puts the released energy in the “right” place in the flow at the “right” time.
This trend was considered as the mainstream in DDT studies until it was shown experimentally by Kuznetsov et al. [Citation11] that for a stoichiometric hydrogen/oxygen and ethylene/air mixtures the temperature in the vicinity of the flame prior to DDT remains too low (does not exceed 550 K) for spontaneous ignition. Experimental studies and numerical simulations of DDT overtaken by Liberman et al. [Citation12–15] using the detailed chemical model for hydrogen/oxygen have shown that the DDT mechanism is different from the gradient mechanism. A new mechanism of DDT consisting in the mutual amplification of a weak shock formed close ahead of the flame front and coupled with the flame reaction zone was proposed by Liberman et al. [Citation12]. The scenario of the shock coupling and coherent amplification of the shock and the flame reaction zone resembles the SWACER mechanism (shock wave amplification by coherent energy release) considered by Lee and Moen [Citation16]. However, the disadvantage of using a single-step model in numerical simulations leads not only to an incorrect interpretation of the DDT mechanism but also gives a wrong, about two times smaller, the value of the run-up distance [Citation12–15].
In the present paper, we consider the influence of chemical kinetics on the modelling of detonation initiated by a temperature gradient in the highly reactive hydrogen/air and in the slow reactive methane/air mixtures. To do so, we compare and contrast the simulations for a one-step model with the simulations with the multi-step detailed chemical models. Since the use of detailed chemical mechanisms can severely limit the calculations, the reduced chemical models with a minimum number of reactions and species, suitable for describing transient combustion, such as DDT, are of great interest, especially for methane/air combustion where complete reaction mechanism can consist of many hundred species and thousands of reactions. Therefore, we use the reduced chemical models with a minimum number of reactions and species but sufficiently detailed to correctly describe ignition delay times and characteristics of laminar flames for a wide range of initial pressures and temperatures. It is shown that there is a considerable difference in the steepness of temperature gradient and consequently in the hot spot size capable to initiate a detonation for a detailed chemical reaction model compared to a one-step chemical model. The size of a hot spot with a temperature gradient capable of producing detonation obtained with a detailed chemical model can be in orders of magnitude greater than that obtained from calculations using a one-step model. The difference in the steepness of temperature gradients, and correspondingly in the hot spot size, capable of producing detonation for a one-step and for a detailed chemical model caused by two factors. First, the induction time for a one-step model calibrated in such a way that the model more or less correctly reproduces the speed and width of the laminar flame is 2–3 orders of magnitude smaller than the actual induction time calculated using a detailed chemistry and measured in experiments. Another difference is that for a one-step model reaction is exothermic from the very beginning, while chain branching reactions start with endothermic induction stage representing chain initiation and branching. Therefore, the gasdynamics is effectively ‘switched-off’ during the induction stage. As a consequence, combustion regimes initiated by the temperature gradient require much shallower temperature gradients compared with those predicted by a one-step model. This means that the size of a hot spot with a temperature gradient capable of producing detonation obtained with a detailed chemical model is by orders of magnitude greater than that obtained from calculations using a one-step model.
2. Chemical kinetics modelling
We compare the one-step chemical models, which have been used for 2D simulations of the flame acceleration and DDT in hydrogen/air [Citation6,Citation17] and in methane/air [Citation8], with the detailed chemical mechanisms. It is known that to be able to predict correctly the ignition delay times, the reduced mechanisms must consist of at least ten reactions [Citation18]. All the chemical models used in the present study were thoroughly tested and compared with the standard GRI Mech 3.0 [Citation19] and validated against experimental measurements. The requirements to the chemical schemes imply their capability to reproduce correctly laminar flame speeds and structure and the ignition delay times (induction times). These requirements stem from the need of ensuring the controllable capability of characterising ignition for transient combustion processes evolving over wide ranges of temperature during the flame acceleration and DDT. Finally, computational costs to use chemical schemes with DNS or LES solvers must be reasonable for the feasibility of multidimensional simulations.
2.1. Hydrogen-air chemistry: a single-step and detailed models
A single-step chemistry approach suggests that the complex set of reactions can be modelled by a one-step Arrhenius reaction. We will compare with the detailed chemical model the one-step Arrhenius model, which was used in [Citation6,Citation17] for 2D simulations of the hydrogen/air flame acceleration and DDT in the channel with obstacles at an initial pressure and initial temperature,
:
(1)
(1) Here
is the pre-exponential factor,
is the gas mixture density,
is the ratio of specific heats,
is the activation energy of the reaction, R is the universal gas constant.
The detailed mechanism chosen to model the hydrogen-air chemistry is the mechanism developed by Kéromnès et al. [Citation20], which consists of 19 reactions and 9 species. An advantage of this mechanism is that it was extensively validated over a large number of experimental conditions, especially focused on high pressures [Citation21], and it shows an excellent agreement between the modelling and experimental measurements of the flame velocity-pressure dependence over a wide range of pressures and equivalence ratios.
2.2. Methane/air chemistry: a single-step and multi-step mechanisms
We compare a one-step Arrhenius model used by Kessler et al. [Citation8] for 2D simulations of the methane/air flame acceleration and DDT in the channel with obstacles at initial pressure and temperature,
. The model [Citation8] was calibrated to give a reasonable approximation of the key properties of the methane/air that are: the laminar flame speed, the adiabatic flame temperature. The equation of a one-step kinetics is the same as Equation (1) with the parameters for methane/air:
,
,
,
.
The multi-step detailed mechanism chosen to model methane-air chemistry is the reduced detailed reaction model DRM-19 developed by Kazakov and Frenklach [Citation22], which consists of 19 species and 84 reactions. The mechanism DRM-19 has been chosen for simulating as it was extensively validated by many researchers for combustion characteristics of CH4/air related to ignition delay times and laminar flame velocities over a wide range of pressures, temperatures, and equivalence ratios [Citation23–25].
3. Comparison of one-step and detailed chemical schemes; induction times
We compare predictions of one-step models with that obtained using detailed multi-step mechanisms. The ability of different reaction schemes to reproduce the laminar flame structure and speeds and the ignition delay times were examined using high-resolution simulations. The resolution and convergence (a grid independence) tests were thoroughly performed to ensure that the resolution is adequate to capture details of the problem in question and to avoid computational artefacts. The convergence of the solution is quite satisfactory already for 8 grid points per flame width at initial pressure 1atm, but effective resolution up to 64 grid points and more were used for elevated pressures with the corresponding cell sizes less 1 µm (see Appendix).
The ignition delay times were calculated for different chemical reaction schemes using the standard constant volume adiabatic model. The ignition delay time can be defined as the time during which the maximum rate of temperature rise () is achieved, which is close to the time of exothermic reactions activation. While one-step models allow to reproduce the laminar flame speed
and the adiabatic flame temperature
with satisfactory good accuracy, the induction times predicted by the one-step models are significantly shorter than the induction times calculated using detailed chemical models, GRI 3.0 Mech, and the experimentally measured induction times.
3.1. Hydrogen-air: one-step and detailed chemical mechanisms
Figure (a) and 1(b) show the induction times versus temperature for hydrogen/air at pressures and 2 atm computed using the one-step model Equation(1), the induction times computed with the detailed chemical model [Citation20] and experimental results [Citation25,Citation26,Citation29–31].
Figure 1. (a, b) Induction times for stoichiometric hydrogen-air mixture at pressure: and
. (■) – one-step model. (•) – detailed model [Citation20]. Experiments (a): □ – Snyder et al. [Citation26]; ○ – Slack and Grillo [Citation27]; ▵ – Hu et al. [Citation28]; (b): □ – Slack and Grillo [Citation27]; ○– Slack [Citation25]; ▵ – Bhaskaran and Gupta. [Citation29].
![Figure 1. (a, b) Induction times for stoichiometric hydrogen-air mixture at pressure: P=1atm and P=2atm. (■) – one-step model. (•) – detailed model [Citation20]. Experiments (a): □ – Snyder et al. [Citation26]; ○ – Slack and Grillo [Citation27]; ▵ – Hu et al. [Citation28]; (b): □ – Slack and Grillo [Citation27]; ○– Slack [Citation25]; ▵ – Bhaskaran and Gupta. [Citation29].](/cms/asset/67d2b6f3-a557-48a1-8830-6554c06786c3/tctm_a_1551578_f0001_ob.jpg)
The induction times for hydrogen/air at pressures and 10 atm computed using the one-step model Equation (1) and using the detailed chemical model [Citation20] and experimental results from Ref. [Citation24,Citation28] are shown in Figures and . The empty squares and circles in Figures and are experimental results from Ref. [Citation24,Citation28]. It is seen that the induction times predicted by the detailed chemical model [Citation20] are in a good agreement with the experimental results but differ up to three orders of magnitude from that predicted by the one-step model. Another feature of the ‘real’ induction time is an abrupt change of
at the crossover temperatures, which correspond to the transition from the endothermal induction stage to the exothermal stage. The crossover temperatures in Figures – are:
for
, correspondingly.
Figure 2. Induction times for stoichiometric hydrogen-air mixture at calculated for one-step (■) and detailed (•) chemical models. Experimental data are: □ – Hu et al. [Citation28]; ○ – Wang et al. [Citation30]. In Figure (b) experimental data are: □ – Hu et al. [Citation30]; ○ – Pan et al. [Citation31].
![Figure 2. Induction times for stoichiometric hydrogen-air mixture at P=5atm calculated for one-step (■) and detailed (•) chemical models. Experimental data are: □ – Hu et al. [Citation28]; ○ – Wang et al. [Citation30]. In Figure 2(b) experimental data are: □ – Hu et al. [Citation30]; ○ – Pan et al. [Citation31].](/cms/asset/0b238a25-125b-4fdd-b874-b1c69faf22f1/tctm_a_1551578_f0002_oc.jpg)
Figure 3. Induction times for stoichiometric hydrogen-air mixture at pressures calculated for one-step (■) and detailed (•) chemical models. Experimental data are: □ – Hu et al. [Citation28], ○ – Pan et al. [Citation31].
![Figure 3. Induction times for stoichiometric hydrogen-air mixture at pressures P=10atm calculated for one-step (■) and detailed (•) chemical models. Experimental data are: □ – Hu et al. [Citation28], ○ – Pan et al. [Citation31].](/cms/asset/bb13eb9d-a5ef-4ac4-b15a-bba66fe559cd/tctm_a_1551578_f0003_ob.jpg)
3.2. Methane-air: a one-step and detailed chemical models
Figure shows the induction times versus temperature at , computed using the one-step model, the detailed chemical model DRM-19, GRI 3.0 Mech and the experimental measurements [Citation32,Citation33].
Figure 4. Induction times for methane-air at calculated for the one-step model, DRM19 and GRI3.0. Empty circles and squares are experimental data Zeng et al. [Citation32] and Hu et al. [Citation33], correspondingly.
![Figure 4. Induction times for methane-air at P=1atm calculated for the one-step model, DRM19 and GRI3.0. Empty circles and squares are experimental data Zeng et al. [Citation32] and Hu et al. [Citation33], correspondingly.](/cms/asset/1482d4a4-effd-4d04-8c5d-7eafd61545a3/tctm_a_1551578_f0004_ob.jpg)
One can see that the difference between the induction time calculated with the one-step model and the real induction time calculated with detailed chemical models for methane/air is about 10 times larger than they are for hydrogen/air. A similar large difference between the induction times predicted by a one-step model and the induction times computed using detailed chemical models remains at elevated pressures as it is shown in Figures and for the initial pressure 5 and 10 atm.
Figure 5. Induction times for methane-air at . Empty circles and squares are experimental results from [Citation32] and [Citation33], correspondingly.
![Figure 5. Induction times for methane-air at P=5atm. Empty circles and squares are experimental results from [Citation32] and [Citation33], correspondingly.](/cms/asset/b27a33a8-82b9-444a-9cf7-5fcfa2c6d797/tctm_a_1551578_f0005_ob.jpg)
Figure 6. Induction times for methane-air at . Empty circles and squares are experimental results from [Citation32] and [Citation33], correspondingly.
![Figure 6. Induction times for methane-air at P=10atm. Empty circles and squares are experimental results from [Citation32] and [Citation33], correspondingly.](/cms/asset/15a30d22-3c2d-44a5-99db-f6850f6f91f9/tctm_a_1551578_f0006_ob.jpg)
It should be noted that, contrary to hydrogen/air, the temperature dependence of ‘real’ induction time for methane/air does not show the transition corresponding to the crossover temperature – an abrupt change in as it is for hydrogen/air.
4. Spontaneous waves and detonation initiation by temperature gradients
We will use the conventional term a ‘hot spot’, which is an area within a reactive mixture, where the temperature is higher than in the surrounding mixture. The hot spot size is considered as the temperature gradient scale, . Typically turbulence time scales are much longer than the induction times for temperatures higher than the ignition threshold temperature, which is defined as the temperature at which the fresh mixture ignites before it is consumed by the flame burned by the flame during
.
4.1. Spontaneous waves and detonation initiation by a temperature gradient
The ignition of a flammable mixtures is one of the most important and fundamental problems in combustion physics. In practical cases ignition begins in a small area of the combustible mixture, which is locally heated by means of an electric spark, hot wire, and the like. Such local energy release results in the formation of an initially nonuniform distribution of temperature (or concentration of reagents), which depending on the mixture reactivity and the initial pressure determine evolution of the reaction wave. One needs to know how the initial conditions in such ‘hot spot’ influence the regime of the reaction wave, which is ignited and propagates out from the ignition location. The question of how a hot spot gives rise to different modes of combustion wave remained open until Zel’dovich et al. [Citation9] have demonstrated that a sufficiently shallow temperature gradient in a hot spot can initiate a detonation. The concept of a spontaneous reaction wave propagating through a reactive mixture along a spatial gradient of reactivity, which Zel’dovich later introduced [Citation10], is of great fundamental and practical importance. It opens an avenue to study ignition of different regimes of the reaction wave initiated by the initial non-uniformity in temperature or reactivity caused by the local energy release [Citation34].
In a region with nonuniform distribution of temperature the reaction begins at the point of minimum ignition delay time and, correspondingly, the maximum temperature, and then it spreads along the temperature gradient by spontaneous autoignition at neighbouring locations where is longer. In the case of a one-step chemical model, the induction time is defined by the time-scale of the maximum reaction rate. For a detailed, chain branching chemistry this is the time scale of the stage when the endothermic chain initiation stage completed and branching reactions begin. In a one dimensional problem the spontaneous autoignition wave propagates relative to the unburned mixture in the direction of the temperature gradient with the velocity:
(2)
(2) Since there is no causal link between successive autoignitions, there is no restriction on the value of
, which depends only on the steepness of the temperature gradient (
) and
. It is obvious, that a very steep gradient (hot wall) ignites a deflagration mode (flame), while a zero gradient corresponds to the uniform thermal explosion. The velocity of spontaneous wave initiated by the temperature gradient decreases while the autoignition wave propagates along the gradient, and reaches the minimum value at the point close to the cross-over temperature, where it can be caught-up and coupled with the pressure wave, which was generated due to the chemical energy release behind the spontaneous wave front. As a result, the pressure peak is formed at the reaction front, which grows at the expense of energy released in the reaction. After the intersection of the spontaneous wave front and the pressure wave, the spontaneous wave transforms into combustion wave and after the pressure peak becomes large enough, it steepens into a shock wave, forming an overdriven detonation wave. Classification of combustion regimes initiated by a temperature gradient has been made by Zel’dovich [Citation10], see also the review paper by Kapila et al [Citation35], for a one-step chemical model.
Liberman et al. [Citation36,Citation37] employed a detailed chemical kinetic model to study combustion regimes initiated by the temperature gradient in stoichiometric hydrogen/oxygen and hydrogen/air mixtures. It was shown that the temporal evolution of a spontaneous wave calculated using the detailed chemical kinetic model differs considerably from the predictions obtained from simulations with a one-step model. The difference in the steepness of temperature gradients, and correspondingly in the hot spot size capable of producing detonation for the one-step and the detailed chemical models caused by two main reasons. First, the induction time for a one-step model calibrated in such a way that the model more or less correctly reproduces the speed and width of the laminar flame is 2–3 orders of magnitude smaller than the actual induction time calculated using a detailed chemistry and measured in experiments. Another difference is that for a one-step model reaction is exothermic for all temperatures, while chain branching reactions start with endothermic induction stage representing chain initiation and branching. Therefore, the gasdynamics is effectively ‘switched-off’ during the induction stage. As a consequence, combustion regimes initiated by the temperature gradient require much shallower temperature gradients compared with those predicted by a one-step model. This means that the size of a hot spot with a temperature gradient capable of producing detonation obtained with a detailed chemical model is much larger than that obtained from calculations using a one-step model. The size of a hot spot with a temperature gradient capable of producing detonation decreases with the increase of initial pressure, and may become of the order of few millimetres at very high pressures [Citation37,Citation38].
4.2. Problem setup
The model of a linear temperature gradient is convenient for analysis and it has been widely used in many previous studies [Citation9,Citation10,Citation35–43]. We consider uniform initial conditions apart from a linear temperature gradient. The initial conditions at , prior to ignition are constant pressure and zero velocity of the unburned mixture. At the left boundary at
the conditions are for a solid reflecting wall, where
and the initial temperature,
exceeds the ignition threshold value. Thus, the initial conditions are quiescent and uniform, except for a linear gradient in temperature (and hence density):
(3)
(3)
(4)
(4) The initial temperature gradient is characterised by the temperature
at the left end, by the temperature of ambient mixture outside the gradient,
and by the gradient steepness,
. The ‘length’
, which characterises the gradient steepness can be viewed as the hot spot size, where the initial temperature gradient was formed.
The 1D direct numerical simulations are performed to solve the set of the one-dimensional time-dependent, fully compressible reactive Navier-Stokes equations and chemical kinetics.
(5)
(5)
(6)
(6)
(7)
(7)
(8)
(8)
(9)
(9)
(10)
(10)
(11)
(11)
We use conventional notations: ,
,
, are pressure, mass density, and flow velocity,
– the mass fractions of the species,
– the total energy density,
– the inner energy density,
– is the universal gas constant,
– the molar mass of i-species,
,
– the molar density,
– the viscous stress tensor,
– is the constant volume specific heat,
– the constant volume specific heat of i-species,
– the enthalpy of formation of i-species,
and
are the coefficients of thermal conductivity and viscosity,
– is the diffusion coefficients of i-species,
– is the variation of i-species concentration (mass fraction) in chemical reactions.
The equations of state for the reactive mixture and for the combustion products were taken with the temperature dependence of the specific heats and enthalpies of each species borrowed from the JANAF tables (Joint Army Navy NASA Air Force Thermochemical Tables) and interpolated by the fifth-order polynomials [Citation44]. The ideal gas equation of state was used in the case of a single-step model [Citation6–8,Citation17]. The viscosity and thermal conductivity coefficients of the mixture were calculated from the gas kinetic theory using the Lennard-Jones potential [Citation45]. Coefficients of the heat conduction of i-th species are expressed via the viscosity
and the Prandtl number,
.
5. Detonation initiation by a temperature gradient in a stoichiometric H2/air mixture
The time evolution of spontaneous wave and the detonation initiation by the steepest temperature gradient in H2/air mixture and therefore by the minimum size of the hot spot at the initial conditions atm,
,
, computed for a one-step model and with the detailed chemical reaction model [Citation20] are shown in Figures and , correspondingly.
The spontaneous reaction wave starts at the upper point of the gradient, where the temperature is maximum, and further its velocity decreases. If the gradient is sufficiently shallower, such that the minimum speed of the spontaneous wave is close to the sound speed, , the spontaneous reaction wave is coupling with the pressure pulse produced by the energy released in the reaction. As a result, a pressure peak is formed at the reaction front, which grows at the expense of energy released in the reaction. After the pressure peak becomes large enough, it steepens into a shock wave, forming an overdriven detonation wave. For a steeper temperature gradient (smaller hot spots) the velocity of the spontaneous wave at the minimum point is not sufficient to sustain synchronous feedback amplification between the reaction and the pressure pulse. In this case, the pressure waves run ahead of the reaction wave out of the gradient and the result will be a deflagration or fast deflagration behind the shocks wave.
The velocity of the spontaneous wave initiated by the initial temperature gradient decreases along the gradient ( decreases with the temperature increases, see Equation (2)) and reaches its minimum value at the point close to the crossover temperature. Therefore, the necessary condition for initiating detonation by the spontaneous reaction wave is that the spontaneous wave initiated by the temperature gradient can be caught up and coupled with the pressure wave, which was generated behind the high-speed spontaneous wave front. Since the exothermic stage of the reaction begins and produces pressure pulse at the temperature slightly higher than the crossover temperature, the necessary condition for triggering a detonation can be written in the form
(12)
(12) where the temperature
is slightly above the crossover temperature
and
is the sound speed at the point corresponding to
. Using this condition we can estimate the minimum size of the hot spot for the successful detonation initiation. Figure (a) and (b) show velocities of the spontaneous wave at the minimum point as the function of the hot spot size (
) calculated for detailed and one-step chemical models at initial pressure
1, 5 and 10atm;
,
.
While at the normal or lower pressures the induction stage is much longer than the chain termination exothermic stage, they become of the same order at high pressures, when triple collisions dominate. The crossover temperature corresponding to the equilibrium of the induction and termination stages known as the extended second explosion limit [Citation37] shifts to higher temperatures (Figures –) at high pressures. Since at high pressures the induction time decreases (more precisely, decreases), the minimal steepness of the gradients necessary for detonation initiation increases. The corresponding size of the hot spot
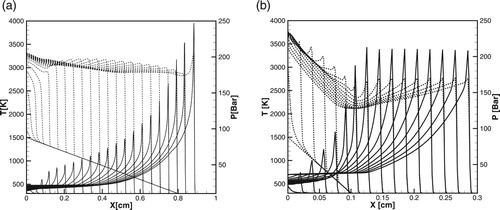
producing detonation decreases. Figures (a) and (b) and Figures(a) and (b) show the time evolution of temperature and pressure profiles during the initiation of detonation computed for the detailed [Citation20] and one-step model at initial pressures
atm and
atm.
By comparing the critical size of the hot spot, obtained in numerical simulations in Figures , , (a) and (b) and (a) and (b), it can be seen that the Equation (12) and diagrams in Figure (a) and (b) predict the critical size with a good accuracy for both detailed and one-step models over a wide range of pressures. Since during the induction stage there are no gasdynamic perturbations and the reaction proceed without heat release, the wave of exothermal reaction follows the spontaneous wave path with the delay determined by the duration of initiation-termination reactions. Therefore, the critical size of the hot spot predicted for the detailed chemistry is much larger than that for the one-step model for all pressures.
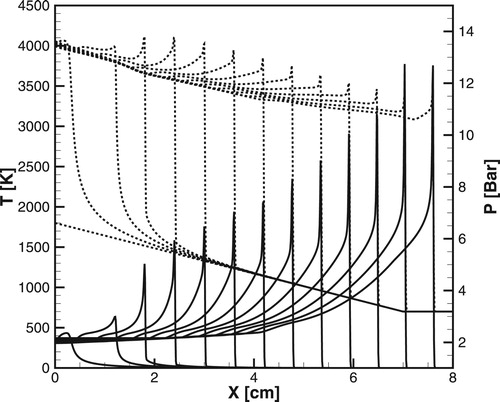
Figure 7. Time evolution of the temperature (dashed lines) and pressure (solid lines) profiles during detonation initiation in H2/air for one-step model. atm,
.
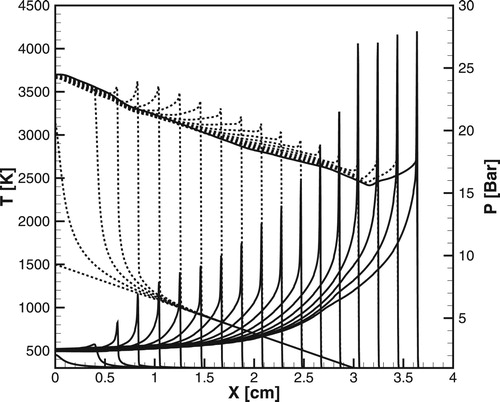
Figure 8. Time evolution of the temperature (dashed lines) and pressure (solid lines) profiles during detonation initiation in H2/air calculated for the detailed chemical model [Citation20]; atm,
,
.
![Figure 8. Time evolution of the temperature (dashed lines) and pressure (solid lines) profiles during detonation initiation in H2/air calculated for the detailed chemical model [Citation20]; P0=1 atm, T∗=1500K, Δt=2μs.](/cms/asset/701bc4b0-7ef4-4a8d-a013-dcde6796862d/tctm_a_1551578_f0008_ob.jpg)
Figure 9. (a, b) The minimum hot spot size producing detonation at
1, 5, 10 atm. (a): detailed model,
,
,
. (b): one-step model
,
,
.
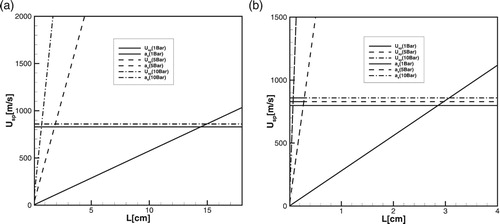
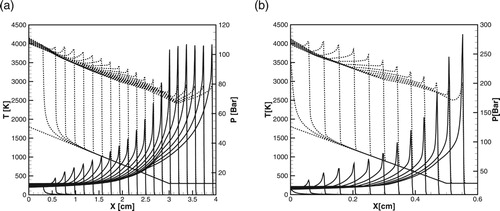
Figure 10. (a, b) Time evolution of the temperature (dashed lines) and pressure (solid lines) profiles during detonation initiation in H2/air at atm,
. (a): detailed model; (b): one-step model,
.
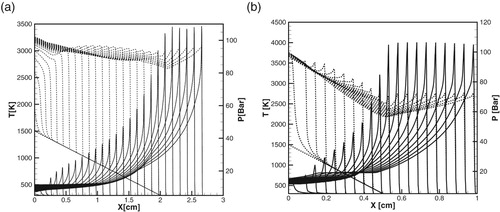
Figure 11. (a, b) Time evolution of the temperature and pressure profiles during detonation initiation in H2/air at atm,
. (a): detailed model; (b): one-step model.
The difference in the sizes of hot spots, , at which the temperature gradient can produce a steady detonation for one-step and detailed models is due to the difference in
for these models, which determines the speed of the spontaneous wave. According to Equation (12) the ratio of critical sizes given by the detailed and one-step models for the same initial conditions can be estimated as
(13)
(13) Figure shows
calculated for the detailed model [Citation20] and for the one-step model [Citation17]. It is seen that the difference between
and
remains approximately unchanged for all pressures.
Figure 12. for H2/air at initial pressure 1, 5 and 10 atm calculated for detailed (solid lines) and one-step (dashed lines) models.
Classification of all possible modes of the propagating combustion wave inspired by the spontaneous wave initiated by a temperature gradient is similar to that described by Liberman et al. [Citation37] for hydrogen/oxygen. The pressure waves generated during the exothermic stage of reaction can couple and evolve into a self-sustained detonation, or the coupling and synchronisation and mutual amplification between the travelling shock wave and reaction front failed, resulting in the pressure waves running away ahead of the deflagration wave. The outcome depends on the gradient steepness and the relationship between the speed of the spontaneous wave at the point where its velocity reaches a minimum, and the characteristic velocities of the problem: the laminar flame speed
, the speeds of sound at the points
and
:
and
, speeds at the Newman point
, at the Chapman-Jouguet point,
and the velocity of Chapman-Jouguet detonation
. Because of the limited space, we consider here only conditions under which the temperature gradient can initiate detonation.
6. Spontaneous wave and detonation initiation by the temperature gradient in CH4/air
The induction times and its derivative
are much longer (larger) for methane/air at all temperatures compared to those for the hydrogen/air. Therefore, the spontaneous wave velocity in methane/air is smaller for the same temperature gradients. Since the values of sound speeds and the Chapman-Jouguet velocities for hydrogen/air and methane/air are fairly close, one can expect that the minimum size of the hot spot, which can produce detonation will be considerably greater for methane/air compared to hydrogen/air.
6.1. Detonation initiation by the temperature gradient in CH4-air. One-step chemical model
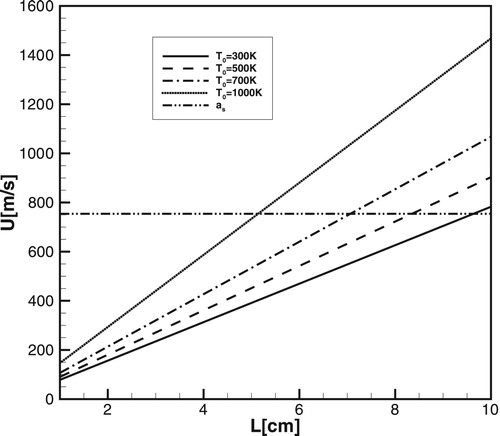
Figure shows the necessary condition for the formation of detonation according to Equation (12) for a one-step model, for ,
and for different temperatures outside the gradient:
, 500, 700, and 1000K.
corresponds to the location of the spontaneous wave, where earlier released in the reaction energy resulted in the first noticeable pressure peak.
Figure 13. The intersection of lines with the sound speed corresponds to the steepest gradients producing detonation in CH4/air for different values
computed for the one-step model.
The results of simulations for temperature gradients: and
,
,
,
, are shown in Figures (a) and (b). According to the diagram in Figure a steady detonation can be developed by the temperature gradient (
,
,
) if it steepness corresponds to
, which agrees well with Figure (b). In contrast to the scenario shown in Figure (b), the developing detonation shown in Figure (a)
quenches at
. In this case, the reactive zone starts to move slowly away from the leading shock wave. The rarefaction wave propagates into the reaction zone and the separation between the zone of heat release and the leading shock increases. As a result, the intensity of the shock wave becomes weaker and detonation quenches. For the steeper temperature gradient (Figure (a)), the reaction velocity at the point, where the pressure wave overtakes the reaction wave, is not sufficient to sustain synchronous amplification of the pressure pulse in the flow behind the shock wave. As a result, the pressure wave runs ahead of the reaction wave and the velocity of the reaction wave decreases. The evolution of the reaction and pressure (shock) wave velocities for the conditions of Figure (a) and (b) is shown in Figure (a) and (b). The velocity of the reaction wave was calculated from the trajectory of the reaction front and the velocity of the pressure wave was calculated from the trajectory of the maximum pressure of the pressure wave profile.
Figure 14. (a, b) Evolution of the temperature (dashed lines) and pressure profiles (solid lines) during the formation of detonation at . (a)
; (b)
.
For the first time, the phenomenon of spontaneous quenching of the developing detonation has been studied by He and Clavin [Citation39–41] (see also Clavin and Searby [Citation42]). This led to the definition of the critical size of the initial hot pocket of the fresh mixture for ignition a detonation, observed by He and Clavin [Citation39]. They also pointed that for a given temperature T* the critical temperature gradient for the spontaneous formation of a CJ detonation is defined by the local criterion . It is seen that for the steeper gradient (
), shown in Figure (a), from the beginning the developed detonation follows closely the local CJ detonation in the early stage of propagation but later on it quickly quenches at
.
He and Clavin [Citation40,Citation41] also emphasised that the same temperature gradient, for which a detonation is quenching, can ignite a detonation for the higher temperature outside the hot spot, as it is seen in Figure . Indeed, it is shown in Figure , that in agreement with Figure , detonation does not quench and develops in a steady CJ detonation for the same size of the temperature gradient as in Figure (b), but for higher temperature
. Radulescu et al. [Citation46] noted that as more uniform reaction zone, as the reaction is stronger coupled with the shock wave. According to Liberman et al. [Citation37] at higher ambient temperatures the reaction front propagates at smoother ambient density so that hydrodynamic resistance at the end and outside the gradient is smaller and the transition to detonation may occur for a steeper gradient (smaller
).
Figure 15. Velocities of the reaction wave (solid line) and pressure wave (dash-dotted lines) computed for the conditions in (a) and (b).
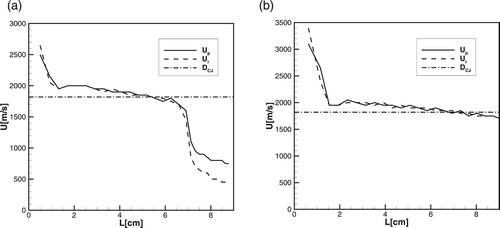
Figure 16. Evolution of the temperature (dashed lines) and pressure (solid lines) profiles during the detonation formation: ,
,
.
He and Clavin [Citation40] explained spontaneous quenching of detonation in simple terms using a particular form of the quasi-steady-state approximation. In the classification of reaction waves initiated by temperature gradient by Liberman et al. [Citation37] this corresponds to a quasistationary structure consisting of a shock wave and reaction zone, which may transform into a detonation propagating down the temperature gradient for the condition .
For a higher initial pressure the induction time and decrease rapidly with increasing pressure (approximating 10 times with increasing pressure from 1atm to 10atm), and the spontaneous wave speed increases rapidly. Therefore, at high pressures the minimal steepness of the gradient necessary for the detonation initiation increases (
decreases). Evolution of the temperature and pressure profiles during the detonation development, calculated for the one-step model, at
and
,
is shown in Figure (a) and 17(b).
Figure 17. (a, b) Evolution of the temperature (dashed lines) and pressure (solid lines) profiles during the formation of the detonation for the one-step model: (a) ; (b)
.
Since at high pressure the ranges of ‘speed’ limits separating regions of different modes, which are determined by the sound speeds, ,
and
decrease, the ranges for the realisation of all combustion modes decrease correspondingly [Citation37].
6.2. Detonation initiation by temperature gradient; detailed chemical model DRM-19
In this section, we show that the scenario of detonation initiation by the temperature gradient in CH4/air changes considerably for the detailed chemical model DRM19 compared to the one-step model. The ignition delay time of methane/air calculated using detailed chemical model and measured experimentally is much longer than that calculated using the one-step model. At the same time for the detailed chemical model DRM19 is about 2 orders larger than for the one-step model. This means that for ‘real chemistry’ a successful detonation initiation through the temperature gradient requires much shallower gradient and much larger critical size
of the hot spot than that predicted by a one-step model.
In the case of detailed chemistry, the initiating reactions proceed without heat release, and the gas-dynamic perturbations at the induction stage are very weak if any. The wave of exothermal reaction follows the spontaneous wave path with the delay determined by the time scale of termination reactions. Therefore, a steady detonation was not observed in simulations for shallower gradients up to for same initial conditions as in Figure (b) (
,
,
), while the one-step model can yield successful detonation for much steeper gradients. Using the condition of Equation (12) applied for the detailed DRM19 model, and the diagram similar to Figure , the minimum size of a hot spot, which can trigger a detonation for
,
is estimated: 140cm at
, 40cm at
, 12cm at
. As an example, Figure shows the formation of a combustion wave behind the weak shock, which runs ahead of the reaction wave front.
Figure 18. Evolution of the temperature (dashed lines) and pressure (solid lines) profiles calculated for DRM19 model for ,
,
.
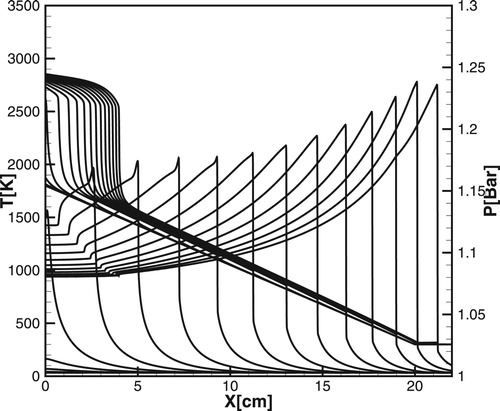
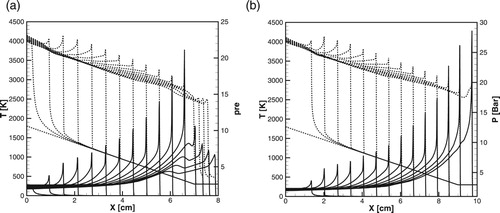
Figure 19. (a, b) Evolution of the temperature (dashed lines) and pressure (solid lines) calculated for DRM-19: (a); (b)
;
,
.
One would expect that the implementation of a steady detonation for the same temperature gradient can occur at higher pressures. However, the scenario for detailed chemistry at higher pressures differs significantly from that shown in Figures (a) and (b) for a one-step chemistry. Figures (a) and (b) show the time evolution of temperature and pressure profiles for the same conditions as in Figure (a) and 17(b). It is seen that the velocity of the spontaneous reaction wave at the minimum point, where the pressure wave overtakes the reaction wave, is not sufficient to sustain synchronous amplification of the pressure pulse in the flow behind the shock. The pressure wave runs ahead of the reaction wave, the velocity of the reaction wave decreases and the developing detonation quenches.
As it was discussed in the previous section, according to He and Clavin [Citation40,Citation41] Radulescu et al. [Citation46] and Liberman et al. [Citation37], the same temperature gradient, for which a detonation is quenching, can ignite a detonation for higher ambient temperature . One should keep in mind, that Equation (12) provides only the necessary but not sufficient condition for the minimum size
of the temperature gradient for producing a steady detonation.
Although the expected sizes of the temperature gradient for initiation detonation predicted by Equation(12) decrease with increasing initial pressure, it was found that the developing detonation quenches for all values in spite of rather large(
cm) sizes of the hot spot and pretty shallow temperature gradient. Even at the initial pressure,
a steady detonation can be produced by the temperature gradient only at high ambient temperature
, as it is shown in Figure , where a steady CJ-detonation is developed for the temperature gradient with the critical size
of the hot spot. In a sense, the high ambient temperature outside the gradient region is equivalent, but not completely, to effectively a higher reaction rate of the mixture, which facilitates coupling of the reaction wave and pressure wave. The induction stage, which is distinctive for real chemical reactions can be ‘skipped’ at sufficiently high ambient temperatures, and the scenario of a detonation wave formation at the end of the gradient or outside the gradient becomes more complicated.
Figure 20. Evolution of the temperature (dashed lines) and pressure (solid lines) for developing a steady detonation calculated for the DRM19 model; ,
.
Thus, even at the relatively high pressure 10 atm, the minimum size of a hot spot necessary to initiate detonation by the gradient mechanism is much larger than for the same conditions for the highly reactive hydrogen/air. At very high pressures, 40–50atm, a steady detonation can be produced by a steeper gradient in a relatively small hot spot, but also only at a sufficiently high temperature outside the hot spot, which is as higher as higher initial pressure. Another feature of the detonation initiation in methane/air is that since triggering detonation by the gradient mechanism is possible only at a high ambient temperatures, the volume thermal explosion ahead of the shock can occur before the developing detonation leaves the temperature gradient. Depending on the relation between the time of a steady detonation formation and the time of the thermal explosion development, the detonation can "meet" with a thermal explosion at the end or outside the temperature gradient. Therefore, such scenario in a certain sense looks more similar to a thermal explosion.
The difference between the detailed chemical model and a one-step model can be better understood using the thermal sensitivity of the induction time
(14)
(14) Approximating the induction time by the exponent,
, and taking into account that
, we obtain
(15)
(15) where
can be viewed as an effective global activation energy, which is different for the one-step and for the detailed chemical model.
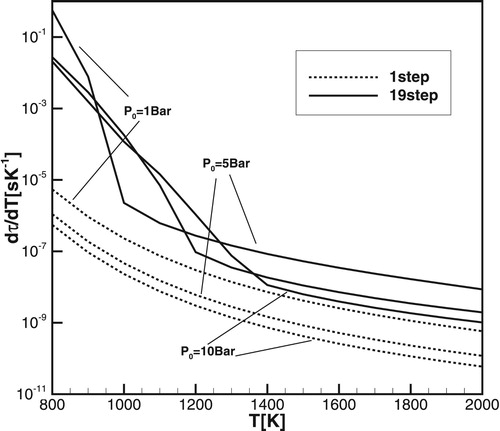
Figure shows calculated using the one-step model Equation (1) for methane/air, and for the DRM19 model for different pressures:
. It is seen that
for the DRM19 model approaches
for the one-step model with increasing pressure. Thus, the global activation energy for single-stage and detailed models becomes almost the same at sufficiently high pressures. However, since for the detailed model both values of
and
remain at least two orders of magnitude smaller than they are for the one-step model, the minimum size of the temperature gradient required for detonation initiation remains much larger in the case of detailed chemistry than it is for the one-step model and conditions for the detonation initiation in the case of detailed chemistry are considerably different.
Figure 21. calculated for the one-step model (dashed lines) and for the DRM19 model (solid lines) for different pressure:
,
,
.
7. Discussions and conclusions
In this work, we used detailed chemical kinetics models to study the conditions for a detonation initiation by the spontaneous wave inspired by a temperature gradient in highly reactive hydrogen/air mixtures and low reactive methane/air mixtures. Since many theoretical studies and simulations, undertaken to understand the explosion origin, suggest that the spontaneous wave and gradient mechanism are the mechanisms of the transition to detonation, specific focus has been placed on identifying conditions under which the detonation can be initiated by a spontaneous wave. The problem in question was studied using high-resolution numerical simulations, and the obtained results give the scales of the initial temperature nonuniformity required for initiation a detonation by the temperature gradient.
In the present work, we did not consider ‘cool flames’ and the low-temperature part of the induction time for CH4/air. Since at temperatures below 1100K the ignition delay time is longer 0.01s even at initial pressure 10atm, the low-temperature part of the induction time is not important. On the contrary, in the case of high compression engines where the initial pressure may exceed 40atm and for large hydrocarbon fuels such as n-heptane a low-temperature chemistry may be important for understanding the origin of knocking in SI-engines. The problem in question has been studied by Dai et al. [Citation47,Citation48] who have shown the importance of multistage ignitions at low temperatures. Their studies have shown also that a one-step model cannot describe the process of detonation initiation since it does not include low-temperature chemistry and multistage ignitions at low temperatures and the detonation induced by a cold spot within the Negative Temperature Coefficient region.
The results of high-resolution simulations performed for one-step models were compared with simulations for detailed chemical models. The calculated values of induction times for H2/air and for CH4/air were validated against experimental measurements for a wide range of temperatures and pressures. It is found that the requirements in terms of the temperature and size of hot spots, which produce a spontaneous wave capable to initiate detonation, are quantitatively and qualitatively different for one-step models compared to detailed chemical models. The induction time and the temperature derivative of the induction time, which determines the speed of the spontaneous wave, are in orders of magnitude smaller for one-step models in comparison with the values calculated using detailed chemical models and measured in experiments. As a consequence, for one-step models, the hot spots are much smaller and the temperature gradients initiating a detonation much steeper than those calculated using detailed chemical models. The difference between the one-step and the detailed chemical model is more pronounced for the low reactive CH4/air mixture. Even at the initial high pressure 10 atm, the minimum size of the hot spot for which the spontaneous wave can initiate detonation exceeds 6 cm. Also, a temperature gradient can produce a spontaneous wave igniting detonation only for a high temperatures outside the hot spot exceeding 1100K. Such temperatures can ignite a thermal explosion and unlikely to be achieved during the flame acceleration prior to DDT. One of the conclusions is that the gradient mechanism of DDT, which was previously proposed on the basis of two-dimensional simulations using a one-step model, is unlikely to be a mechanism of DDT at least in the case of methane/air. Contrary to methane/air mixtures, the detonation in hydrogen/air at very high pressures can be ignited by a small-scale initial nonuniformity, which is of substantial practical interest for risk assessment to minimize accidental explosions, in particular, for safety guidelines in nuclear power plants.
It is known [Citation12] that for a flame propagating in a tube with no-slip walls viscous dissipation in the flow ahead of the advancing flame heats the gas mixture increasing the temperature in the boundary layer by 150–200K higher than the gas temperature in the bulk flow near the tube axis. According to simulations of the flame propagating in submillimetre two-dimensional channels with a one-step model [Citation49–52] viscous heating in the boundary layer induces local explosions near the boundary, which in turn leads to DDT. In simulations using a one-step model, this leads to the autoignition producing a spontaneous wave, which occurs during the time about 10 µs for submillimetre channels (about 60 µs for 2cm channel) that elapse between the passage of the precursor shock and the flame arrival. However, the increased temperature and pressure in the boundary layer are far below the ignition threshold, and the ignition times are more than 100 times longer than the time that elapse between the passage of the shock and the arrival of the flame even at pressures up to 10 atm, which can be achieved prior to DDT i.e. for hydrogen/air. Besides, for more realistic model the temperature increase due to local viscous heating in the boundary layer is almost fully compensated by thermal conduction losses to the wall (
). Also, the width of the boundary layer (
) and the magnitude of the possible temperature gradient in it are too small to cause autoignition or spontaneous wave to initiate DDT. Therefore, most likely, the viscous heating in the boundary layer cannot cause either autoignition or spontaneous wave to initiate DDT.
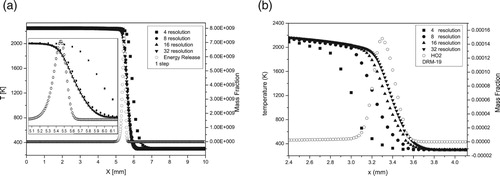
Another shortcoming of one-step models is the incorrect velocity-pressure dependence predicted by one-step models. Figures (a) and (b) show the velocity-pressure dependence of the laminar flames for H2/air in Figure (a) and for CH4/air in Figure (b) calculated for the one step models and for detailed chemical models. Symbols in Figure (a) and 22(b) show the experimental measurements of the laminar flame velocities for different pressures. The flame velocity-pressure dependence obtained for one-step models may cause incorrect values for the run-up distance predicted in the simulations of DDT.
Figure 22. (a, b) The flame velocity-pressure dependence calculated for: one-step and detailed chemical models. (a): H2/air; • – detailed model [Citation20]; experiments: □ – [Citation21]; ○ – [Citation53]. (b): CH4/air; experiments: ▿ – [Citation24], □ – [Citation54], ○ – [Citation55], ▵ – [Citation56], ⋄ – [Citation57] ![]()
![Figure 22. (a, b) The flame velocity-pressure dependence calculated for: one-step and detailed chemical models. (a): H2/air; • – detailed model [Citation20]; experiments: □ – [Citation21]; ○ – [Citation53]. (b): CH4/air; experiments: ▿ – [Citation24], □ – [Citation54], ○ – [Citation55], ▵ – [Citation56], ⋄ – [Citation57] Display full size – [Citation58]; Display full size – [Citation59]; +– [Citation60].](/cms/asset/526b2ccf-e4fb-4eaa-abe4-e7d868453c8c/tctm_a_1551578_f0022_ob.jpg)
The difference between induction times calculated using one-step models and detailed chemical models is inevitably associated with the calibration of one-step model parameters. The adiabatic flame temperature, and the Chapman–Jouguet (CJ) velocity
(16)
(16) depend on the initial temperature, the specific heat ratios,
,
and the chemical heat release
. The one-step Arrhenius kinetics cannot exactly reproduce all properties of laminar flames and detonations. The parameters,
and
in the one-step model are calibrated for a particular fuel to give a reasonable approximation of the laminar flame speed at normal conditions. As a result, the global activation energy
for one-step models is considerably smaller than the real activation energy calculated using detailed chemical models, which is demonstrated by comparison of the thermal sensitivity for H2/air and CH4/air in Figure and Figure , correspondingly. Probably by the same reasons unrealistic values of the ratio of specific heats 1.17 and 1.197 for H2/air and CH4/air were chosen in [Citation17] and [Citation8] instead of values 1.39 for H2/air and 1.38 for CH4/air.
All the same, simulations with a one-step model are of value as general examples of DDT in gaseous systems. However, it should be noted that, since both deflagration and detonation are stationary solutions, they appear to be stable attractors for all solutions in the vicinity of their base of initial data. This means that if a model allows unlimited acceleration of the flame, then the initially initiated deflagration will inevitably transit into detonation.
Acknowledgements
The authors are gratefully acknowledge insightful comments made by P. Clavin. M. Liberman acknowledges helpful discussions with Grisha Sivashinsky, Igor Rogachevskii, their collaborations and deep insights into problems presented in this paper. Many thanks to Alexander Konnov and Mikhail Kuznetsov for help with collection experimental data and for insights gleaned on detailed chemical schemes and DDT. Special thanks always to Dr Koshatsky (Inna) for the wonderful environment, unfailing companionship and valuable advice.
Disclosure statement
No potential conflict of interest was reported by the authors.
Additional information
Funding
References
- S. Kundu, J. Zanganeh, and B. Moghtaderi, A review on understanding explosions from methane–air mixture, J. Loss Prevent. Process Ind. 40 (2016), pp. 507–523. doi: 10.1016/j.jlp.2016.02.004
- G. Atkinson, E. Cowpe, J. Halliday, and D. Painter, A review of very large vapour cloud explosions: Cloud formation and explosion severity, J. Loss Prev. Process Ind. 48 (2017), pp. 367–375. doi: 10.1016/j.jlp.2017.03.021
- H. Eichert and M. Fischer, Combustion-related safety aspects of hydrogen in energy applications, Int. J. Hydrogen Energ 11 (1986), pp. 117–124. doi: 10.1016/0360-3199(86)90049-2
- H.J. Pasman, Challenges to improve confidence level of risk assessment of hydrogen technologies, Int. J. Hydrogen Energ 36 (2011), pp. 2407–2413. doi: 10.1016/j.ijhydene.2010.05.019
- M. Faraday and C. Lyell, Report on the explosion at the Haswell Collieries, and on the means of preventing similar accidents, Phil. Magazine 26 (1845), pp. 16–35.
- E.S. Oran and V.N. Gamezo, Origins of the deflagration-to-detonation transition in gas-phase combustion, Combust. Flame 148 (2007), pp. 4–47. doi: 10.1016/j.combustflame.2006.07.010
- G. Ciccarelli and S. Dorofeev. Flame acceleration and transition to detonation in ducts, Prog. Energy Comb. Sci. 34 (2008), pp. 499–550. doi: 10.1016/j.pecs.2007.11.002
- D.A. Kessler, V.N. Gamezo, and E.S. Oran, Simulations of flame acceleration and deflagration-to-detonation transitions in methane–air systems, Combust. Flame 157 (2010), pp. 2063–2077. doi: 10.1016/j.combustflame.2010.04.011
- Y.B. Zel’dovich, V.B. Librovich, G.M. Makhviladze, and G.I. Sivashinsky, On the development of detonation in a non-uniformly preheated gas, Acta Astronautica 15 (1970), pp. 313–321.
- Ya. B. Zel’dovich, Regime classification of an exothermic reaction with nonuniform initial conditions, Combust. Flame 39 (1980), pp. 211–214. doi: 10.1016/0010-2180(80)90017-6
- M. Kuznetsov, M. Liberman, and I. Matsukov, Experimental study of the preheat zone formation and deflagration to detonation transition, Combust. Sci. Technol. 182 (2010), pp. 1628–1644. doi: 10.1080/00102202.2010.497327
- M. Liberman, M. Ivanov, A. Kiverin, M. Kuznetsov, A. Chukalovsky, and T. Rakhimova, Deflagration-to-detonation transition in highly reactive combustible mixtures, Acta Astronaut 67 (2010), pp. 688–701. doi: 10.1016/j.actaastro.2010.05.024
- M. Ivanov, A. Kiverin, and M. Liberman, Flame acceleration and DDT of hydrogen-oxygen gaseous mixtures in channels with no-slip walls, Int. J. Hydrogen Energy 36 (2011), pp. 7714–7727. doi: 10.1016/j.ijhydene.2011.03.134
- M.F. Ivanov, A.D. Kiverin, M.A. Liberman, Hydrogen-oxygen flame acceleration and transition to detonation in channels with no-slip walls for a detailed chemical reaction model. Phys. Rev. E 83 (2011), pp. 056313 (1-16) doi: 10.1103/PhysRevE.83.056313
- M.F. Ivanov, A.D. Kiverin, I.S. Yakovenko, and M.A. Liberman, Hydrogen-Oxygen flame acceleration and deflagration-to-detonation transition in three-dimensional Rectangular channels with no-slip walls, Int. J. Hydrogen Energy 38 (2013), pp. 16427–16440. doi: 10.1016/j.ijhydene.2013.08.124
- J.H. Lee and I.O. Moen, The mechanism of transition from deflagration to detonation in vapor cloud explosions, Prog. Energy Combust. Sci. 6 (1980), pp. 359–389. doi: 10.1016/0360-1285(80)90011-8
- V.N. Gamezo, T. Ogawa, and E.S. Oran, Flame acceleration and DDT in channels with obstacles: Effect of obstacle spacing, Combust. Flame 155 (2008), pp. 302–315. doi: 10.1016/j.combustflame.2008.06.004
- A.C. Zambon and H.K. Chelliah, Explicit reduced reaction models for ignition, flame propagation, and extinction of C2H4/ CH4/H2 and air systems, Combust. Flame 150 (2007), pp. 71–91. doi: 10.1016/j.combustflame.2007.03.003
- M. Frenklach, N.W. Moriarty, B. Eiteneer, M. Goldenberg, C.T. Bowman, R.K. Hanson, S. Song, W.C. Gardiner Jr., V.V. Lissianski, G.P. Smith, D.M. Golden, and Z. Qin, Gri mech 3.0 http://www.me.berkeley.edu/gri-mech/.
- A. Kéromnès, W.K. Metcalfe, K.A. Heufer, N. Donohoe, A.K. Das, C.-J. Sung, J. Herzler, C. Naumann, P. Griebel, O. Mathieu, M.C. Krejci, E.L. Petersen, W.J. Pitz, and H.J. Curran, An experimental and detailed chemical kinetic modeling study of hydrogen and syngas mixture oxidation at elevated pressures, Combust. Flame 160 (2013), pp. 995–1011. doi: 10.1016/j.combustflame.2013.01.001
- G. Dayma, F. Halter, and P. Dagaut, New insights into the peculiar behavior of laminar burning velocities of hydrogen–air flames according to pressure and equivalence ratio, Combust. Flame 161 (2014), pp. 2235–2241. doi: 10.1016/j.combustflame.2014.02.009
- A. Kazakov and M. Frenklach, Reduced Reaction Sets based on GRI–Mech 1.2: 19–species reaction set; http://www.me.berkeley.edu/drm/.
- M. Goswami, S.C.R. Derks, K. Coumans, W.J. Slikker, M.H. de Andrade Oliveira, R.J.M. Bastiaans, C.C.M. Luijten, L.P.H. de Goey, and A.A. Konnov, The effect of elevated pressures on the laminar burning velocity of methane + air mixtures, Combust. Flame 160 (2013), pp. 1627–1635. doi: 10.1016/j.combustflame.2013.03.032
- M. Goswami, K. Coumans, R.J.M. Bastiaans, A.A. Konnov, and L.P.H. de Goey, Numerical simulations of Flat laminar Premixed methane-Air flames at elevated pressure, Combust. Sci. Technol. 186 (2014), pp. 1447–1459. doi: 10.1080/00102202.2014.934619
- M.W. Slack, Rate Coefficient for H + O2+ M = HO2 + M Evaluated from shock tube measurements of induction times, Combust. Flame 28 (1977), pp. 241–249. doi: 10.1016/0010-2180(77)90031-1
- A.D. Snyder, J. Robertson, D.L. Zanders, and G.B. Skinner, Tech. Rep. AFAPL-TR-65-93(1965).
- M. Slack and A. Grillo, Investigation of hydrogen-air ignition sensitized by nitric oxide and by nitrogen dioxide, Tech. Rep. RE-537, Grumman Research Department (1977).
- E. Hu, L. Pan, and Z. Gao, Shock tube study on ignition delay of hydrogen and evaluation of various kinetic models, Int. J. Hydrogen Energy 41 (2016), pp. 13261–13280. doi: 10.1016/j.ijhydene.2016.05.118
- K.A. Bhaskaran, M.C. Gupta, and T. Just, Shock tube study of the effect of unsymetric dimethyl hydrazine on the ignition characteristics of hydrogen-air mixtures, Combust. Flame 21 (1973), pp. 45–48. doi: 10.1016/0010-2180(73)90005-9
- B.L. Wang, H. Olivier, and H. Grönig, Ignition of shock-heated H2-air-steam mixtures, Combust. Flame 133 (2003), pp. 93–106. doi: 10.1016/S0010-2180(02)00552-7
- L. Pan, E. Hu, F. Deng, Z. Zhang, and Z. Huang, Effect of pressure and equivalence ratio on the ignition characteristics of dimethyl ether-hydrogen mixtures, Int. J. Hydrogen Energy 39 (2014), pp. 19212–19223. doi: 10.1016/j.ijhydene.2014.09.098
- W. Zeng, H. Ma, Y. Liang, and E. Hu, Experimental and modeling study on effects of N2 and CO2 on ignition characteristics of methane/air mixture, J. Advanced Research 6 (2015), pp. 189–201. doi: 10.1016/j.jare.2014.01.003
- E. Hu, X. Li, X. Meng, Y. Chen, Y. Cheng, Y. Xie, and Z. Huang, Laminar flame speeds and ignition delay times of methane–air mixtures at elevated temperatures and pressures, Fuel 158 (2015), pp. 1–10. doi: 10.1016/j.fuel.2015.05.010
- A.D. Kiverin, D.R. Kassoy, M.F. Ivanov, and M.A. Liberman, Mechanisms of ignition by transient energy Deposition: regimes of combustion waves propagation, Phys. Rev. E87 (2013), p. 033015.
- A.K. Kapila, D.W. Schwendeman, J.J. Quirk, and T. Hawa, Mechanisms of detonation formation due to a temperature gradient, Combust. Theor. Modell. 6 (2002), pp. 553–594. doi: 10.1088/1364-7830/6/4/302
- M. Liberman, A. Kiverin, and M. Ivanov, On detonation initiation by a temperature gradient for a detailed chemical reaction models, Phys. Lett. A 375 (2011), pp. 1803–1808. doi: 10.1016/j.physleta.2011.03.026
- M.A. Liberman, A.D. Kiverin, and M.F. Ivanov, Regimes of chemical reaction waves initiated by nonuniform initial conditions for detailed chemical reaction models, Phys. Rev. E 85 (2012), p. 056312. doi: 10.1103/PhysRevE.85.056312
- X.J. Gu, D.R. Emerson, and D. Bradley, Modes of reaction front propagation from hot spots, Combust Flame 133 (2003), pp. 63–74. doi: 10.1016/S0010-2180(02)00541-2
- L. He and P. Clavin, Critical conditions for detonation initiation in cold gaseous mixtures by nonuniform hot pockets of reactive gases, Proc. Comb. Inst. 24 (1992), pp. 1861–1867. doi: 10.1016/S0082-0784(06)80218-3
- L. He and P. Clavin, Theoretical and numerical analysis of the photochemical initiation of detonations in hydrogen-oxygen mixtures, Proc. Comb. Inst. 25 (1994), pp. 45–51. doi: 10.1016/S0082-0784(06)80626-0
- P. Clavin and L. He. Direct initiation of Gascous detonations, Journal de Physique IV Colloque 5 (1995) C4, pp. 431–440.
- P. Clavin, G. Searby, Combustion waves and Fronts in flows, Cambridge University Press, Cambridge, UK, 2016.
- B. Luke, D. Bradley, G. Paczko, and N. Peters, Engine hot spots: modes of auto-ignition and reaction propagation, Combust Flame 166 (2016), pp. 80–85. doi: 10.1016/j.combustflame.2016.01.002
- J. Warnatz, U. Maas, R.W. Dibble, Combustion. Physical and chemical fundamentals, modeling and simulations, experiments, pollutant formation, Springer, New York, USA, 2001.
- J.O. Hirschfelder, C.F. Gurtiss, and R.B. Bird, Molecular theory of gases and liquids, Wiley, New York, 1964.
- M.I. Radulescu, G.J. Sharpe, D. Bradley, A universal parameter for quantifying explosion hazards, detonability and hot spot formation, the χ number, in Seventh International Seminar on Fire and explosion hazards, Bradley D., Makhviladze G., Molkov V., Sunderland P., Tamanini, F., eds., Maryland Research Publishing, Maryland, USA, 2013. pp. 617–626.
- P. Dai and Z. Chen, Supersonic reaction front propagation initiated by a hot spot in n-heptane/air mixture with multistage ignition, Combust. Flame 162 (2015), pp. 4183–4193. doi: 10.1016/j.combustflame.2015.08.002
- P. Dai, C. Qi, and Z. Chen, Effects of initial temperature on autoignition and detonation development in dimethyl ether/air mixtures with temperature gradient, Proc. Combust. Inst.. 36 (2017), pp. 3643–3650. doi: 10.1016/j.proci.2016.08.014
- D. Valiev, V. Bychkov, V. Akkerman, L.-E. Eriksson, and M. Marklund, Heating of the fuel mixture due to viscous stress ahead of accelerating flames in deflagration-to-detonation transition, Phys. Lett. A 372 (2008), pp. 4850–4857. doi: 10.1016/j.physleta.2008.04.066
- D.M. Valiev, V. Bychkov, V. Akkerman, and L.E. Eriksson, Different stages of flame acceleration from slow burning to Chapman–jouguet deflagration, Phys. Rev. E 80 (2009), p. 036317. doi: 10.1103/PhysRevE.80.036317
- R.W. Houim, A. Ozgen, and E.S. Oran, The role of spontaneous waves in the deflagration-to-detonation transition in submillimetre channels, Combust. Theor. Modell. 20, (2016), pp. 1068–1087. doi: 10.1080/13647830.2016.1249523
- W. Han, Y. Gao, and C.K. Law, Flame acceleration and deflagration-to-detonation transition in micro- and macro-channels: An integrated mechanistic study, Combust. Flame 176 (2017), pp. 285–298. doi: 10.1016/j.combustflame.2016.10.010
- T. Kitagawa, T. Nakahara, K. Maruyama, K. Kado, A. Hayakawa, and S. Kobayashi, Turbulent burning velocity of hydrogen-air premixed propagating flames at elevated pressures, Int. J. Hydrogen Energy 33 (2008), pp. 5842–5849. doi: 10.1016/j.ijhydene.2008.06.013
- G. Rozenchan, D.L. Zhu, C.K. Law, et al. Outward propagation, burning velocities, and chemical effects of methane flames up to 60 atm. Proc. Combust. Inst.. 29 (2002), pp. 1461–1470. doi: 10.1016/S1540-7489(02)80179-1
- X.J. Gu, M.Z. Haq, M. Lawes, and R. Woolley, Laminar burning velocity and Markstein lengths of methane–air mixtures, Combust. Flame 121 (2000), pp. 41–58. doi: 10.1016/S0010-2180(99)00142-X
- H. Kobayashi, T. Nakashima, T. Tamura, K. Maruta, and T. Niioka, Turbulence measurements and observations of turbulent premixed flames at elevated pressures up to 3.0 MPa, Combust. Flame 108 (1997), pp. 104–117. doi: 10.1016/S0010-2180(96)00103-4
- M.I. Hassan, K.T. Aung, and G.M. Faeth, Measured and predicted properties of laminar premixed methane/air flames at various pressures, Combust. Flame 115 (1998), pp. 539–550. doi: 10.1016/S0010-2180(98)00025-X
- O. Park, P.S. Veloo, N. Liu, et al. Combustion characteristics of alternative gaseous fuels, Proc. Combust. Inst. 33 (2011), pp. 887–894. doi: 10.1016/j.proci.2010.06.116
- F.N. Egolfopoulos and C.K. Law, Chain mechanisms in the overall reaction orders in laminar flame propagation, Combust. Flame 80 (1990), pp. 7–16. doi: 10.1016/0010-2180(90)90049-W
- F.N. Egolfopoulos, P. Cho, and C.K. Law, Laminar flame speeds of methane-air mixtures under reduced and elevated pressures, Combust. Flame 76 (1989), pp. 375–391. doi: 10.1016/0010-2180(89)90119-3
- G.A. Sod, A survey of several finite difference methods for systems of nonlinear hyperbolic conservation laws, J. Comput. Phys. 27 (1978) 1–31. doi: 10.1016/0021-9991(78)90023-2
Appendix. Verification of grid convergence: resolution and convergence tests
In direct simulation of multi-species reactive flows, the flow and chemical time scales may be comparable, but the spatial resolution required for chemistry demands fine grids in order to resolve the thin reaction zones. The time step allowed when integrating the governing equations with explicit schemes is controlled by the diffusive stability limit dictated by these few chemical species. Resolution and convergence tests were thoroughly performed to ensure that the resolution is adequate to describe and to capture details of the problem in question and to avoid computational artefacts. This is especially important for a mixture consisting of many species with a large number of reactions in the case of a detailed chemical model. To verify the independence of the presented results on grid resolution, we performed large series of test simulations with uniform grid resolution for different grid sizes for normal and elevated pressures.
Figures and show the resolution and convergence tests for the structure and velocities of the laminar H2/air flames for simulations with a one-step and detailed chemical schemes. The convergence of the solution is quite satisfactory already for 8 grid points per flame width at initial pressure 1atm.
Figure A1. Resolution test for structure of stoichiometric hydrogen/air flame at normal conditions () for a one-step model.
Figure A2. Resolution test for structure of stoichiometric hydrogen/air flame at normal conditions () for a detailed chemical model [Citation20].
![Figure A2. Resolution test for structure of stoichiometric hydrogen/air flame at normal conditions (T0=300K,p0=1atm) for a detailed chemical model [Citation20].](/cms/asset/c0bdee8c-28c4-4174-9b3a-4238a543f2c3/tctm_a_1551578_f0024_ob.jpg)
The convergence for the flame velocity in simulations with a one/step model and for detailed model [Citation20] is shown in Figure . A grid spacing independence was verified up to the resolution of 32 grid points per width of the flame and higher, which corresponds to the cell size less than 10–12 µm. The resolution of 8 grid points per flame width is able to capture a good description of the flame at P0 = 1atm, but higher resolutions are requiered at elevated pressures.
Figure A3. The convergence of solutions for the flame velocity in hydrogen/air flame at normal conditions for a one-step model and for a detailed chemical model [Citation20].
![Figure A3. The convergence of solutions for the flame velocity in hydrogen/air flame at normal conditions for a one-step model and for a detailed chemical model [Citation20].](/cms/asset/38b17d97-fadb-4a81-b8a1-89279f9e11a9/tctm_a_1551578_f0025_ob.jpg)
Figure (a) and (b) shows resolution tests for the structure and velocity of methane-air flame for simulations with one-step and for DRM-19 chemical model.
Figure A4. (a, b) Resolution tests. a) One-step, b) DRM-19 models (T0 = 300 K, P0 = 1 atm).
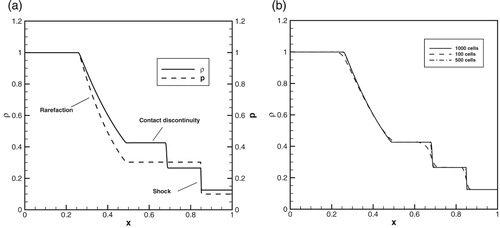
The most demanding is the case where the detonation arises as a result of auto-ignition inside the hot-spot. The detonation produced by the Zel’dovich gradient mechanism arose via the following stages: (1) the spontaneous combustion wave is formed, (2) the spontaneous wave decelerates and the pressure waves are formed behind the spontaneous wave, (3) the spontaneous reaction wave is coupled with pressure wave, which is amplified the shock wave, (4) detonation established after the transient process involving reaction wave accelerated in the flow behind the outgoing shock wave. Due to this sequence of the events one should appropriately resolve the combustion waves propagating through reacting medium on the background of elevated temperature and pressure behind the shock front. Besides, the coupling of the reaction wave and shock should be resolved taking into account that the flame thickness is much larger than the width of the shock front. According to this we performed a common test for the accuracy of computational fluid codes, which was heavily investigated by Sod [Citation61]. Figures (a) and (b) show solution for the Sod problem (Figure (a)) and numerical solution to the problem (Figure (b)).
It is seen from Figure (b) that the converged solution for the detonation initiation problem requires to use a finer resolution from the very beginning. For the model considered in the present paper the resolution was taken with at least 48 computational cells per flame front at normal conditions, that agree well with the results obtained previously. At elevated pressures the flame thickness decreases. On the other hand the diffusivity of the numerical scheme smoothens the shock front over 5 computational cells. Therefore no artificial coupling is possible for the chosen meshes determining fine resolution.
Figure A5. (a, b) Analytical solution (5a) for the Sod problem and numerical solution to the problem (Figure (b)).