
 ?Mathematical formulae have been encoded as MathML and are displayed in this HTML version using MathJax in order to improve their display. Uncheck the box to turn MathJax off. This feature requires Javascript. Click on a formula to zoom.
Abstract
In this work, a quasi-one-dimensional ZND model of detonation considering the expansion process perpendicular to the detonation propagation direction is extended to the rotating detonation engine (RDE) to investigate the influence of expansion on the detonation waves in RDEs. This model is first used in more general cases of one-dimensional detonation waves, coupled with the one- and two-step kinetic models for stoichiometric hydrogen-air mixtures. The expansion has an effect on reducing the detonation propagation speed and can be attributed to two factors: the extra work during expansion and the lost heat released behind the sonic point. The one that plays the more important role depends on the kinetic model. Finally, a set of numerical simulations of RDEs are performed for comparison with the theoretical model. The results show that the expansion process in RDEs reduces the speed of the detonation wave by approximately 5%, which is an important factor for the detonation velocity deficit in two-dimensional simulations.
Introduction
Detonation is a premixed combustion mode; the shock wave and following reaction zone form the detonation wave. Compared with deflagration, detonation generates lower entropy and thus has higher efficiency. One way to use detonation for propulsion is with the rotating detonation engine (RDE). The potential thermodynamic advantages of detonation make RDEs one of the most promising propulsion systems for use in aircraft and rocket engines. The basic concept of RDEs was first introduced by Voitsekhovskii [Citation1] and research on RDEs are now being conducted in several laboratories around the world, including in Russia [Citation2,Citation3], Poland [Citation4], the US [Citation5,Citation6], France [Citation7,Citation8], Japan[Citation9] and China [Citation10,Citation11]. Furthermore, many initial numerical studies have been performed on topics such as the basic physics [Citation12–14], detailed mechanism [Citation15–17], thermodynamic analysis [Citation18,Citation19], and performance [Citation16]. Moreover, theoretical studies have been performed to investigate RDEs, including some basic characteristics of detonation [Citation20] and models to evaluate the flow field [Citation21,Citation22].
In all experiments and previous simulations of RDEs [Citation18], it was found that the detonation propagation velocity in two-dimensional simulations with Euler equations is different from those from the C-J theory or one-dimensional simulations. The mixing and viscosity may have significant effects on the velocity in experiment, but the difference exists in simulations with reacting Euler equations which is a much ideal situation. This phenomenon implies that the detonation waves in RDEs are different from those of a one-dimensional C-J detonation. The difference can be attributed to the expansion flow field perpendicular to the detonation propagating direction, which is pointed out by Hishida and Bellenoue et al. [Citation13,Citation20]. But nowadays, this explanation is never verified directly in RDEs, and the main objective of this paper is performing the verification. Firstly, the ideas of Fujiwara et al. and Tsuge et al. [Citation23,Citation24] are extended from circular tube to RDEs. Then the influence of the expansion on the detonation wave propagating velocity in RDEs can be verified and studied. While real detonation waves have strong three-dimensional effects and one- and two-step reaction kinetics can result in significant error, there are nonetheless a lot of simulations being performed under these conditions. Hence, this paper can provide references for the results of those numerical simulations.
Physical and numerical modelling
Physical modelling
Figure shows the schematic of a typical co-axial annular combustor model of RDEs with all the main flow structures. One or more detonation waves propagate azimuthally in the annular combustor, each of which combines with an oblique shock wave and a slip line. The fresh propellant is injected from the head of the combustor and the products exhaust from the exit.
Figure 1. Schematic of an RDE.
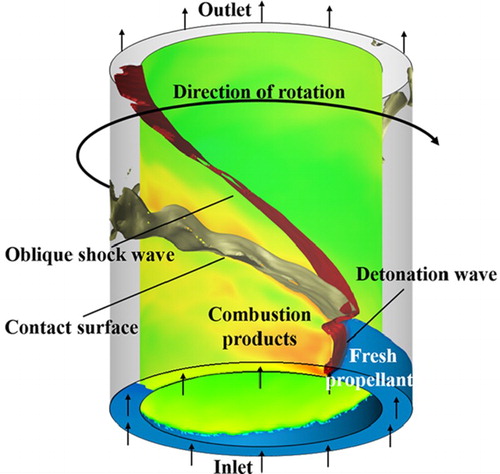
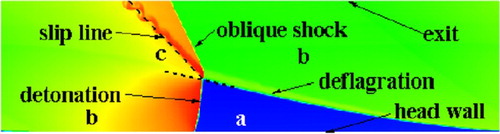
Figure shows the unrolled contours of the flow field. If the chamber width along the radial direction is much smaller than the diameter and the axial length, then the flow field can be approximated as a 2D cylindrical surface without thickness. To clearly demonstrate this, the cylindrical surface is unrolled into a rectangular plane.
Figure 2. Typical RDE flow field in a two-dimensional simulation a-fresh propellants; b-reaction products; c-reaction products from the previous cycle.
When the waves propagate at a certain speed, the flow field can be considered as a steady flow in the reference frame fixed on the detonation front. This makes the main flow field supersonic, allowing us to analyze the flow field with many well-developed steady supersonic flow theories. In the wave-fixed reference frame, fresh propellant flows against the detonation front at the speed of the detonation wave and form the products flowing downstream. A part of the products will meet the oblique shock wave depending on the length of the RDE [Citation18]. Because gases cannot go across the slip line, the inclination of the slip line indicates the expansion direction behind the detonation wave. Furthermore, the oblique shock wave is induced by the inclined slip line. It is noteworthy that only a little gas can cross the deflagration surface if the deflagration is slow enough. Under these conditions, the contact surface between the fresh propellants and products is approximately a slip line. As a result, the contact surface between the fresh propellants and the products can be seen as the flow direction of fresh propellants in front of the detonation wave in the wave-fixed reference frame.
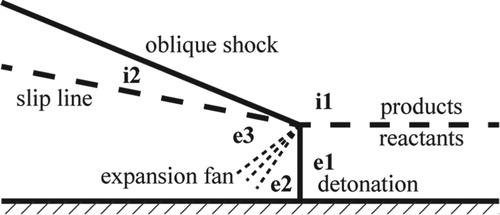
The steady-state analysis of RDE flow fields using the method of characteristics (MOC) [Citation21] with the ideal detonation-inert model has been previously investigated, as shown in Figure . This model considers the expansion behind the detonation wave using the Prandtl–Meyer theory and assumes the detonation wave as a shock wave with a response described by C-J theory. This model can predict the expansion angle and the detached oblique shock conditions. However, in this model, the expansion has no effect on the detonation wave because the length of the reaction zone is neglected. The flow behind the leading shock wave is subsonic if the leading shock wave and the reaction zone are taken into consideration, resulting in the failure of both the MOC method and the Prandtl–Meyer function.
Figure 3. Ideal detonation-inert model in the wave-fixed reference frame
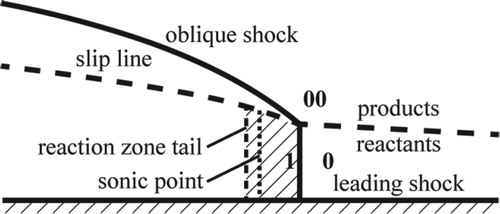
The model of Fujiwara et al. and Tsuge et al. [Citation23,Citation24] is used here. Figure shows a sketch of the steady quasi-1D ZND model. The leading shock wave is followed by an expansion reaction zone. The flow field can be understood as a detonation wave propagating in a flexible tube bounded by the slip line and the head wall. The model reflects the expansion behind the detonation wave by the increase of the cross-section (the height from head wall to slip line).
Figure 4. ZND model in the steady quasi-1D analysis.
In Figure , line 0 is the leading shock wave. The relation between side 0 and side 1 is given by the Rankine-Hugoniot condition as
(1)
(1)
(2)
(2)
(3)
(3) where
denote the pressure, temperature and Mach number, respectively, and
and
.
The reaction zone stretches behind the leading shock wave. Considering the one-dimensional steady reaction flow, the equations describing the flow below the slip line are expressed as
(4)
(4)
(5)
(5)
(6)
(6) where
is the cross section area of the flow field,
denotes the reaction progress parameter (that varies from 0 to 1),
is the heat released per unit mass,
is the density,
is the velocity and
is the pressure below the slip line.
The reaction kinetics can be given by a one-step kinetic model according to
(7)
(7) The parameters used in the model have been adopted from Ma and Yang [Citation25]. For the stoichiometric hydrogen/air mixture, the following parameters were used
. Alternatively, the two-step kinetics model can also be used here and is given as
(8)
(8)
(9)
(9) The kinetic parameters in the model have been adopted from Taki and Fujiwara [Citation26]. For the stoichiometric hydrogen/air mixture, the following parameters were used
. The relation between
and
is given by
.
The equation describing the variation of the cross-sectional area is necessary to close the equations. Considering the hypersonic characteristic of the oblique shock wave, the pressure field above the slip line can be approximated by the modified Newton-Busemann model [Citation27]
(10)
(10) where
denotes the velocity of the detonation wave, and
,
. This model applies in the case of hypersonic gases flowing over a ramp, considering finite Mach number. This equation describes the relation between the pressure above the slip line and the shape of the slip line. Because the pressure on both sides of the slip line is equal, the variation of the cross sectional area can be expressed by an ordinary differential equation. The model is based on hypersonic theory and will fail when the density of zone 00 is small. Namely, zone 00 cannot be the high temperature zone. Therefore, an equivalent expansion slope is proposed to overcome the problem, given by
(11)
(11) where
denotes the expansion slope. To model the expansion in RDEs, the equivalent expansion slope needs to be extracted from the numerical results and will be discussed later in this paper.
Solving the linear equations of from Equs. (4–6) results in
(12)
(12)
There should be no singularity in the flow field when the Mach number equals to 1, so the numerator and denominator of Equation (12) get zero at the same time
(13)
(13)
If the expansion does not occur, then Equation (13) degenerates to the C-J condition.
Numerical method
To conclude the steady quasi-1D model, the numerical method is described below.
Step 1. Input the state in front of the leading shock.
Step 2. Assume a detonation propagation velocity.
Step 3. Calculate the status behind the leading shock wave using Equations (1–3).
Step 4. Solve the ordinary differential equations using the state behind the leading shock wave as the initial conditions.
Step 5. Determine whether the condition of Equation (13) are satisfied within some scope of tolerance.
If that is satisfied, the assumed detonation velocity is the required velocity.
If not, the assumed detonation propagation velocity is changed and the process recommences at step 3.
The equations solved in step 4 are obtained from Equations (4–11) and listed below
(14)
(14)
(15)
(15)
(16)
(16)
(17)
(17)
(18)
(18)
If the one-step kinetic model is used, Equation (7) is used to solve , while if the two-step kinetic model is used Equations (8–9) are used to solve
. The ode15s function in MATLAB is used as the ODE solver, which is an implicit stiff ODE solver using adaptive integral steps. More than 3000 integral steps were used to cover the reaction zone, which confirms that the resolution is sufficient.
When the detonation propagation velocity is acquired, the flow field profile in front of the sonic point is known. The sonic point can be advanced over by an explicit step; then, the flow field profile behind the sonic point can be obtained.
Results and discussion
Results with the one-step kinetic model
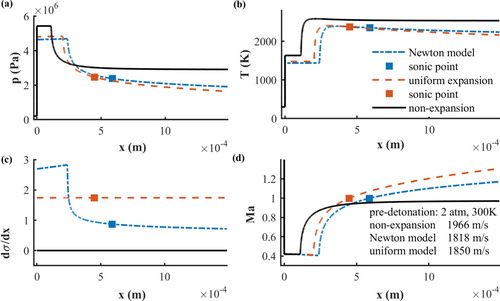
The profiles of the flow field calculated by the one-step kinetic model are shown in Figure . In the non-expansion case, the gases will be accelerated from the leading shock wave to the speed of sound in the exothermic reaction zone. Behind the sonic point, no expansion occurs and the state of the gases remain constant. These results agree well with the one-dimensional C-J theory and thus validate the numerical method. In the case of expansive detonation, the gases accelerate to the speed of sound and then exceed it in the reaction zone. Behind the sonic point, the flow is a typical supersonic expansion flow. Compared with the non-expansive case, the expansive detonation propagation velocity is smaller and the strength of the detonation is weaker.
Figure 5. Profiles of the flow field calculated by the one-step kinetic model (a) pressure; (b) temperature; (c) expansion slope; (d) Mach number.
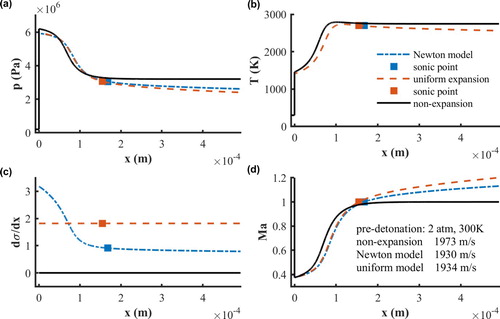
The detonation profiles using the Newton expansion model and the uniform expansion model are plotted for comparison in Figure . A series of Newton model cases with various pre-detonation temperatures and pressures have been explored, and the profiles of the expansion slope were found to be similar to that in Figure (c). In the Newton model, the maximum expansion slope was approximately three times the value of that at the sonic point. This enabled us to establish a connection between the two models. That is, we take twice the value of the expansion slope at the sonic point of the Newton model as the equivalent expansion slope. Figure shows that the propagation velocity and the flow field, including the pressure, temperature and Mach number determined by the two models are close under this assumption. In the RDEs, the slip line slope away from the detonation wave can be seen as the slope at the sonic point. Accordingly, we can obtain the equivalent slope in the uniform expansion model using this assumption. This method will be used in section 3.3.
The p-v diagram of the detonation wave with and without the extra expansion process is plotted in Figure for comparison. For detonation waves in the classic ZND model, in the p-v diagram, the leading shock wave and the reaction process fall on the same line, the Rayleigh line, which is tangential to the Hugoniot line. While for detonation waves with the extra expansion, the reaction process is coupled with the expansion process and the states behind the reaction zone are below the Hugoniot line. There are two reasons for the deficit of the detonation propagation velocity. First, the expansion process makes the Rayleigh line, whose slope represents the Mach number of detonation waves, no longer tangential to the Hugoniot line and thus reduces its slope. It can be seen from the p-v diagram that the gases do more work in the reaction process because of the expansion. Second, according to the generalised C-J condition in Equation (13), the flow speed reaches the speed of sound before the end of the reaction. By the theory of supersonic flows, the reaction behind the sonic point makes no contribution to the detonation wave, which means that the expansive detonation wave is equivalent to a partially reactive detonation wave. In detonation waves using the one-step kinetic model, the expansion process is the main influencing factor on the detonation velocity.
Figure 6. Comparison of p-v diagram between expansion and non-expansion detonation waves.
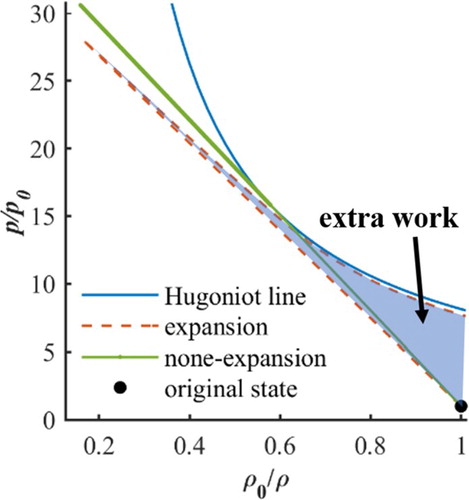
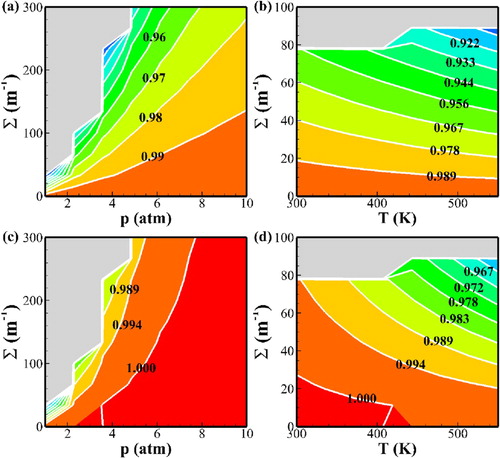
Figure shows the normalised velocity of detonation , where
and
represent the detonation velocity with and without expansion, respectively, and
denotes the expansion slope
. From Figure , it can be seen that a stronger expansion results in a higher deficit of the detonation velocity. Figure (a) indicates that the pre-detonation pressure has no influence on the normalised deficit of the detonation velocity. That can be explained by the p-v diagram. The equation of the dimensionless Hugoniot line is independent of
; therefore, in the dimensionless p-v diagram, the pre-detonation pressure does not have any effect, neither on the Hugoniot line nor the initial state point.
Figure 7. Normalised velocity of detonation (colour and line labels) under the variation of the pre-detonation state, where
denotes
(a) with a constant temperature of 450 K; (b) with constant pressure 2 atm.
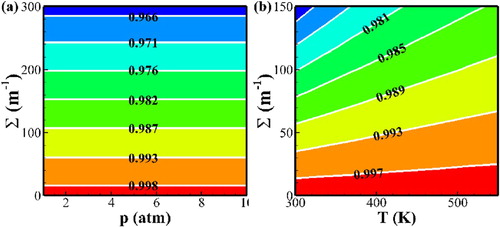
In Figure (b), if we fix , then
increases when
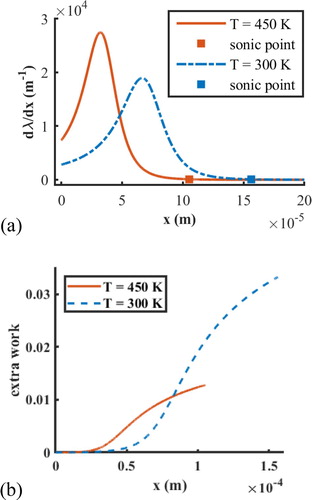
increases, which means that the normalised deficit of the velocities reduces when the temperature in front of the detonation wave increases. The reason for this is that a higher temperature shortens the expansion zone, and the shorter expansion zone reduces the extra work (heat loss) in the transverse expansion, as shown in Figure . The extra work here means the work in an extra transverse expansion process comparing with the non-expansion case. The extra work makes some part of energy lose the contribution to the detonation velocity. This further confirms that the deficit of the detonation speed is mainly controlled by the expansion in a one-step kinetic model.
Figure 8. Comparison of the reaction rate when the pre-detonation temperature changes at 2 atm (a) reaction rate (b) extra work in reaction process in front of sonic point (In the p-v diagram, the extra work can be defined as the area between the leading shock process line and reaction-expansion process line shown in Fig. ).
Results with the two-step kinetic model
Except for two main differences, the flow field profiles calculated by the one-step and two-step kinetic models are similar, as seen in Figure . The first difference is the existence of the induction zone and the second is that the two-step reaction is a reversible reaction. The equilibrium reaction progress parameter reflects the ratio of the heat release. Profiles calculated by the uniform expansion model and the Newton model can be compared in Figure . The equivalent expansion slope is set by the method discussed in 3.3, and the profiles in front of the sonic point of the two models are very close.
Figure 9. Profiles of the flow field calculated by two-step kinetics model with pre-detonation (a) pressure; (b) temperature; (c) expansion slope; (d) Mach number.
The normalised velocity of the detonation and the equilibrium reaction progress parameters are shown in Figure . When the expansion slope increases, the deficit of the detonation velocity also increases, as expected. The pressure and the deficit of the detonation velocity are negatively related, while the temperature and the deficit of the detonation velocity are positively related. The expansion and the shifting of the reaction equilibrium are coupled. With a lower temperature or a higher pressure, the equilibrium reaction progress parameter becomes closer to one. According to the equilibrium reaction progress parameter shown in Figure (c and d), it is known that the normalised deficit of the detonation velocity is mainly controlled by the chemical equilibrium. This is in better agreement with real-world situations.
Figure 10. Normalised velocity of detonation and equilibrium reaction progress parameter (colour and line labels) under the pre-detonation state variation, where denotes
(a) the normalised deficit of velocities
with a constant temperature of 450 K; (b) normalised deficit of velocities
with constant pressure of 2 atm; (c) equilibrium reaction progress parameter
with a constant temperature of 450 K; (d) equilibrium reaction progress parameter
with a constant pressure of 2 atm.
Comparison with two-dimensional RDE simulation
In order to verify the model in rotating detonation engine and explain the velocity deficit in two-dimensional RDE simulation directly, a series of two-dimensional simulation of RDE are given. In the simulations, the reactant was a stoichiometric hydrogen-air mixture, and the reaction kinetics were given by the two-step kinetic model. The convergence nozzle inflows are used as the injection condition. The other numerical setups were the same as those outlined by Zhou and Wang [Citation18].
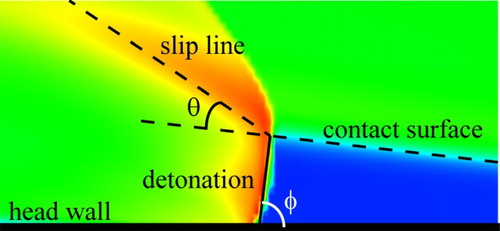
The geometry informations can be extracted from the numerical results by the discontinuity of the flow field, as shown in Figure (which is a scope of Figure ) The bottom is the injection head wall. The blue region represents the fresh gas while the other colours denote the reaction products. The detonation front is not perpendicular to the head wall and its angle is denoted as . The detonation propagation velocity can be calculated as
, where
is the azimuthal propagation speed and
is the inclination of the detonation wave. The final expansion angle
is the angle between the slip line and the extended line of the contact surface. The assumption mentioned in section 3.1 is used, so the equivalent slope is set to
.
Figure 11. Definition of geometric parameters in the RDE flow field.
A set of simulation cases with varying inlet total pressures and temperatures have been analyzed. The detonation propagating velocities in two-dimensional simulations are extracted with the method mentioned before. And the pre-detonation temperature and pressure can be also extracted from simulation, with which the corresponding ideal C-J detonation velocity can be calculated. Also, the equivalent expansion slope can be extracted from simulations, with which the corresponding detonation velocity can be calculated with the model illustrated in previous sections. Using the ideal C-J detonation velocity, the normalised detonation velocities in simulations and expansion model are obtained shown in Figure .
Figure 12. Comparison between the numerical and expansion model for the deficit of the detonation velocity when the inlet stagnation state changes (a) with a constant total temperature of 450 K; (b) with a constant total pressure of 5 atm.
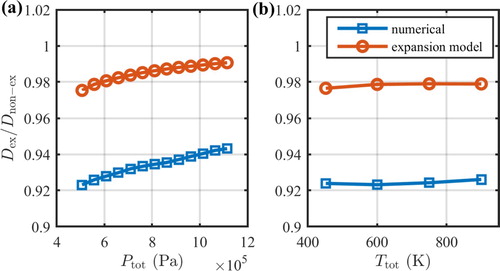
When the inlet total pressure increases, the pre-detonation pressure increases, while the pre-detonation temperature decreases. Under these circumstances, the deficit of the detonation velocity will reduce, which is in accordance with the theoretical results. When the inlet total temperature
increases, the pre-detonation pressure and the pre-detonation temperature increase. The deficit of the detonation velocity remains basically unchanged. The theoretical and numerical results show similar trends and the deficit of the detonation velocity are of the same order of magnitude (∼5%). This proves that the process of expansion reduces the detonation wave velocity of the rotating detonation waves, and the effect can be described by the model in this article. Quantitatively there are some differences in the velocity deficits between the 1D-expansion model and the 2D-numerical simulation. Two main reasons are known for now. The first reason is that some expansion waves exist between the detonation wave and the headwall except for between the detonation wave and the slip line[Citation21]. Those expansion waves are not considered in this model. Better results may be obtained by the real two-dimensional analysis like the method of characteristics. The second reason is the numerical diffusion in the 2D-simulation. The diffusion can result in some extra energy loss.
Conclusions
Based on the quasi-1D ZND model, a detonation wave model considering the expansion process is used to investigate the deficit of the detonation velocity with the one- and two-step kinetic models. The main findings are as follows:
The expansion in the reaction zone of the detonation reduces the propagation velocity of the detonation waves. The expansion slope and the deficit of the detonation propagation velocity are positively related.
The deficit of the detonation velocity is affected by two major factors. The first is that the expansion process makes the Rayleigh line no longer tangential to the Hugoniot line and reduces its slope, resulting in the gases doing more work in the reaction. The other is that the reacted gases reach the sound speed before the end of the reaction, which makes the heat released after the sonic point contribute little to the detonation velocity.
For the one-step kinetic model, the deficit of the detonation velocity is mainly controlled by the expansion process. In this case, the deficit of the detonation velocity remains unchanged when the pre-detonation pressure increases, while it increases as the pre-detonation temperature increases.
For the two-step kinetic model, the deficit of the detonation velocity is mainly controlled by the heat release behind the sonic point. In this case, the deficit of the detonation velocity increases when the pre-detonation pressure increases or the pre-detonation temperature decreases.
The expansion process in RDEs reduces the speed of the detonation wave by approximately 5%, which is an important factor in the deficit of the detonation velocity in two-dimensional simulations.
Acknowledgements
The present study is sponsored by National Natural Science Foundation of China [grant number 91741202]; State Key Laboratory of Explosion Science and Technology (Beijing Institute of Technology) [grant number KFJJ18-13M] and State Key Laboratory of High Temperature Gas Dynamics, Institute of Mechanics, Chinese Academy of Sciences [LHD2017KF03].
Disclosure statement
No potential conflict of interest was reported by the author(s).
Additional information
Funding
References
- B. Voitsekhovskii, Maintained detonations. Sov. J. Appl. Mech. Tech. Phys. 3 (1960), pp. 157–164.
- F.A. Bykovskii, S.A. Zhdan and E.F. Vedernikov, Continuous spin detonations. J. Propuls. Power 22 (2006), pp. 1204–1216. doi: 10.2514/1.17656
- S.M. Frolov, V.S. Aksenov, V.S. Ivanov and I.O. Shamshin, Large-scale hydrogen–air continuous detonation combustor. Int. J. Hydrog. Energy 40 (2015), pp. 1616–1623. doi: 10.1016/j.ijhydene.2014.11.112
- J. Kindracki, P. Wolański and Z. Gut, Experimental research on the rotating detonation in gaseous fuels–oxygen mixtures. Shock Waves 21 (2011), pp. 75–84. doi: 10.1007/s00193-011-0298-y
- V. Anand, A. St. George, R. Driscoll and E. Gutmark, Analysis of air inlet and fuel plenum behavior in a rotating detonation combustor. Exp. Therm. Fluid Sci. 70 (2016), pp. 408–416. doi: 10.1016/j.expthermflusci.2015.10.007
- B.A. Rankin, D.R. Richardson, A.W. Caswell, A.G. Naples, J.L. Hoke and F.R. Schauer, Chemiluminescence imaging of an optically accessible non-premixed rotating detonation engine. Combust. Flame 176 (2017), pp. 12–22. doi: 10.1016/j.combustflame.2016.09.020
- F. Falempin, B. Le Naour, and F. Miquel, Recent experimental results obtained on continuous detonation wave engine. 17th AIAA International Space Planes and Hypersonic Systems and Technologies Conference (2011), pp. 2011–2235.
- S. Hansmetzger, R. Zitoun, and P. Vidal, Detonation regimes in a small-scale RDE. 26th International Colloquium on the Dynamics of Explosions and Reactive Systems (2017), p. 6.
- Y. Kato, K. Ishihara, K. Matsuoka, J. Kasahara, A. Matsuo and I. Funaki, Study of combustion chamber characteristic length in rotating detonation engine with convergent-divergent nozzle (2016).
- C. Yang, X. Wu, H. Ma, L. Peng and J. Gao, Experimental research on initiation characteristics of a rotating detonation engine. Exp. Therm. Fluid Sci. 71 (2016), pp. 154–163. doi: 10.1016/j.expthermflusci.2015.10.019
- Z. Ma, S. Zhang, M. Luan, S. Yao, Z. Xia and J. Wang, Experimental research on ignition, quenching, reinitiation and the stabilization process in rotating detonation engine. Int. J. Hydrog. Energy 43 (2018), pp. 18521–18529. doi: 10.1016/j.ijhydene.2018.08.064
- M. Liu, S. Zhang, J. Wang and Y. Chen, Parallel three-dimensional numerical simulation of rotating detonation engine on graphics processing units. Comput. Fluids 110 (2015), pp. 36–42. doi: 10.1016/j.compfluid.2014.11.017
- M. Hishida, T. Fujiwara and P. Wolanski, Fundamentals of rotating detonations. Shock Waves 19 (2009), pp. 1–10. doi: 10.1007/s00193-008-0178-2
- D. Schwer and K. Kailasanath, Numerical investigation of the physics of rotating-detonation-engines. Proc. Combust. Inst. 33 (2011), pp. 2195–2202. doi: 10.1016/j.proci.2010.07.050
- Y. Uemura, A.K. Hayashi, M. Asahara, N. Tsuboi and E. Yamada, Transverse wave generation mechanism in rotating detonation. Proc. Combust. Inst. 34 (2013), pp. 1981–1989. doi: 10.1016/j.proci.2012.06.184
- N. Tsuboi, S. Eto, A.K. Hayashi and T. Kojima, Front cellular structure and thrust performance on hydrogen–oxygen rotating detonation engine. J. Propuls. Power 33 (2017), pp. 100–111. doi: 10.2514/1.B36095
- J. Fujii, Y. Kumazawa, A. Matsuo, S. Nakagami, K. Matsuoka and J. Kasahara, Numerical investigation on detonation velocity in rotating detonation engine chamber. Proc. Combust. Inst. 36 (2017), pp. 2665–2672. doi: 10.1016/j.proci.2016.06.155
- R. Zhou and J.-P. Wang, Numerical investigation of flow particle paths and thermodynamic performance of continuously rotating detonation engines. Combust. Flame 159 (2012), pp. 3632–3645. doi: 10.1016/j.combustflame.2012.07.007
- C.A. Nordeen, Thermodynamics of a rotating detonation engine, Doctoral Dissertations, University of Connecticut, 2013.
- M. Bellenoue, B. Boust, P. Vidal, R. Zitoun, T. Gaillard, D. Davidenko, et al., New combustion concepts to enhance the thermodynamic efficiency of propulsion engines. Aerospace Lab 11-12(11) (2016), p. 13.
- R.T. Fievisohn and K.H. Yu, Steady-state analysis of rotating detonation engine flowfields with the method of characteristics. J. Propuls. Power 33 (2017), pp. 89–99. doi: 10.2514/1.B36103
- J. Sousa, J. Braun and G. Paniagua, Development of a fast evaluation tool for rotating detonation combustors. Appl. Math. Model. 52 (2017), pp. 42–52. doi: 10.1016/j.apm.2017.07.019
- T. Fujiwara and S. Tsuge, Quasi-onedimensional analysis of gaseous free detonations. J. Phys. Soc. Jpn. 33 (1972), pp. 237–241. doi: 10.1143/JPSJ.33.237
- S.-I.-C. Tsugé and T. Fujiwara, On the propagation velocity of a detonation-shock combined wave. ZAMM – J. Appl. Math. Mech. Z. Für Angew. Math. Mech. 54 (1974), pp. 157–164. doi: 10.1002/zamm.19740540305
- F. Ma, J.-Y. Choi and V. Yang, Thrust chamber dynamics and propulsive performance of single-tube pulse detonation engines. J. Propuls. Power 21 (2005), pp. 512–526. doi: 10.2514/1.7393
- S. Taki and T. Fujiwara, Numerical analysis of two-dimensional nonsteady detonations. AIAA J. 16 (1978), pp. 73–77. doi: 10.2514/3.60859
- J.D. Anderson, Jr., Hypersonic and high-temperature gas dynamics, 2nd ed., American Institute of Aeronautics and Astronautics, Reston, VA, 2006.