
 ?Mathematical formulae have been encoded as MathML and are displayed in this HTML version using MathJax in order to improve their display. Uncheck the box to turn MathJax off. This feature requires Javascript. Click on a formula to zoom.
Abstract
Geographical concentration of industries tends to be important for firms that depend on innovation and are intensive in the use of specialized technology and labor. In this paper, we investigate the interaction between agglomeration and trade performance in the Norwegian aquaculture industry. We include a variable for regional clustering in a standard gravity model and estimate its impact on different margins of trade. When controlling for destination country, we find that firms that operate in clusters obtain higher export prices and ship more frequently and in smaller bulks. For a highly perishable product like fresh salmon, this may suggest that firms in clusters are served by more efficient supply chains bringing the product to market with timely and efficient logistics.
Introduction
Since Alfred Marshall’s early observations of industrial districts in England (Marshall & Marshall, Citation1920), it has been recognized that positive or agglomeration externalities (synergies) may arise between firms located in the same area (clusters). Such external economies of scale tend to reduce the industry’s unit costs, even in circumstances with no economies of scale at the firm level. Consequently, firms may achieve benefits from being located within a cluster, which serves as a competitive advantage in production and trade. Access to specialized physical and human capital, and thicker markets for complementary firms, as well as knowledge spillovers, are standard explanations used in the literature to explain agglomeration benefits (Porter, Citation1996). Agglomeration is typically important for firms that depend on innovation and are intensive in use of specialized technology and labor (Porter, Citation1996). Békés and Harasztosi (Citation2013) also show that benefits from clustering tend to be larger for firms that operate in international markets. Both these factors are potentially important in salmon aquaculture as it is a knowledge driven and export oriented industry (Asche, Citation2008; Asche & Smith, Citation2018; Kumar & Engle, Citation2016).
While most of the focus has been on productivity growth in the production phase (Asche & Roll, Citation2013; Asche, Roll, & Tveteras, Citation2009; Rocha Aponte & Tveterås, Citation2019; Roll, Citation2013; Tveteras, Citation1999; Vassdal & Holst, Citation2011), the importance of innovation in the supply chain (Asche, Cojocaru, & Roth, Citation2018; Asche, Roll, & Tveteras, Citation2007; Kvaløy & Tveteras, Citation2008; Olson & Criddle, Citation2008) and demand growth have also been recognized (Asche, Dahl, Gordon, Trollvik, & Aandahl, Citation2011; Braekkan, Thyholdt, Asche, & Myrland, Citation2018; Braekkan & Thyholdt, Citation2014).1,2 There are also a few studies that more specifically investigate agglomeration effects at the production level in Norwegian salmon aquaculture. Using different model specifications, Tveteras (Citation2002), Tveteras and Battese (Citation2006), and Asche, Roll, and Tveteras (Citation2016) find evidence of agglomeration, but that this is limited to the salmon industry.
The Norwegian salmon aquaculture industry is a highly export oriented industry. During the period 2004–2014, about 90% of the Norwegian salmon production was exported to more than 70 countries. While there is a global market for salmon (Anderson, Asche, & Garlock, Citation2018; Asche, Bremnes, & Wessells, Citation1999), the size of the individual markets varies significantly, as do preferences for various product attributes (Alfnes, Chen, & Rickertsen, Citation2018; Anderson & Bettencourt, Citation1993; Ankamah-Yeboah, Nielsen, & Nielsen, Citation2016; Asche, Larsen, Smith, Sogn-Grundvåg, & Young, Citation2015; Bronnmann & Asche, Citation2017; Roheim, Sudhakaran, & Durham, Citation2012; Uchida, Onozaka, Morita, & Managi, Citation2014), characteristics of the supply chains (Larsen & Asche, Citation2011; Straume, Citation2017; Xie & Zhang, Citation2014), exchange rates (Straume, Citation2014; Tveteras & Asche, Citation2008; Zhang & Kinnucan, Citation2014) and price shocks (Asche, Misund, & Oglend, Citation2020; Asche, Oglend, & Kleppe, Citation2017; Dahl & Oglend, Citation2014).
In an export oriented sector like Norwegian salmon production, supply chain elements and trade performance can be important. For instance, Asche et al. (Citation2007) note that more efficient logistics contribute to the completeness of the salmon relative to the cod industry. As noted above, salmon is a heterogeneous commodity demanded by customers with different product attribute requirements (e.g. size, quality, freshness, regularity), calling for supply chains that are targeted to various markets. Better access to high-skilled labor could serve to increase the quality and align product attributes to the requirements and valuations in different markets. Innovation and higher labor productivity that typically increase the labor costs would also give incentives to supply higher quality products (Combes, Duranton, & Gobillon, Citation2011). Furthermore, since fresh salmon is a highly perishable product, access to efficient supply chains is crucial. Norwegian fresh salmon is exported worldwide and has to be consumed within a timeframe of 20 days. Firms in clusters could learn from each other, e.g. how to get access to networks and more efficient supply chains (Bisztray, Koren, & Szeidl, Citation2018). Ramos and Moral-Benito (Citation2018) also find that agglomeration is most valuable to firms seeking to penetrate difficult markets, as agglomeration may reduce destination specific fixed costs.
In this paper, the focus is on the potential agglomeration effects in relation to salmon trade, and a gravity type of model is, therefore, used.3 We include a variable for regional clustering into the gravity model and estimate its impact on important margins of trade by decomposing export value into the exporters’ achieved price (unit value), shipment volume, and number of shipments. In accordance with the above discussion, we hypothesize that firms that operate in clusters achieve higher export prices when controlling for destination country (gravity variables). Furthermore, we expect that export prices increase with distance in accordance with the Alchian and Allen (Citation1964) hypothesis that it is relatively cheaper to supply quality in distant markets since unit transportation costs are higher.
The paper is organized as follows. In the next section “The salmon industry”, we provide a brief survey of the Norwegian salmon industry with focus on information relevant to our study. The method and data employed are described in Section “Empirical approach and data”, followed by empirical results in Section “Empirical results”. Main results are summarized in Section “Conclusions”.
The salmon industry
The Norwegian coastline is the second largest in the world, with a total of 102,937 km. The proximity to the Atlantic Ocean, together with a geographical location in the north that ensures a low stable water temperature, makes the Norwegian coast ideal for farming Atlantic salmon. In 2014, there existed about 3,700 pens for aquaculture production in approximately 800 different locations along the Norwegian coastline (Statistics Norway, Citation2019).4 The major part of the production takes place in nine different counties along the coast. shows the aggregate export value for the estimation period 2004–2014. Some background statistics at the county level (sorted by the cluster index value) for the last year in our time series (2014) are provided in . in the appendix provides a map of the geographical locations of the different counties.
Figure 1. Aggregate export value by production counties (2004–2014). Note: Production registered in regions with <1% of export value is deleted. The remaining production make up 99.6% of the export value.
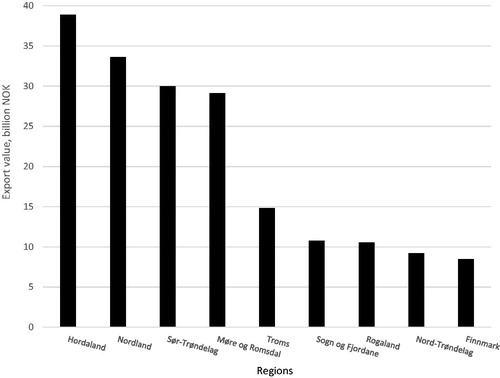
Table 1. Summary statistics (2014).
As illustrated in , the production value varies substantially between the nine regions. This is also the case for the cluster index (first column in ) which is calculated as the number of production licenses in a region divided by the size of the region’s coastline. We can also observe heterogeneity between regions in unit value (third column of ) that measures the exporters’ achieved free on board (FOB) price. A possible explanation, more rigorously examined in Section “Empirical results”, is that exporters sell different grades of quality; e.g. upgrade quality for distant markets or in general achieve a price premium due to superior market knowledge, networks or efficient supply chains.
While the export value per exporter in column 7 measures the size of the exporters, the Herfindahl index in column 6, defined as the squared sum of each exporters’ share of the total export from a region, indicates the degree to which export is dominated by few firms. The correlation between the cluster index and these two measures are positive5, suggesting that firms that export salmon from regions with a high density of locations are larger and possess a higher share of total export from the region. Recent firm-level trade literature shows that export performance typically increases with the size of the firms (Bernard, Jensen, Redding, & Schott, 2007).
Empirical approach and data
Following Mayer and Ottaviano (Citation2007) and Lawless (2010), we decompose export value into the following margins of trade:
(1)
(1)
where X is the total export value, P is the unit value, N is the number of shipments, and Q is average shipment volume, respectively. The number of shipments (N) is in the literature phrased as the extensive margin of trade, while the two latter terms (Q and P) is two distinct elements that together makes up the intensive margin of trade. The export volume is the product of the number of shipments (N) and the average size of each shipment (Q).
The analysis is conducted at the region-destination-year level. The empirical model that we estimate for total export value, and the three margins, is given as
(2)
(2)
Depending on estimation, the variable on the left-hand side (Y) is either the export value (X) or the different margins of trade (N, Q and P) of fresh salmon exported from production region (county) r to destination country m in period t. is the geographical distance between Norway and market m which in standard gravity models enters as a proxy for trade costs.
is the gross domestic product in real US$-prices in destination country m in year t measuring the size of its economy. Geographical distance to the destination market and GDP of the destination market are independent variables that are common in the empirical trade literature both for studies that builds on the traditional gravity framework (Anderson & Van Wincoop, Citation2004), as well as in studies that builds on theories founded at the firm-level (Lawless, Citation2010; Mayer & Ottaviano, Citation2007).
measures the degree of agglomeration in production region r. Norwegian exporters have a dominating market share in most markets with the exception of the USA and the UK. We include separate dummies to control for these two exceptions to the Norwegian dominance. Finally, the two last parts of EquationEquation (2)
(2)
(2) are time fixed effects and a normally distributed error term, respectively.
To estimate the empirical model, data is collected from numerous sources. Data for export value at the region-destination country builds on transaction level data provided by Statistics Norway.6 Data for geographical distance are taken from the CEPII-database,7 while data for GDP are taken from the World Bank Development Indicators8 (WDI). To construct the cluster variable we source data on the number of production licenses at the regional level from The Norwegian Directorate of Fisheries9 while data for the size of each regions coastline is obtained from the Norwegian Mapping Authority.10 in the Appendix provides the main characteristics of the data used to estimate EquationEquation (2)(2)
(2) .
Empirical results
The empirical model is estimated using OLS, and the results are given in . Note that in accordance to EquationEquation (1)(1)
(1) (on logarithmic form), the coefficient for export value is the sum of the coefficients for unit value and export volume, respectively, while the coefficient for export volume is the sum of number of shipments and the average shipment size.
Table 2. Results from estimation of EquationEquation (2)(2)
(2) .
With respect to the gravity variables, the first three columns show that Norwegian fresh salmon exports follow a similar pattern to what is found in most empirical studies. Exported volume declines with distance (indicating trade costs) as expected, but the very strong effect is notable, as the parameter tends to be around 1 for manufacturing products (Anderson & Van Wincoop, Citation2004). However, the result is reasonable given the high degree of perishability of fresh salmon. As predicted by the general literature, the export value increases with the size of the destination economy (indicating the size of the market), and here the magnitude is more in line with the general literature. The exporters’ FOB price (unit value) increases with distance in accordance with the Alchian and Allen (Citation1964) hypothesis that it is relatively cheaper to supply quality in distant markets since unit transportation costs are higher. Recently, Manova and Zhang (Citation2012) used a gravity model to show that Chinese exporters typically upgrade quality and charge higher prices in larger and more distant markets. The importance of the number of shipments relative to shipment size is also highly interesting. Normally, economies of scale in transportation is the most common mean to overcome higher transportation costs associated with distance (Behar & Venables, Citation2010). However, this option is to a much lesser extent available for a perishable product like fresh salmon. The last column in confirms that average shipment volume declines with distance, which implies more frequent shipments per unit exported.
The next variable listed in is the cluster index. Clusters are difficult to measure directly. As mentioned earlier we have calculated clusters indirectly as the number of production licenses in a region divided by the size of the region’s coastline. Since both these variables are exogenous, so is the cluster index. In a specific region the coastline is given, so an increase in the cluster index must be caused by an increase in the number of production licenses to that region. Naturally, an increase in the number of licenses is expected to increase production, and, thereby, the volume of export. Furthermore, it will increase the concentration of production, and this cluster effect is expected to give an extra impetus to export. So is hardly surprising when we from see that the cluster index variable has a regression coefficient above one and proves to be highly significant.11
Our main indicator of trade performance is the exporters’ achieved FOB price (unit value) in a destination. As the second column in shows, the cluster variable has a positive and significant impact on the price exporters achieve in a specific market. There are several reasons for this observation. One explanation may be that firms in regions with high firm density on average benefit from lower transportation costs. However, the potential to supply better quality may also play a role. This is suggested by the disaggregation of export volume into shipment frequency and average shipment size given in columns 4 and 5. We see that firms in cluster regions on average ship more frequently and in smaller bulks. For a highly perishable product like fresh salmon, this may suggest that firms in clusters enter into more efficient supply chains that serve markets timelier, ensuring a fresher product.
Looking at the overall picture in , the results for the unit price is striking. For this equation the degree of explanation, measured by R2, is by far the highest. We have demonstrated that price increases with distance and clusters, reflecting a quality aspect. However, the contribution of the constant term is by far highest. Therefore, there is a strong tendency toward prices to be constant. The strong distance effect means that this constant-price-tendency is mainly true within national markets. For more distant markets, prices are higher. Also, exporters from regions with high density sell to a relatively higher price.
Conclusions
As a knowledge intensive and export oriented industry, salmon producers have the potential to benefit from agglomeration externalities. The existence of industry clusters in Norwegian aquaculture has indeed been demonstrated in production (Asche, Roll, & Tveteras, Citation2016; Tveteras, Citation2002; Tveteras & Battese, Citation2006). However, while there has been significant focus on how the control with the production process in aquaculture also facilitates efficient supply chains, there have been no attempts to investigate for agglomeration effects downstream from the producer. This is surprising as transportation, logistics and marketing are activities that often are associated with economies of scale as well as network externalities.
In this paper, a cluster index variable is introduced in a gravity model as well as various trade margins estimated on Norwegian firm exports data to test for agglomeration effects in exports. The results give clear evidence of agglomeration effects also in exports. The various margins provide more nuanced information about these effects. In particular, firms that operate in clusters obtain higher export prices and ships more frequently and in smaller bulks. For a highly perishable product like fresh salmon, this may suggest that firms in clusters is served by more efficient supply chains bringing the product to market with timely and efficient logistics. Our results suggest that agglomeration economies should be taken into consideration when the authorities allocate production permits. A challenge for the authorities is then to design regulations that balance benefits from agglomeration against the potentially conflicting objectives related to rural distribution and environmental concerns.
Notes
Additional information
Funding
Notes
1 There is also a number of studies investigating price transmission in salmon supply chains, with Landazuri-Tveteraas, Asche, Gordon, andTveteraas (Citation2018) as the most recent example.
2 There is less focus on how new technologies actually are adopted, but Kumar, Engle, and Tucker (Citation2018) provide a review.
3 There are numerous papers utilizing the gravity framework when studying trade in seafood products, see e.g. Natale, Borrello, and Motova (Citation2015) and Asche, Gaasland, Straume, and Vårdal (Citation2019).
4 A small number of the pens were used for farming trout, but the main species is Atlantic salmon.
5 The correlation coefficient between the cluster index value and the export value per exporter is 0.67, while it is 0.52 between the cluster index value and the Herfindahl index.
6 See e.g. Asche, Gaasland, et al. (Citation2019b) and Oglend and Straume (Citation2019) for a detailed description of transaction level data for Norwegian salmon export.
7 The CEPII-database is found at http://www.cepii.fr/cepii/en/bdd_modele/bdd.asp.
8 The WDI-database is found at http://data.worldbank.org/data-catalog/world-development-indicators.
11 From , we see that the measured cluster effect on export volume is 1.159. If licenses are fully utilized, there will be a one-to-one relationship between licenses and production, and the measured effect will then be 1. The additional 0.159 can then be attributed to the second mentioned effect.
References
- Alchian, A. A., & Allen, W. R. (1964). University economics. Belmont, CA: Wadsworth.
- Alfnes, F., Chen, X., & Rickertsen, K. (2018). Labeling farmed seafood: A review. Aquaculture Economics and Management, 22(1), 1–26. doi:10.1080/13657305.2017.1356398
- Anderson, J. E., & Van Wincoop, E. (2004). Trade costs. Journal of Economic Literature, 42(3), 691–751. doi:10.1257/0022051042177649
- Anderson, J. L., Asche, F., & Garlock, T. (2018). Globalization and commoditization: The transformation of the seafood market. Journal of Commodity Markets, 12, 2–8. doi:10.1016/j.jcomm.2017.12.004
- Anderson, J. L., & Bettencourt, S. (1993). A conjoint approach to model product preference: The New England market for fresh and frozen salmon. Marine Resource Economics, 8(1), 31–47. doi:10.1086/mre.8.1.42629045
- Ankamah-Yeboah, I., Nielsen, M., & Nielsen, R. (2016). Price premium of organic salmon in Danish retail sale. Ecological Economics, 122, 54–60. doi:10.1016/j.ecolecon.2015.11.028
- Asche, F. (2008). Farming the sea. Marine Resource Economics, 23(4), 527–547. doi:10.1086/mre.23.4.42629678
- Asche, F., Bremnes, H., & Wessells, C. R. (1999). Technical inefficiency, cost frontiers and learning-by-doing in Norwegian farming of juvenile salmonids. American Journal of Agricultural Economics, 81(3), 568–581.
- Asche, F., Cojocaru, A., & Roth, B. (2018). The development of large scale aquaculture production: A comparison of the supply chains for chicken and salmon. Aquaculture, 493, 446–455. doi:10.1016/j.aquaculture.2016.10.031
- Asche, F., Dahl, R. E., Gordon, D. V., Trollvik, T., & Aandahl, P. (2011). Demand growth for salmon in the European market. Marine Resource Economics, 26(4), 255–265. doi:10.5950/0738-1360-26.4.255
- Asche, F., Gaasland, I., Straume, H. M., & Vårdal, E. (2020). Norwegian export of farmed salmon − Trade costs and market concentration. Applied Economics Letters, Forthcoming. doi:10.1080/13504851.2019.1610702
- Asche, F., Larsen, T. A., Smith, M. D., Sogn-Grundvåg, G., & Young, J. A. (2015). Pricing of ecolabels with retailer heterogeneity. Food Policy, 53, 82–93. doi:10.1016/j.foodpol.2015.04.004
- Asche, F., Misund, B., & Oglend, A. (2019). The case and cause of salmon price volatility. Marine Resource Economics, 34(1), 23–38. doi:10.1086/701195
- Asche, F., Oglend, A., & Kleppe, T. (2017). Price dynamics in biological production processes exposed to environmental shocks. American Journal of Agricultural Economics, 99(5), 1246–1264. doi:10.1093/ajae/aax048
- Asche, F., & Roll, K. H. (2013). Determinants of inefficiency in Norwegian salmon aquaculture. Aquaculture Economics and Management, 17(3), 300–321. doi:10.1080/13657305.2013.812154
- Asche, F., Roll, K. H., & Tveteras, R. (2007). Productivity growth in the supply chain—another source of competitiveness for aquaculture. Marine Resource Economics, 22(3), 329–334. doi:10.1086/mre.22.3.42629562
- Asche, F., Roll, K. H., & Tveteras, R. (2009). Economic inefficiency and environmental impact: An application to aquaculture production. Journal of Environmental Economics and Management, 58(1), 93–105. doi:10.1016/j.jeem.2008.10.003
- Asche, F., Roll, K. H., & Tveteras, R. (2016). Profiting from agglomeration? Evidence from the salmon aquaculture industry. Regional Studies, 50(10), 1742–1754. doi:10.1080/00343404.2015.1055460
- Asche, F., & Smith, M. D. (2018). Induced innovation in fisheries and aquaculture. Food Policy, 76, 1–7. doi:10.1016/j.foodpol.2018.02.002
- Behar, A., & Venables, A. J. (2010). Transport costs and international trade. In A. Palma, R. Lindsey, E. Quinet, & R. Vickerman (Eds.), Handbook of transport economics (pp. 97–115). Cheltenham: Edward Elgar.
- Békés, G., & Harasztosi, P. (2013). Agglomeration premium and trading activity of firms. Regional Science and Urban Economics, 43(1), 51–64. doi:10.1016/j.regsciurbeco.2012.11.004
- Bernard, A. B., Jensen, J. B., Redding, S. J., & Schott, P. K. (2007). Firms in international trade. Journal of Economic Perspectives, 21(3), 105–130. doi:10.1257/jep.21.3.105
- Bisztray, M., Koren, M., & Szeidl, A. (2018). Learning to import from your peers. Journal of International Economics, 115, 242–258. doi:10.1016/j.jinteco.2018.09.010
- Bronnmann, J., & Asche, F. (2017). Sustainable seafood from aquaculture and wild fisheries: Insights from a discrete choice experiment in Germany. Ecological Economics, 142, 113–119. doi:10.1016/j.ecolecon.2017.06.005
- Braekkan, E. H., & Thyholdt, S. B. (2014). The bumpy road of demand growth—an application to Atlantic salmon. Marine Resource Economics, 29(4), 339–350. doi:10.1086/678927
- Braekkan, E. H., Thyholdt, S. B., Asche, F., & Myrland, Ø. (2018). The demands they are a-changin. European Review of Agricultural Economics, 45(4), 531–552. doi:10.1093/erae/jby003
- Combes, P. P., Duranton, G., & Gobillon, L. (2011). The identification of agglomeration economies. Journal of Economic Geography, 11(2), 253–266. doi:10.1093/jeg/lbq038
- Dahl, R. E., & Oglend, A. (2014). Fish price volatility. Marine Resource Economics, 29(4), 305–322. doi:10.1086/678925
- Kumar, G., & Engle, C. R. (2016). Technological advances that led to growth of shrimp, salmon, and tilapia farming. Reviews in Fisheries Science and Aquaculture, 24(2), 136–152. doi:10.1080/23308249.2015.1112357
- Kumar, G., Engle, C. R., & Tucker, C. S. (2018). Factors driving aquaculture technology adoption. Journal of the World Aquaculture Society, 49(3), 447–476. doi:10.1111/jwas.12514
- Kvaløy, O., & Tveteras, R. (2008). Cost structure and vertical integration between farming and processing. Journal of Agricultural Economics, 59(2), 296–311. doi:10.1111/j.1477-9552.2007.00149.x
- Landazuri-Tveteraas, U., Asche, F., Gordon, D. V., & Tveteraas, S. (2018). Price transmission in French and UK salmon markets. Aquaculture Economics and Management, 22(1), 131–149. doi:10.1080/13657305.2017.1284943
- Larsen, T. A., & Asche, F. (2011). Contracts in the salmon aquaculture industry: An analysis of Norwegian salmon exports. Marine Resource Economics, 26(2), 141–150. doi:10.5950/0738-1360-26.2.141
- Lawless, M. (2010). Deconstructing gravity: Trade costs and extensive and intensive margins. Canadian Journal of Economics/Revue Canadienne D'économique, 43(4), 1149–1172. doi:10.1111/j.1540-5982.2010.01609.x
- Marshall, A., & Marshall, M. P. (1920). The economics of industry. London: Macmillan and Company.
- Manova, K., & Zhang, Z. (2012). Export prices across firms and destinations. The Quarterly Journal of Economics, 127(1), 379–436. doi:10.1093/qje/qjr051
- Mayer, T., & Ottaviano, G. I. (2007). The happy few: The internationalisation of European firms. New facts based on firm-level evidence. Intereconomics, 43(3), 135–148.
- Natale, F., Borrello, A., & Motova, A. (2015). Analysis of the determinants of international seafood trade using a gravity model. Marine Policy, 60, 98–106. doi:10.1016/j.marpol.2015.05.016
- Oglend, A., & Straume, H. M. (2019). Pricing efficiency across destination markets for Norwegian salmon exports. Aquaculture Economics and Management, 23(2), 188–203. doi:10.1080/13657305.2018.1554722
- Olson, T. K., & Criddle, K. R. (2008). Industrial evolution: A case study of Chilean salmon aquaculture. Aquaculture Economics and Management, 12(2), 89–106. doi:10.1080/13657300802110687
- Porter, M. E. (1996). Competitive advantage, agglomeration economies, and regional policy. International Regional Science Review, 19(1–2), 85–90. doi:10.1177/016001769601900208
- Ramos, R., & Moral-Benito, E. (2018). Agglomeration by export destination: Evidence from Spain. Journal of Economic Geography, 18(3), 599–625. doi:10.1093/jeg/lbx038
- Rocha Aponte, F., & Tveterås, S. (2019). On the drivers of cost changes in the Norwegian salmon aquaculture sector: A decomposition of a flexible cost function from 2001 to 2014. Aquaculture Economics & Management, 23(3): 276–291.
- Roheim, C. A., Sudhakaran, P. O., & Durham, C. A. (2012). Certification of shrimp and salmon for best aquaculture practices: Assessing consumer preferences in Rhode Island. Aquaculture Economics and Management, 16(3), 266–286. doi:10.1080/13657305.2012.713075
- Roll, K. H. (2013). Measuring performance, development and growth when restricting flexibility. Journal of Productivity Analysis, 39(1), 15–25. doi:10.1007/s11123-012-0265-3
- Statistics Norway. (2019). https://www.ssb.no/en/fiskeoppdrett. (Accessed June).
- Straume, H. M. (2014). Currency invoicing in Norwegian salmon export. Marine Resource Economics, 29(4), 391–409. doi:10.1086/678930
- Straume, H. M. (2017). Here today, gone tomorrow: The duration of Norwegian salmon exports. Aquaculture Economics and anagement, 21(1), 88–104. doi:10.1080/13657305.2017.1262477
- Tveteras, R. (1999). Production risk and productivity growth: Some findings for Norwegian salmon aquaculture. Journal of Productivity Analysis, 12, 161–179.
- Tveteras, R. (2002). Industrial agglomeration and production costs in Norwegian salmon aquaculture. Marine Resource Economics, 17(1), 1–22. doi:10.1086/mre.17.1.42629345
- Tveteras, R., & Battese, G. E. (2006). Agglomeration externalities, productivity and technical inefficiency. Journal of Regional Science, 46(4), 605–625. doi:10.1111/j.1467-9787.2006.00470.x
- Tveteras, S., & Asche, F. (2008). International fish trade and exchange rates: An application to the trade with salmon and fishmeal. Applied Economics, 40, 1745–1755. doi:10.1080/00036840600905134
- Uchida, H., Onozaka, Y., Morita, T., & Managi, S. (2014). Demand for ecolabeled seafood in the Japanese market: A conjoint analysis of the impact of information and interaction with other labels. Food Policy, 44, 68–76. doi:10.1016/j.foodpol.2013.10.002
- Vassdal, T., & Holst, K. (2011). Technical progress and regress in Norwegian salmon farming: A Malmquist Index approach. Marine Resource Economics, 26(4), 329–341. doi:10.5950/0738-1360-26.4.329
- Xie, J., & Zhang, D. (2014). Imperfect competition and structural changes in the US salmon import market. Marine Resource Economics, 29(4), 375–389. doi:10.1086/678929
- Zhang, D., & Kinnucan, H. W. (2014). Exchange rate volatility and U.S. import demand for salmon. Marine Resource Economics, 29 (4), 411–430. doi:10.1086/678931
Appendix
Figure A1. Regions within Norway.
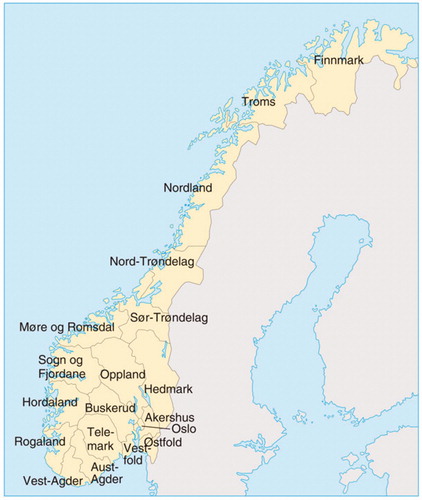
Table A1. Main characteristics of the data set.