
Abstract
Concern within the U.S. aquaculture industry and a developing research literature on aquaculture regulations have prompted attempts to quantify on-farm regulatory compliance costs. A survey was conducted of the Pacific coast shellfish industry (Washington, Oregon, and California) to assess the on-farm economic effects of regulations. The response rate for this study was 27%, but captured 74% of the value of Pacific coast shellfish production. The total annual regulatory burden for the Pacific coast, excluding non-cash opportunity costs, was estimated at $15.6 million (increased farm costs due to regulation), with an additional $110 million in annual lost sales revenue (markets lost due to regulatory action or trade barriers) and $169.9 million in additional lost opportunities (due to regulatory barriers to expansion or diversification); average annual costs were estimated to be $240,621 per farm and $68,936 per hectare. Analysis by farm size demonstrated greater regulatory cost burdens per ha on smaller-scale producers. Study results show that the Pacific coast shellfish industry has experienced extensive delays in permitting resulting in substantial lost opportunities, as well as high regulatory costs that have prevented the entry of new businesses; both contributing to the exit of existing farms, and otherwise prevented the industry from responding to growing demand for U.S. shellfish aquaculture products.
Introduction
Research on the economic effects of the regulatory compliance burden on aquaculture farms is a newly developing and growing area of aquaculture research. In the U.S., scientific literature on regulatory barriers to aquaculture dates back to 1994 (Thunberg et al., Citation1994) with trade magazine articles that highlight regulatory obstacles dating back to the 1970s (see, e.g., Anonymous, Citation1979; Gibson, Citation1979). The concerns identified by both industry and researchers are related to compliance measures that are reported to duplicate requirements of other agencies with overlapping authorities, and inefficiencies introduced often as a result of command-and-control approaches used (Abate et al., Citation2016; Engle, Citation2016; Engle & Stone, Citation2013; Engle & Wossink, Citation2008; Hale et al., Citation2015; Kite-Powell et al., Citation2013; Knapp & Rubino, Citation2016; Osmundsen et al., Citation2017; van Senten & Engle, Citation2017).
The question underlying recent studies is not whether laws and regulations should exist for aquaculture, but to seek to identify more efficient and less costly alternatives to achieving the objectives intended by the laws enacted. Farmers, economists, and many in the general public recognize the necessity and benefits of laws and regulations that internalize various externalities to achieve societal goals related to the environment, public health, and an orderly society. Regulatory enforcement of laws in the developed world have without doubt improved environmental quality, contributed to greater control over disease transmission, and enhanced society in many ways. There is a substantial literature that documents the widespread benefits to society, to individuals, and to businesses from a robust regulatory regime (Office of Management and Budget-Office of Information and Regulatory Affairs, Citation2017). Clearly there are costs to businesses and taxpayers to sustain activities of agencies charged with implementing the laws passed by elected officials.
The question that is increasingly being asked by aquaculture producers and those who work with aquaculture farms, is not whether aquaculture should be regulated, but whether there are more cost-efficient and less burdensome ways to provide equivalent levels of oversight and achieve the same societal goals. In response to this question, researchers in the U.S. and in the European Union have begun to dig deeper into the costs and economic effects of the total set of regulatory compliance activities as implemented on aquaculture farms. For example, Osmundsen et al. (Citation2017) pointed to lack of training in aquaculture for farm-level inspectors, permit writers, and other regulatory actors who do not have a mechanism to remain current with aquaculture farm practices, given the rapidly developing new technologies being adopted by aquaculture producers. Rivalry among regulatory agencies and personal ideologies of inspectors were discussed by Abate et al. (Citation2018) in the context of overly burdensome regulations on aquaculture in the EU. Perhaps more problematic is the discussion by Osmundsen et al. (Citation2017) of EU regulations that restricted adoption of improved technologies on aquaculture farms and called for a more adaptive and flexible approach to regulation of aquaculture to avoid such unintended negative consequences.
Countries with more stringent regulatory environments have been found to exhibit lower growth rates of their aquaculture industry (Abate et al., Citation2016). The “wicked problems” affecting aquaculture were identified as static and prescriptive regulations that interfered with the flexibility of businesses to adjust to rapid changes and advances in aquaculture (Osmundsen et al., Citation2017). There is now a growing body of literature addressing the effects of regulatory environments in developed countries (Engle, Citation2016; Engle & Stone, Citation2013; Kite-Powell et al., Citation2013; Knapp & Rubino, Citation2016; Thunberg et al., Citation1994).
While little attempt has been made in general to collect data on regulatory compliance costs on the facility, or farm, level, such data are especially important for industries with heterogeneous scales of production (National Center for Environmental Economics, Citation2014), including aquaculture. In research on the regulatory costs on California agricultural producers, Hurley and Noel (Citation2006) called for greater study on the cumulative effects of the compliance burden from the total suite of regulations and not just a rule-by-rule approach.
In more recent years, several studies have focused on the farm-level regulatory compliance burden of the total set of regulations with which specific segments of U.S. aquaculture have to comply. For example, van Senten & Engle, Citation2017 found annual average on-farm regulatory compliance costs on U.S. baitfish/sportfish farms to be $148,554 per farm, or $7,383 per hectare. Engle et al. (Citation2019), in a similar study of U.S. salmonid (trout and salmon) farms, found the annual average on-farm regulatory compliance costs to be $165,187 per farm and $2.71/kg of salmonid production. Both studies showed disproportionately greater annual regulatory costs on smaller-scale as compared to larger-scale farms. Additional analysis of these data demonstrated that regulatory cost variables had a negative effect on technical efficiency of farms, likely related to inefficiencies associated with manpower diverted from farm and marketing innovations to record-keeping and reporting activities for regulatory compliance (van Senten et al., Citation2018). Environmental management and interstate fish health requirements contributed the most to the overall regulatory cost burden on finfish farms. The total national cost of regulations was $12.1 million for U.S. baitfish/sportfish and $28.3 million for U.S. salmonid farms. Additional work demonstrated the potential for streamlined regulations to substantially reduce the on-farm regulatory burden (van Senten et al., Citation2018).
Shellfish aquaculture is a rapidly growing and developing sector of the global aquaculture industry. It is estimated that global production of mollusks reached 17.1 million tons with an estimated value of $29.2 billion in 2016 (FAO, Citation2018). The United States was ranked as the 8th largest producer of mollusks in 2016, with an estimated production volume of 173,700 metric tons (FAO, Citation2018). While the Pacific coast states of Washington, Oregon, and California represent only 22% of the total number of U.S. farms in the 2012 Census of Aquaculture (United States Department of Agriculture [USDA], Citation2014); these three states accounted for 54% of the value of U.S shellfish. The major production species include a variety of clams, mussels, and oysters; with oysters accounting for the largest production value (USDA, Citation2014). Shellfish aquaculture on the Pacific coast of the U.S. includes the production of Pacific oysters (Crassostrea gigas), Kumamoto oysters (Crassostrea sikamea), eastern oysters (Crassostrea virginica), Olympia oysters (Ostrea lurida), Geoduck clams (Panopea generosa), Manila clams (Venerupis philippinarum), Blue mussels (Mytilus edulis), Mediterranean mussels (Mytilus galloprovincialis), abalone (Haliotis spp.), and several other minor species. These species are most commonly cultured in intertidal environments, using a variety of techniques; ranging from extensive practices to highly intensive management strategies with specialized equipment and structures. The primary end use of shellfish aquaculture products is for human consumption; cooked in a variety of ways, or consumed raw. Some research suggest that shellfish aquaculture may have little to no harmful effects on natural environments (Shumway et al., Citation2003) and generates ecosystem benefits (Shumway, Citation2011; van der Schatte Olivier et al., Citation2020).
Pacific coast shellfish aquaculture not only represents an important source of food for humans, but also is an important contributor to state and local economies. It was estimated that the commercial shellfish aquaculture industry directly and indirectly supports over 2,700 jobs in Washington State (Northern Economics, Citation2013). Every dollar spent by shellfish producers was estimated to generate 1.8 times the activity within the economy of Washington and 1.9 in California. Additional studies have also captured the economic benefits of shellfish aquaculture to other local and state economies (Hudson, Citation2017; Kroeger, Citation2012; Philippakos et al., Citation2001; van Senten et al., Citation2020).
Despite the economic and environmental benefits of shellfish aquaculture, literature on shellfish aquaculture in the U.S. also acknowledges that the industry faces regulatory constraints (O’Connell, Citation2018) and a challenging permitting environment (Evrard, Citation2017). Given the substantial differences in regulations for coastal and marine areas, measuring the on-farm regulatory cost burden on shellfish farms would make an important contribution to the growing understanding of how the U.S. regulatory system affects the economics of aquaculture businesses. An example of the increased complexity of shellfish permitting is the flowchart of existing permitting processes for shellfish producers in Washington State, that includes 93 different steps and determinations in the permitting process (available at https://ecology.wa.gov/DOE/files/a4/a46df082-8140-4f75-979e-543cacaefa30.pdf).
H. James Harrington is quoted as having said “Measurement is the first step that leads to control and eventually improvement” (Harrington & McNellis, Citation2006); and measurement of the on-farm regulatory cost burden is the overall goal of this study. It should be noted that this study is not questioning the need for regulation of the aquaculture industry, but rather seeks to improve our understanding of the farm-level economic effects of a complex and stringent regulatory environment on a specific marine/coastal sector of U.S. aquaculture. Thus, the key question addressed in this study is not “Should aquaculture be regulated?” but rather “What is the current regulatory cost and total economic compliance burden on Pacific Coast shellfish farms?” Understanding which types of farm-level regulatory compliance required by inspectors result in greater costs will point toward new hypotheses addressing potential alternative approaches that reduce the on-farm compliance burden while maintaining equivalent regulatory rigor and oversight. This study presents results of a first step to address the question of the magnitude of the regulatory cost burden on Pacific Coast shellfish farms from the total suite of regulatory compliance requirements on their farms by systematically collecting and analyzing detailed farm-level costs and revenue effects. The specific objectives of this study are to (1) measure the costs of regulations on Pacific coast shellfish producers; (2) identify the regulatory categories and activities that are most costly to Pacific coast shellfish producers; and (3) compare the relative cost burden of regulatory categories and compliance activities on farms across study states and across different farm sizes.
Methods
Survey methods and questionnaire development
A survey was conducted of the shellfish aquaculture industry in the three Pacific coast states of Washington, Oregon, and California. Contact lists of known shellfish producers were obtained through the assistance of state Cooperative Extension Specialists, industry associations, lists of permit holders, and discussions with producers.
The survey covered a variety of topics related to shellfish farming, including descriptive farm information such as farm size, species of shellfish produced, production methods employed, and the total volume of production. Questions from a previous study on the regulatory costs affecting the baitfish/sportfish industry (van Senten & Engle, Citation2017) were adapted to the shellfish industry where suitable, to inquire about the on-farm regulatory challenges faced by shellfish producers. Experience from the baitfish/sportfish study indicated that most responses would likely be obtained through personal on-farm interviews with producers. As such, the survey was designed in a manner that would facilitate a conversation about on-farm regulatory costs, production costs, marketing costs, and other on-farm activities. The survey instrument transitioned from more generic and broad questions, used to introduce a topic, into more detailed questions about specific regulatory challenges and/or costs related to that topic. For example, after asking respondents to identify the regulatory challenges faced by their business, the survey asked for detailed information on all current licenses, permits, and regulations with which they had to comply.
The survey instrument contained two distinct sections focused on regulatory costs, based on preliminary discussions with stakeholders and a review of gray literature that revealed that some of the key challenges were related to delays in obtaining permits and licenses to raise shellfish. The first section focused on costs associated with obtaining permits and licenses, while the second section focused on the costs of ongoing monitoring and compliance activities. In both sections, respondents were asked to account for any changes in management required, time spent by employees on regulatory compliance; and professional and contractual services related to regulations, mandated changes in equipment or infrastructure, delays in operations, lost sales, sunk costs, and lost opportunities. A third and final section of the survey asked respondents about their production costs, marketing costs, and farm revenue. The survey instrument was pre-tested in all three Pacific coast states with both larger-scale and smaller-scale farms. Following the pre-testing, some minor adjustments were made to improve the flow of questions. defines the terms used to describe the economic effects that resulted from regulations and compliance activities. The two primary effects identified by this study were increased farm costs (termed “regulatory costs” throughout) and effects on farm sales revenue that consisted of the value of lost sales and the value of lost opportunities. Values are reported as annual values throughout.
Table 1. Definitions.
Prior to the implementation of the survey, stakeholders and state Extension Specialists were consulted to develop a plan to notify producers and ask for their participation. This plan included the development of written notices and letters introducing the survey, the project team members, the objectives of the study, procedures to maintain confidentiality of the data, and the importance of the study. These notices and letters were distributed via e-mail, print, and websites with the support of stakeholders and aquaculture industry associations. A member of the project team was also invited to speak at regional, state and/or industry association meetings to announce the survey and to explain the objectives of the study to gain producer support. Contact lists were then refined, and producer status was verified through telephone contact, or in-person visits when possible. This was accomplished with assistance from the Pacific Shellfish Institute, which has an established presence in the region and relationships with local producers. All wholesalers, dealers, or other entities not directly producing shellfish were removed from the contact lists. Multiple attempts were made to establish telephone and e-mail contact with all entities listed on the contact lists. Despite these efforts, contact was never established with 100 entities on the contact list, which were therefore not removed from the list.
The majority of survey responses were obtained through in-person interviews. Appointments with producers were scheduled by telephone in advance, and project investigators traveled to each state to meet with producers. Five survey/interviews with producers were also completed over the telephone. The duration of each interview was highly variable and was dependent on many factors, such as the size and scale of the operation, the availability of records, and producer availability. In four cases, multiple contacts had to be made to complete the entirety of the survey.
Data analysis and cost calculations
To protect producer confidentiality and the privacy of individual business data, each completed survey was given a pre-determined code, which allowed for identification of the state in which the producer was located. Survey responses were entered into a Microsoft Office 365 Excel® workbook as individual observations. Both data observations and formulas were checked multiple times for accuracy.
Values were converted to uniform units and quantities to ensure correct tabulation of results. Tabulation of results for each observation included the summation of (1) total on-farm production costs, (2) total marketing costs, (3) total farm revenue, (4) costs related to obtaining permits and licenses, (5) costs of ongoing regulatory compliance and monitoring activities, and (6) summation of lost sales and lost opportunities. In addition, the data in each observation was sorted into regulatory costs by category including costs of permits/licenses, direct costs other than permits, manpower, and costs of changes due to regulations. Data were also sorted into six regulatory categories: aquaculture permit that included aquatic farm registrations and shellfish operator’s licenses, interstate transport, environmental management, aquatic animal health, legal and labor standards, and food safety, as identified by Engle and Stone (Citation2013). From these tabulations and summaries, regulatory costs and the values of lost sales and lost opportunities per farm, per state, and per ha were calculated. Per-ha costs were calculated using the number of hectares in actual cultivation reported by farms. Total regulatory costs, total lost sales, and total lost opportunities for the Pacific coast region were estimated by adjusting the total captured responses by the survey coverage rate. The coverage rate was estimated using the available data from the U.S. Census of Aquaculture (USDA, Citation2014). Descriptive statistics reported include the mean and median of cost values for the Pacific coast region, and for each of the three study states (Washington, Oregon, and California). None of the participating states had fewer than four completed surveys (); therefore, there was no need to redact any state summary from the results. However, tabulations summarized by farm size did require some redaction to preserve confidentiality, and as such, data by farm size has been included on a regional basis only.
Table 2. List frame development, Pacific coast shellfish survey, 2017.
Regulatory costs by farm size
Observations were sorted and tabulated into four farm size groups: large (≥200 hectares), medium (<200 hectares but ≥40 hectares), small (<40 hectares but ≥4 hectares), and x-small (<4 hectares), to assess the effects of scale on regulatory costs.
Results
Coverage and response rate
Of the initial 270 entities on the final contact lists, 11 were no longer in business, and 84 were found not to be shellfish producers (). The remaining 175 entities were identified as producers, or retained on the list due to an inability to verify producer status.
The response rate by the number of farms for this study was 27% (), which was greater than the 13% response rate reported for a previous Pacific coast shellfish producer survey (Northern Economics, Citation2013) and similar to the 28% response rate in a survey of mostly shellfish producers from the Northeast Regional Aquaculture Center (Fairchild et al., Citation2017). Our response rate by the number of farms may be under-estimated because 100 entities on the contact list did not respond to any attempts to verify producer status, or to participate in the survey. Confirmation of non-producer status, or no longer being in business, was required before any entity was removed from the contact list. As such, it is possible that amongst the 100 non-respondents there were still some entities that did not belong on the contact list. Individual state response rates by number of farms were 50% for California, 36% for Oregon, and 22% for Washington (). A challenge presented by the Washington list of license holders was that it included harvesters of wild shellfish fisheries, a similar challenge experienced by the Northern Economics (Citation2013) study. The coverage rate of responses, the percent of total sales captured by the survey, was estimated at 74% for the Pacific coast region. This is similar to the 76% coverage rate obtained by Northern Economics for the economic impact study on Pacific coast shellfish (Citation2013). Thus, the data reflect conditions of nearly three-fourths of the shellfish production on the Pacific coast.
Table 3. Coverage and response rates, Pacific coast shellfish survey, 2017.
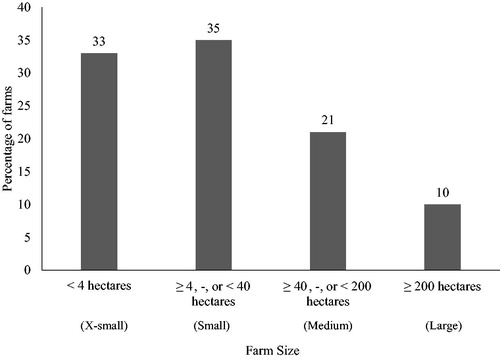
The categories with the largest number of observations were the “x-small” and “small” categories, accounting for 33% and 35% of observations, respectively (). The “medium” and “large” categories accounted for 21% and 10% of the observations, respectively.
Figure 1. Percentage of Pacific coast shellfish farm 2017 survey respondents by farm size.
Major challenges for pacific coast shellfish growers
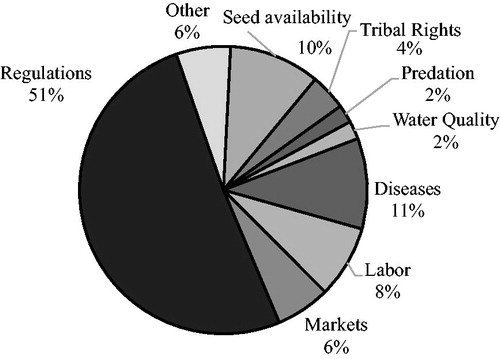
Fifty-one percent of respondents indicated that regulations were the primary challenge to their business (). This was followed by the categories of “diseases” (11%), seed availability (10%), labor (8%) and markets (6%). The survey instrument also allowed respondents to write in other challenges as the primary or secondary challenge to the business; responses included challenges with tribal rights, burrowing shrimp, weather, predation, water quality, and ocean acidification.
Figure 2. Primary challenges to Pacific coast shellfish farms among 2017 survey respondents.
Most problematic regulatory challenges
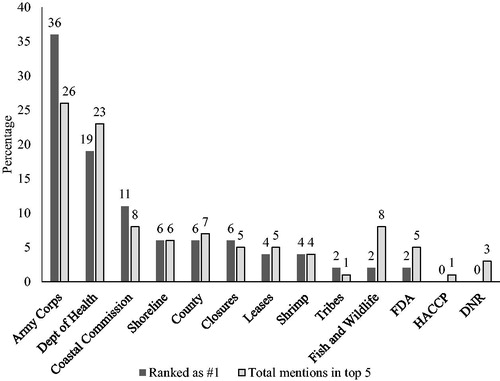
In our quest to obtain more detail on regulatory challenges specifically, respondents were asked to identify and rank the greatest regulatory challenges to their business. depicts the ranking for the regulatory challenges reported by respondents. The most frequently mentioned specific regulatory challenges were related to the Nationwide and Individual permits issued by the U.S. Army Corps of Engineers (26%), followed by regulations related to the respective state Departments of Health (22%), and the respective state Departments of Fish and Wildlife (8%) (data not shown). Other specific regulatory challenges included shoreline permitting, county permits, harvest site closures, leases, and the Coastal Commission, although this was only relevant to respondents in California.
Figure 3. Ranking of regulations reported by Pacific coast shellfish 2017 survey respondents as causing the greatest problems for their shellfish business, Pacific coast shellfish survey respondents, 2017.
Notifications of renewals and changes
To better understand the efforts made by respondents to remain compliant with regulations, producers were asked how often they received reminders about permit renewals and how often they received advanced notices of changes in regulation. Forty-eight percent of the survey respondents reported always receiving reminders of permit renewals (data not shown). This was followed by 29% of respondents who indicated receiving reminders of permit renewals between 75% and 99% of the time. Only 7% of respondents indicated that they have never received a reminder of a permit renewal. With regards to advanced notification of changes in regulations so producers could remain compliant, 35% of respondents indicated that they always received advanced notification of changes (data not shown). This was followed by 27% of respondents who reported receiving advanced notice of changes in regulations between 75% and 99% of the time. Fourteen percent of respondents indicated that they never received advanced notification of changes in regulation.
Farms out of business, unexpected changes, lost sales and lost opportunities
Survey participants were asked if they knew of other shellfish producers who had gone out of business due to regulations. By the number of respondents, 56% indicated that “yes” they knew of other farms that had gone out of business due to regulations (). This was followed by 31% of respondents who gave no response to this question, and 13% who indicated that they did not know any other farms that had gone out of business specifically due to regulations. Tabulating specific farms that were mentioned, and excluding those that were mentioned more than once, 39 farms were reported to have gone out of business due to regulatory and compliance challenges. Responses to this question represent secondhand information that was not used in the cost analysis. Those farms that had gone out of business were not contacted, and their regulatory costs were not included in the analysis because the survey targeted only those farms in production at the time of the survey. Nevertheless, these reports by more than half the survey respondents indicate that there was a perception that regulatory action was the cause of the exit of some other shellfish farms. Such perceptions can have a chilling effect on decisions related to future investment and continuation in shellfish farming.
Table 4. Lost markets, lack of business expansion, unexpected changes, farms that have gone out of business due to regulations, Pacific coast shellfish survey respondents, 2017 (N = 48).
With regards to changes in regulation that resulted in unexpected changes at the farm level, be it for management, infrastructure, or equipment, 50% of respondents reported experiencing unexpected changes in their business (). An example of an unexpected change reported by respondents was requiring maps of the farm site with little advance notice and on a short deadline during the permitting process for individual permits. Twenty-seven percent of respondents reported experiencing no unexpected changes due to regulations.
Respondents were asked if they had experienced any lost sales due to regulations or delays in permitting, to which 33% of respondents answered “yes” (). However, the majority of respondents (56%) reported no lost sales due to regulations. Respondents were also asked if they had lost opportunities for expansion or diversification due to regulations, to which the majority of respondents said “yes” (). Only 21% of respondents indicated that they had not lost any opportunities for expansion or diversification due to regulations. Forty percent of respondents specifically indicated a desire to expand the size of their operation and reported being unable to do so due to delays and resulting costs associated with obtaining permits.
Total number of licenses and permits
The total number of recurring licenses and permits captured by the survey was 315, with a range of from 0 to 16 per farm (). These data, however, may be under-reported due to no response by some producers, because it is highly unlikely for a producer not to have a license or permit of some form to be in commercial operation. The greatest numbers of recurring filings for licenses and permits were reported by producers in Washington, who reported a total of 203 regulatory filings; followed by California (90) and Oregon (22). However, when looking at the data on a per-farm basis, both Washington and California were tied with a mean value of 7 permits per farm. The ranges for the number of permits per farm were also similar, with 2 to 15 reported in California and 0 to 16 reported in Washington. Oregon respondents reported a range between 0 and 8 permits per farm. It should be clarified that some of the larger-scale respondents had multiple shellfish lease sites that each required separate licenses and/or permits. Thus, some producers were required to have multiple filings for the same permits because separate permits were required for each lease site.
Table 5. Total number of recurring regulatory filings (includes all applications required), Pacific coast shellfish survey respondents, 2017.
Recurring permits and licenses were also sorted by level of government agency (). The majority of permits and licenses captured by the survey were at the state agency level (61%). This was followed by federal (28%), local (5%), and international permits (1%). It should be noted that some federal permit processes required the involvement and approval of state agencies. For example, the permitting process for the Army Corps of Engineers Nationwide 48 permit in the state of Washington also involves consultation with state agencies such as the Washington Department of Ecology.
Table 6. Total number of recurring regulatory filings reported (includes all applications required) by level of government agency, Pacific coast shellfish survey respondents, 2017.
Sorting the permits and regulatory filings captured by the survey into six regulatory categories revealed that the most common regulatory category was the aquaculture permit that included aquatic farm registrations and shellfish operator’s licenses (44%) (). Food safety was the second most common regulatory category (22%), followed by environmental management (20%), interstate transport (11%) and legal and labor standards (3%). As expected, none of the observations from the survey captured any permits or licenses related to aquatic animal health. In each of the three study states the most common regulatory filing and permits were those pertaining to the aquaculture category ().
Table 7. Number of recurring permits/filings by regulatory category, Pacific coast shellfish survey respondents, 2017.
Table 8. Number of recurring permits/filings by regulatory category by state, Pacific coast shellfish survey respondents, 2017.
Total regulatory costs
The total annual regulatory cost tabulated from the observations across the three study states was over $11.5 million (). When adjusted for the coverage rate of the survey (74%), the total regional cost was estimated to be $15.6 million. Regulatory costs per farm across the region, were estimated on average to be $240,621 with a median cost of $58,769 per farm. Among the study states, California demonstrated the highest total reported regulatory cost per state ($6.2 million), average regulatory cost per farm ($473,727), and median regulatory cost per farm ($186,775). Washington State followed with a total per-state regulatory cost of $5.1 million, an average estimated per farm cost of $171,481, and an estimated median per-farm cost of $38,151. Although the total regulatory cost and average per-farm regulatory cost in Oregon were both less than in the other states, the median regulatory cost per farm ($41,160) was similar to that of Washington State. Regulatory costs were also calculated based on the reported number of hectares in cultivation for each observation (). The mean regulatory cost per hectare across the Pacific coast region was $68,936 per hectare. California exhibited the highest mean regulatory cost per hectare per farm at $125,072; followed by Washington ($55,662/ha) and Oregon ($2,628/ha).
Table 9. Total annual regulatory cost by state.
In addition to the increased on-farm costs created by regulations, there were additional economic effects in the form of lost revenue from two sources: lost sales and lost opportunities, as defined in . shows that the lost revenues were substantial, amounting to $110 million in annual lost sales and $170 million in lost opportunities. The greatest state-wide lost sales and lost opportunities were in the state of Washington, followed by California, and then Oregon.
Table 10. Annual effects on farm sales revenue by state.
Per farm, Washington had the largest mean lost sales per farm ($2.6 million), followed by California and Oregon (). Examples of lost sales included sales that were lost as a result of harvest restrictions or closures, delays in harvesting associated with delayed permit approvals, and a loss of previously available growing area tied to regulatory action. Across the region, lost sales accounted for 39% of the negative effect on farm sales revenue. The remainder (61%) of that negative effect was due to lost opportunities; where Washington ($3.2 million) exceeded the averages for California ($1.5 million) and Oregon ($1.8 million). Lost opportunities were estimated based on thwarted opportunities reported by respondents for expansion of their lease, diversification of species or growing method, or the inability to adopt new technology.
Regulatory costs by cost category
Study data were also sorted into categories of the various types of costs (). The largest category of regulatory cost per farm across the Pacific coast region was “Indirect costs other than Manpower and Changes due to regulations” ($115,008), followed by “Changes due to regulations” ($64,207) and “Manpower” ($47,937). Such indirect costs included legal fees, consultant fees, and others. However, the order of magnitude of regulatory cost categories per farm did vary by state. California exhibited the highest mean regulatory cost per farm of “Indirect costs other than Manpower and Changes due to regulations” ($241,729), “Changes due to regulations” ($155,490), and “Manpower” ($58,169). Washington state had the highest mean regulatory costs per farm for “Permits and Licenses” ($12,129). Overall, permits and licenses constituted only 4% of Pacific coast regulatory costs (data not shown).
Table 11. Annual regulatory costs by type of cost.
Regulatory costs by type of regulation
The data were also tabulated by the type of regulation. Unfortunately, the costs of manpower for permits and manpower for compliance could not be factored into this breakdown due to a lack of specific data on the nature of each individual’s role within the businesses. As such, researchers were unable to assign manpower activities to specific types of regulations without making broad assumptions, and instead opted to exclude manpower from this grouping. By cost, environmental management permits and regulatory filings were on average the most expensive regulatory category across the Pacific coast region ($84,615/farm) (). The second most expensive of the six categories was the aquaculture permit category ($65,974/farm), followed by food safety ($28,149/farm), legal and labor standards ($1,563/farm), and interstate transport ($393/farm).
Table 12. Annual regulatory cost by type of regulation, excluding Manpower,Table Footnotea Pacific coast shellfish survey respondents, 2017.
In terms of the cost of the six regulatory categories, there was variation amongst the study states. California exhibited the highest mean costs associated with aquaculture permits and regulatory filings at a cost of $109,949 per farm (). This was followed by Washington with a mean cost of $58,749 per farm. California also led in the mean cost of environmental management permits and regulatory filings per farm with $207,941 per farm.
Regulatory costs associated with obtaining permits and licenses
Given the importance of delays in obtaining permits and licenses to shellfish businesses, the data were further sorted into costs associated with obtaining permits and licenses from those associated with monitoring and compliance. “Legal Fees” ($43,171) was the largest contributor to mean regulatory cost per farm of obtaining permits and licenses in the Pacific coast region (). This was followed by “Manpower” ($27,273/farm); which captured the value of time that business employees had to spend on paperwork, meetings, testifying, public relations, compiling science, and other permit-related activities (). “Manpower” was followed by “Sunk Costs” ($18,364) as the third largest mean regulatory cost associated with obtaining licenses and permits (); which was followed by “Consultants,” “Permits & Licenses,” and the costs for “Expert Witness.” Mean costs per farm in Oregon revealed that only “Permits and Licenses,” “Consultants,” “Sunk Costs,” “Manpower,” and “Transportation” contributed to the overall costs associated with obtaining permits and licenses (). Respondents from California and Washington reported additional cost categories for obtaining licenses and permits.
Figure 4. Average manpower expended for obtaining licenses and permits, Pacific coast shellfish survey respondents, 2017.
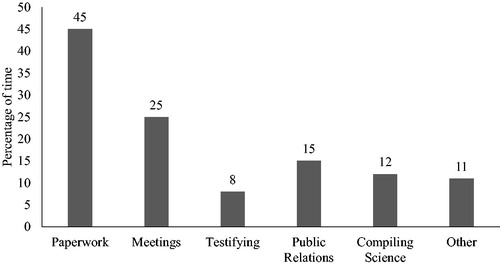
Table 13. Annual regulatory costs associated with obtaining permits by farm and by state.
Delays in obtaining permits also resulted in lost sales and lost opportunities for Pacific coast shellfish producers. Mean lost sales per farm resulting from delays in obtaining licenses and permits were reported to be $1.7 million for the Pacific coast region (). Washington state exhibited the largest mean lost sales per farm due to delays in licenses and permits ($2.6 million) followed by California ($223,462) and Oregon ($12,000). Washington State also exhibited the largest mean lost opportunities per farm associated with obtaining licenses and permits ($3.2 million). However, Oregon ($1.8 million) exhibited greater lost opportunities resulting from delays associated with licenses and permits than California ($1.5 million). Across the Pacific region, the total regulatory cost associated with obtaining licenses and permits captured by the survey was $6.8 million annually.
Regulatory costs associated with monitoring and compliance
Annual regulatory costs associated with on-going monitoring, reporting, and compliance activities ($4.7 million) across the Pacific coast region () were 69.5% of the annual costs associated with obtaining the permits and licenses. The greatest contributor to the cost of on-going monitoring and compliance was “Changes for Compliance” ($64,207 per farm), followed by “Manpower” ($20,664); which included activities such as sampling, monitoring, record-keeping, reporting, and meetings ().
Figure 5. Average manpower expended for regulatory monitoring and compliance, Pacific coast shellfish survey respondents, 2017.
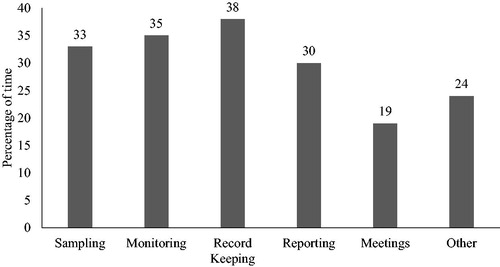
Table 14. Annual regulatory costs of monitoring and compliance by farm and by state.
California exhibited the highest mean cost of “Changes for Compliance” ($155,490 per farm), followed by Washington ($33,078 per farm) (). Likewise, the mean costs for “Consultants,” “Legal,” and “Testing” were also higher in California than in the other Pacific coast states. The mean cost of “Manpower” was highest in Washington ($25,461 per farm), as was the mean cost of “Employee Training” ($2,567 per farm). Costs within states were highly variable among farms; with not all farms reporting costs for all categories.
Some farms in Washington and California reported lost sales resulting from delays in compliance and monitoring (). Across the Pacific coast region, mean lost sales resulting from delays in monitoring and compliance were $35,127 per farm. Oregon reported the largest lost sales per farm due to ongoing monitoring and compliance ($100,000). Washington reported greater mean lost sales per farm ($30,689) than California ($20,418). None of the farms that participated in the study reported lost opportunities resulting from delays in monitoring or compliance activities.
Regulatory costs as a percentage of total costs and sales
summarizes regulatory costs, lost sales, and lost opportunities as a percent of total costs (combined production and marketing costs), and sales revenues for the Pacific coast region. It should be noted that a large number of respondents (56%) reported having no costs for marketing activities. These respondents either sold all their products to a wholesaler, distributor or to a larger farm that conducted marketing activities. The mean regulatory cost as a percent of total costs for the Pacific coast region was 29% (median = 29%). Regulatory costs as a percent of farm sales were 25% on average (median = 9%) for the region. Examining the effects on sales reveals that lost sales due to regulations represented 11% of total costs (production and marketing costs) and lost opportunities 20% of total costs for the region. Compared to farm sales, lost sales were 23% of sales revenue, whereas lost opportunities represented 70% of farm sales.
Table 15. Pacific coast regulatory costs as percent of total costs (production and marketing costs), and sales.
Of the three study states, California had the highest estimated mean (41%) and median (37%) regulatory cost as a percent of total costs, and as a percent of sales revenue (data not shown). Washington State had an average regulatory cost as a percent of total costs of 27%, with a mean of 25% (data not shown). Mean (15%) and median (11%) regulatory costs per farm as a percentage of total cost and sales revenue were lowest in Oregon (data not shown).
Regulatory costs by farm size
Across the Pacific coast region (), the cost of regulations per farm was greatest on “Medium” farms. This was followed by “Large” farms, “Small” farms, and “X-Small” farms. On a per-ha basis (), farm size effects demonstrated that “Large” farms had the lowest (mean = $514/ha; median = $363/ha) regulatory cost. In contrast, “X-Small” farms demonstrated the greatest mean regulatory cost/ha, 382 times greater than that of the largest farm size. The median values per farm demonstrated variability within state and among farms.
Table 16. Total annual regulatory cost by farm size.
The effects of regulations on farm sales revenue are summarized by farm size in . “Large” farms had the largest mean lost sales per farm ($15.2 million), and lost opportunities per farm ($20.7 million), followed by “Medium” farms, “Small” farms, and “X-Small” farms. Per-hectare, the “X-Small” farms exhibited the largest mean lost sales per hectare ($118,066) and the greatest lost opportunities ($117,540/ha). Lost sales/ha on the X-Small farms were 10.5 times greater than those for the largest farm size, and lost opportunities per ha were 4.6 times greater than those on the largest farm size.
Table 17. Effects on annual farm sales revenue (lost sales and lost opportunities) by farm size.
Across the farm size categories (Large, Medium, Small, X-Small) “Permits and Licenses” accounted for the smallest portion of types of regulatory costs (). “Large” farms exhibited the greatest mean costs for “Manpower,” while “Medium” farms had the largest mean cost for “Indirect costs other than Manpower and Changes due to regulations” and the largest costs for “Changes due to regulations.” “Small” farms reported the largest cost for “Permits and licenses.” Of note is that “Small” farms and “X-Small” farms all had similar median regulatory costs for “Permits and licenses.” Also noteworthy is that “Small” farms and “X-Small” farms had similar median costs for “Manpower.”
Table 18. Farm size effects by types of annual regulatory costs.
The greater negative effects of the regulatory burden on smaller farms was also evident when regulatory costs, lost sales, and lost opportunities were calculated as a percent of total costs and of farm sales (). However, percentages of lost sales and lost opportunities were generally greatest on the largest farm size.
Table 19. Farm size effects of regulatory costs: mean and median percent of total costs (production and marketing costs) and sales.
Larger farms experienced much greater costs associated with legal fees, manpower, and sunk costs to obtain permits () than did smaller farms. “Large” farms also experienced far greater effects on farm sales revenue resulting from delays in permitting and licenses, with mean per-farm lost sales of $15.1 million and mean per-farm lost opportunities of $20.7 million.
Table 20. Means of annual costs associated with obtaining permits by farm size.
For monitoring and compliance, manpower composed the greatest cost on “Large” farms, but changes to be in compliance were the greatest compliance cost for the other farm sizes (). The cost of delays associated with monitoring and compliance also had substantial negative effects on revenue.
Table 21. Means of annual costs of monitoring and compliance by farm size.
Discussion
The shellfish industry is a major component of U.S. aquaculture, with the state of Washington being the largest aquaculture-producing state in the U.S. More than half of respondents to this survey reported regulations as the greatest challenge to their business. The rigorous regulatory system in the U.S. has resulted in clear benefits to society in the form of improved environmental health, greater safety of food products available to consumers, better control and response to animal diseases, and achievements toward other societal goals. Aquaculture producers, consumers, and others understand that an orderly society provides benefits to individuals and to businesses and that various types of regulations are needed to address externalities. Nevertheless, increasing numbers of studies are pointing to an aquaculture business environment in the U.S. that may have become excessively convoluted, redundant, and inefficient in terms of achieving the societal goals expressed in the original legislation underlying the various laws that govern the U.S. More specific to aquaculture, previous studies on on-farm economic effects of the regulatory system in the U.S. have shown the regulatory compliance burden to be of an order of magnitude that warrants efforts to seek more cost-efficient ways to provide the same level of rigor and oversight.
Given that shellfish is a large segment of U.S. aquaculture, it is not surprising that the total values of the regulatory cost burden on farms measured in this study were greater than those in previous studies of the salmonid and baitfish/sportfish sectors in the U.S (Engle et al., Citation2019; van Senten & Engle, Citation2017). The proportion of the mean cost of licenses and permits for Pacific coast shellfish (4%), however, was similar to the percentages calculated for U.S. baitfish and sportfish (1%) and U.S. salmonid (2%) aquaculture (Engle et al., Citation2019; van Senten & Engle, Citation2017). For Pacific coast shellfish 85% of regulatory costs were indirect costs of compliance; compared to only 30% for U.S. salmonids (Engle et al., Citation2019). Mean regulatory costs as a percent of total farm costs for Pacific coast shellfish were estimated to be 29%; greater than the 12% estimated for U.S. salmonids (Engle et al., Citation2019) and the 25% estimated for U.S. baitfish and sportfish (van Senten & Engle, Citation2017).
This study documented substantial constraining effects of the regulatory system on Pacific coast shellfish farms. More than one-third of respondents reported that regulatory constraints prevented them from expanding their business operations to take advantage of growing demand for their products. One respondent shared that “regulations have kept expanding, and are now a roadblock to expansion and diversification.” Growing demand for locally grown food generally (Darby et al., Citation2008) and shellfish in particular (Chen et al., Citation2017) has created substantial business opportunities in the shellfish industry. The data suggest that the high costs associated with obtaining permits for new leases and expansion of existing operations were the principal barrier to entry for new farms and constraint to expansion of the Pacific coast shellfish industry to be able to capture the growth in demand for U.S. produced shellfish.
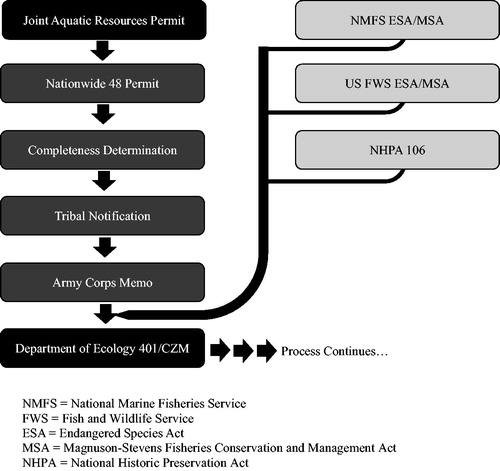
The U.S. regulatory structure begins with the laws that are passed on federal, state, and local levels. The laws typically charge one or more agencies with developing the rules that will be used to attempt to carry out the spirit of the law that was passed. Once rules are developed, permit writers draft the specific requirements that individual entities will need to follow and inspectors then issue specific instructions to individual farms. The permitting regime for Pacific coast shellfish is especially complex, involving multiple agencies at the state and federal level (Evrard, Citation2017). Many of the required consultations and approvals are sequential in nature, meaning that agency approval must be obtained before the permit application can proceed for review by another agency. provides a truncated example of the process a Washington State shellfish producer would encounter to apply for a new farm operation in marine waters. The agencies involved in the consultation and review process include the U.S. Army Corps of Engineers, U.S. Coast Guard, Washington Department of Natural Resources, Washington Department of Health, Washington Department of Ecology, local county officials, and Native American tribes. Similar truncated permitting processes exist for the California shellfish industry, further complicated by a Coastal Commission that can nullify progress made with the standard regulatory agencies. As noted by Abate et al. (Citation2018), agencies often have conflicting and competing mandates that may result in rivalry in the enforcement of regulatory requirements. Survey respondents in this study reported changing requirements by agencies during the permit review process and a lack of communication between agencies; resulting in delays and additional expenses for producers. Due to the sequential nature of these permits, a delay at one agency resulted in an overall delay in the approval of a lease. Public involvement in the permitting process has also resulted in additional costs for producers, who reported costs of legal services to litigate and defend permit applications. The mean regional cost of legal services associated with obtaining licenses and permits was $43,171 per farm (). The high number of “Aquaculture” filings and the associated costs of obtaining those permits is explained by the cascade of licenses and permits required for a farm or lease site.
Figure 6. Truncated example of sequential shellfish permits for Washington state producers, Pacific coast shellfish survey respondents, 2017.
Previous studies revealed that small-scale producers faced a disproportionately greater regulatory burden on a per-ha basis (baitfish/sportfish) or per-kg basis (salmonids) when compared to larger-scale producers (Engle et al., Citation2019; van Senten & Engle, Citation2017). This was due to a high portion of regulatory costs being fixed costs rather than variable costs, meaning that smaller producers had to spread the same costs of compliance as larger producers over a smaller area (and volume) of production. The principal strategy to reduce fixed costs per kilogram of production is to increase the scale of the overall operation. In this study, the delays and magnitude of costs associated with obtaining permits for new leases are such that it has become difficult for smaller-scale farmers to manage their increased fixed costs. Thus, smaller producers must cover similar costs as those on larger farms, but over a much smaller area of cultivation, and a subsequently greater cost per hectare. In fact, the number of reported shellfish farms on the Pacific coast decreased by 22% across the Pacific coast region between the 2005 and 2013 Census of Aquaculture (USDA, Citation2014). In addition, respondents in all three study states reported “Sunk Costs” for licenses and permits that were denied or never obtained (mean $18,364 per farm). Additional research is needed to explore in depth the economic effects of the substantial investments in facilities, consultants, attorneys, and farm employee time to obtain permits. The regulatory framework may be driving the shellfish industry into a more concentrated industry, contrary to growing demand for locally raised and community-based food supply systems.
The substantial delays in permitting shellfish operations may also result in unfortunate responses due to creation of un-intended “perverse incentives.” This is a social policy term that refers to incentives that have unintended and undesirable results contrary to the interests of the incentive makers; somewhat akin to moral hazard. For example, several survey respondents indicated that they could not switch to new gear types that were more efficient with reduced environmental effects, due to the substantial delays in permitting. Many shellfish permits require specification of the gear to be used. Thus, for a farm to change to another gear type requires a new permit. Shellfish producers, particularly those operating on a smaller scale, cannot survive financially if required to wait for a year or more to obtain a new permit to begin to use new types of gear. In such cases, not only does the permitting system impose a financial hardship, but it also prevents the grower from adopting more environmentally friendly gear.
The inability of many shellfish farms to expand in the face of strong demand for their products is also likely to attract international competition. New technologies may offer opportunities for greater shipping of fresh shellfish products and the existence of strong markets in the U.S. without an industry capable of meeting that demand represents opportunities for other countries. The reported lost sales of $110 million per year and lost opportunities estimated at $169.9 million per year provide an indication of the potential size of the Pacific coast shellfish industry and an estimate of the farm-level economic activity foregone (not including multiplier effects) due to regulatory constraints.
This study, similar to the previous studies that have measured on-farm regulatory costs, found a great deal of variability in the regulatory cost burden, across states and farm sizes, but also among farms in the same regulatory district. The U.S. regulatory system provides for a great deal of discretion on the part of permit writers and of individual inspectors, that introduces some additional degree of variability in the overall regulatory burden. Inadequate training, personal biases or inexperience may result in errors made by regulatory personnel that introduce variability into the overall regulatory system (Osmundsen et al., Citation2017). Additional variability stems from the nature of the study design of a single-year snapshot of regulatory costs. In this and previous studies, there were a few respondents who had experienced very high regulatory costs in the study period. There also were reports of other farms that had experienced similarly high regulatory costs in other years, but those data were not included in this study because they occurred outside the study year. While limited numbers of very high regulatory costs technically would be considered outliers, the data were verified by farm records and were valid data points. Thus, these data points were not omitted from the database. Throughout the presentation of the data, we have presented medians as well as means wherever possible, while still ensuring that the confidentiality of individual farm financial information was protected.
If we were able to continue this study for 10 years, it is likely that there would be a number of data points of very high regulatory costs for any given segment of U.S. aquaculture. It would also capture cumulative effects over time of the regulatory cost burden. With just one year’s data, the number of farms that experienced severe regulatory costs in that particular year was small and it was not possible to account for cumulative effects over time. Thus, it is possible that this study under-estimated the overall regulatory cost burden, in spite of the magnitude of the farm-level economic effects measured.
A common concern by members of the general public as related to shellfish is the food safety risk of eating raw shellfish. In this study, however, the major regulatory burden was found to be lost sales and opportunities that were due primarily to extended delays in obtaining permits, not to the monitoring and routine health-related compliance costs. When asked which regulations created the greatest problems, the Army Corps of Engineers permits required for shellfish farming were the most frequently mentioned problem. Moreover, food safety-related regulatory costs were only the third-greatest regulatory cost in terms of monitoring and routine compliance costs. Throughout the interviews with shellfish producers, there were no objections to the temperature measurement and control requirements to ensure product safety. Farmers frequently mentioned how important it was to them to provide a safe and healthy product to their customers. An example of the type of complaint with regard to food safety issue, however, was that the temperature data measured had to be recorded on three separate and different forms and then uploaded to three separate regulatory agencies with comments that there should be a mechanism to record and upload the data a single time, and made accessible to all agencies that required that same data.
This study examined only shellfish producers on the Pacific coast and not other types of businesses. Thus, it is not known to what extent shellfish farms may have greater or lesser regulatory compliance burdens than other businesses. Yet studies of other economic sectors have suggested similar types of results (Crain & Crain, Citation2010). It may be that the overall regulatory compliance burden is greater than commonly thought across other U.S. business sectors.
Conclusions
The Pacific coast shellfish industry has contended with extensive delays in permitting resulting in high regulatory costs and substantial lost sales and opportunities. Mean annual regulatory costs for Pacific coast shellfish producers were estimated to be $240,621 per farm and $68,936 per hectare. The total annual regulatory burden for the Pacific coast region was estimated at $15.6 million per year, with an additional $110 million in annual lost sales revenue in addition to $169.9 million per year in lost business opportunities. The majority of regulatory costs captured by the study were indirect costs of compliance such as manpower for compliance, legal expenses, and changes in equipment or management for compliance; the total accounting for 85% of regulatory costs on average across the Pacific coast region. Thus, the regulatory cost burden on shellfish farms cannot be measured by only examining the application costs of permits/licenses and laboratory testing costs. Regulatory costs associated with obtaining licenses and permits across the region were 1.4 times the costs associated with on-going monitoring, reporting, and compliance. California had the greatest total state regulatory cost ($6,158,446) and the greatest mean per-farm regulatory cost ($473,727 per farm). Study results point to regulatory constraints to growth of the shellfish industry with more than one-third reporting that regulations prevented them from expanding to meet market demand. Smaller-scale producers were affected negatively by regulatory costs to a disproportionately greater degree than were larger farms. Study results suggest that there is a strong need for streamlining the permitting process to achieve substantial reductions in the time required to obtain permits. The results from this study confirm that the Pacific coast shellfish industry, like the salmonid and baitfish/sportfish sectors in the U.S., is constrained by the U.S. regulatory environment; affecting the industry’s ability to meet the growing demand for U.S. shellfish aquaculture products.
Acknowledgements
We would like to thank the individuals who participated in the planning, implementation, and execution of this study. Thank you to the producers who gave of their time and shared their data for this study. Thank you also to our project collaborators Bill Dewey, Gary Fornshell, William Hanshumaker, and our project monitor Gunnar Knapp. In addition, we would like to acknowledge Steven R. Booth from the Pacific Shellfish Institute and the Pacific Coast Shellfish Growers Association for their assistance in contacting growers and their support of this project.
Additional information
Funding
References
- Abate, T. G., Nielsen, R., & Tveterås, R. (2016). Stringency of environmental regulation and aquaculture growth: A cross-country analysis. Aquaculture Economics & Management, 20(2), 201–221. https://doi.org/10.1080/13657305.2016.1156191
- Abate, T., Nielsen, R., & Nielsen, M. (2018). Agency rivalry in a shared regulatory space and its impact on social welfare: The case of aquaculture regulation. Aquaculture Economics & Management, 22(1), 27–48. https://doi.org/10.1080/13657305.2017.1334243
- Anonymous. (1979, January). Aquaculturists seek relief from regulatory constraints. The Commercial Fish Farmer and Aquaculture News 5(2), 8–11, 44–45.
- Chen, J. Q., Haws, M. C., Fong, Q. S. W., & Leung, P. (2017). Locally grown oysters in Hawai’i: Chef preference and local premium? Journal of the World Aquaculture Society, 48(6), 972–980. https://doi.org/10.1111/jwas.12430
- Crain, N. V., & Crain, W. M. (2010). The impact of regulatory costs on small firms. A report for The Office of Advocacy, U.S. Small Business Administration.
- Darby, K., Batte, M. T., Ernst, S., & Roe, B. (2008). Decomposing local: A conjoint analysis of locally produced foods. American Journal of Agricultural Economics, 90(2), 476–486. https://doi.org/10.1111/j.1467-8276.2007.01111.x
- Engle, C. R. (2016). Sustainable growth of aquaculture: The need for research to evaluate the impacts of regulatory frameworks. Journal of the World Aquaculture Society, 47(4), 461–463. https://doi.org/10.1111/jwas.12340
- Engle, C. R., & Stone, N. (2013). Competitiveness of U.S. aquaculture within the current U.S. regulatory framework. Aquaculture Economics & Management, 17(3), 251–280. https://doi.org/10.1080/13657305.2013.812158
- Engle, C. R., & Wossink, A. (2008). Economics of better management practices in aquaculture. In C. Tucker and J. Hargreaves (Eds.), Best management practices for aquaculture. Environmental best management practices for United States aquaculture (pp. 519–551). Blackwell Publishing.
- Engle, C. R., Senten, J., & Fornshell, G. (2019). Regulatory costs on U.S. salmonid farms. Journal of the World Aquaculture Society, 50(3), 522–549. https://doi.org/10.1111/jwas.12604
- Evrard, R. (2017). Washington shellfish aquaculture: Assessment of the current regulatory frameworks. University of Washington, School of Marine and Environmental Affairs. https://digital.lib.washington.edu/researchworks/bitstream/handle/1773/38654/Evrard_washington_0250O_16923.pdf?sequence=1&isAllowed=y
- Fairchild, E. A., Cullen, K., Grimm, C., Keirns, T., & A. Smith (2017). Evaluation of Northeast Regional Aquaculture Center (NRAC) Funding. Final Report. Northeast Regional Aquaculture Center. www.agresearch.umd.edu/nrac.
- FAO. (2018). The State of World Fisheries and Aquaculture (SOFIA). FAO Fisheries and Aquaculture Department. http://www.fao.org/3/I9540EN/i9540en.pdf
- Gibson, R. T. (1979, May/June). Red tape versus green light. The Commercial Fish Farmer and Aquaculture News, 5(4), 12–14.
- Hale, A. R., Borys, D., & Adams, M. (2015). Safety regulation: The lessons of workplace safety rule management for managing the regulatory burden. Safety Science, 71, 112–122. https://doi.org/10.1016/j.ssci.2013.11.012
- Harrington, H. J., & McNellis, T. (2006). Mobilizing the right lean metrics for success. Quality Digest Magazine. https://www.qualitydigest.com/may06/articles/02_article.shtml
- Hudson, K. (2017). Virginia shellfish aquaculture situation and outlook report: Results of the 2016 Virginia Shellfish Aquaculture Crop Reporting Survey. Virginia Institute of Marine Science. Marine Resource Report No. 2017-7. The College of William & Mary. http://www.vims.edu/research/units/centerspartners/map/aquaculture/docs_aqua/2017_shellfish-_report2.pdf
- Hurley, S. P., & Noel, J. (2006). An estimation of the regulatory cost on California agricultural producers [Report]. American Agricultural Economics Association, Long Beach, California, USA. www.calpoly.edu
- Kite-Powell, H., Rubino, M. C., & Morehead, B. (2013). The future of US seafood supply. Aquaculture Economics & Management, 17(3), 228–250. https://doi.org/10.1080/13657305.2013.812691
- Knapp, G., & Rubino, M. C. (2016). The political economics of marine aquaculture in the United States. Reviews in Fisheries Science & Aquaculture, 24(3), 213–229. https://doi.org/10.1080/23308249.2015.1121202
- Kroeger, T. (2012). Dollars and sense: Economic benefits and impacts from two oyster reef restoration projects in the Northern Gulf of Mexico. The Nature Conservancy. https://www.conservationgateway.org/Documents/2_Oyster%20restoration%20study_Kroeger%20May%209%202012.pdf
- National Center for Environmental Economics. (2014). Retrospective study of the costs of EPA regulations: a report of four case studies. Washington, DC: Office of Policy, U.S. Environmental Protection Agency.
- Northern Economics. (2013). The economic impact of shellfish aquaculture in Washington, Oregon, and California. Pacific Shellfish Institute, Seattle, Washington.
- O’Connell, T. (2018). Evaluation of U.S. shellfish aquaculture permitting systems: Recommendations to improve permitting efficiencies and industry development. NOAA National Marine Fisheries Service. https://www.fisheries.noaa.gov/webdam/download/76696584
- Office of Management and Budget-Office of Information and Regulatory Affairs. (2017). 2017 draft report to congress on the benefits and costs of federal regulations and agency compliance with unfunded mandates reform act. Washington, DC: Office of Information and Regulatory Affairs, Office of Management and Budget, Executive Office of the President of the United States.
- Osmundsen, T. C., Almklov, P., & Tveterås, R. (2017). Fish farmers and regulators coping with the wickedness of aquaculture. Aquaculture Economics & Management, 21(1), 163–183. https://doi.org/10.1080/13657305.2017.1262476
- Philippakos, E., Adams, C., Hodges, A., Mulkey, D., Comer, D., & Sturmer, L. (2001). Economic impact of the Florida cultured hard clam industry. Florida Sea Grant. University of Florida. SGR, 123. http://aquaticcommons.org/295/1/Culturedhardclams.pdf
- Shumway, S. E., Davis, C., Downey, R., Karney, R., Kraeuter, J., Parsons, J., Rheault, R., & Wikfors, G. (2003). Shellfish Aquaculture – In Praise of Sustainable Economies and Environments. World Aquaculture, 34(4), 15–17.
- Shumway, S. E. (2011). Shellfish aquaculture and the environment. John Wiley & Sons. ISBN: 978-0-8138-1413-1.
- Thunberg, E. M., Adams, C. M., & Cichra, C. E. (1994). Economic, regulatory, and technological barriers to entry into the Florida aquaculture industry. Journal of Applied Aquaculture, 4(2), 3–14. https://doi.org/10.1300/J028v04n02_02
- United States Department of Agriculture. (2014). Census of aquaculture (2012). National Agricultural Statistics Service, USDA. www.agcensus.usda.gov.
- van der Schatte Olivier, A., Jones, L., Vay, L. L., Christie, M., Wilson, J., & Malham, S. K. (2020). A global review of the ecosystem services provided by bivalve aquaculture. Reviews in Aquaculture, 12(1), 3–25. https://doi.org/10.1111/raq.12301
- van Senten, J., & Engle, C. R. (2017). The cost of regulations on U.S. baitfish and sportfish producers. Journal of the World Aquaculture Society, 48(3), 503–517. https://doi.org/10.1111/jwas.12416
- van Senten, J., Dey, M., & Engle, C. R. (2018). Effects of regulations on technical efficiency of U.S. baitfish and sportfish producers. Aquaculture Economics & Management, 22(3), 284–305. https://doi.org/10.1080/13657305.2018.1454539
- van Senten, J., Engle, C. R., Hartman, K., Johnson, K. K., & Gustafson, L. L. (2018). Is there an economic incentive for farmer participation in a uniform health standard for aquaculture farms? An empirical case study. Preventive Veterinary Medicine, 156, 58–67. https://doi.org/10.1016/j.prevetmed.2018.05.007
- van Senten, J., Engle, C. R., Parker, M., & Webster, D. (2020). Analysis of the economic benefits of the Maryland shellfish aquaculture industry [Project report]. Chesapeake Bay Foundation.