
 ?Mathematical formulae have been encoded as MathML and are displayed in this HTML version using MathJax in order to improve their display. Uncheck the box to turn MathJax off. This feature requires Javascript. Click on a formula to zoom.
Abstract
The study uses firm level panel data to determine performance-leverage relationships among Mediterranean aquaculture production firms in Croatia, Italy, Spain, France and Greece. A stochastic frontier production function is used to determine and define performance through firm level efficiency estimates. The multilevel internal instrument variable approach is employed to identify the causal relationships between performance and leverage. Our results show that technical efficiency has been increasing across all firms over the period 2008–2016. The agency-cost hypothesis holds such that leverage has an inverted U-shaped relationship with performance. This implies that leverage increases with efficiency, but efficiency begins to decrease at sufficiently higher levels of leverage. The reverse relationship confirms the franchise-value hypothesis, which states that firms with high efficiency will try to protect the value of their high income by holding more equity capital. Implications for the results are drawn for the Mediterranean region.
Introduction
Increased trade and internationalization of seafood markets are fueled by the continuous growth in aquaculture production, which has increased competition for firms operating within this sector (Anderson et al., Citation2018; Garlock et al., Citation2020). This development is influencing firm structure due to mergers to exploit scale and scope economies (Asche et al., Citation2013; Kvaløy & Tveterås, Citation2008) as well as access to input suppliers including access to capital (Asche, Citation2008). In addition to traditional studies of technical change and productivity, this has led to increasing attention to factors influencing industry structure. This includes agglomeration (Asche et al., Citation2016; Tveteras, Citation2002), learning by doing (Nilsen, Citation2010) and innovation structure (Bergesen & Tveterås, Citation2019). In aquaculture industries where firm size has increased, financial performance is also receiving more attention (Asche et al., Citation2018; Dahl et al., Citation2021; Misund & Nygård, Citation2018; Nygård, Citation2020), while access to capital is shown to limit firm development in other sectors (Mitra et al., Citation2019).
This paper will test two agency-cost hypotheses related to financial leverage for Mediterranean aquaculture: The franchise-value and efficiency-risk hypotheses (Berger & Di Patti, Citation2006). The franchise-value hypothesis indicates that firms with high efficiency will try to protect the value of income by holding more equity capital, whereas the efficiency-risk hypothesis says that more efficient firms will have higher debt ratios than less efficient firms. More specifically, this paper investigates the development of the Mediterranean aquaculture firms’ performance using panel data over the period 2008–2016 to determine firm efficiency and performance-leverage relationships. The firms investigated are located in Croatia, Italy, Spain, France and Greece, which are the main producers of seabream and seabass within the European Union. A stochastic frontier production function is used to determine and define performance through firm level efficiency estimates. The multilevel internal instrument variable approach is employed to identify the causal relationships between performance and leverage.
The presence of a relationship between capital structure and performance has been widely debated. As a starting point for this debate, Modigliani and Miller (Citation1959) suggested that firm performance was independent of its capital structure. However, this only holds within a theoretical context (only in efficient markets without taxes, bankruptcy costs, agency costs, and asymmetric information) and has found little empirical support (Le & Phan, Citation2017). Empirical studies have revealed that firm’s capital structure and relationship to performance is highly dependent upon context such as the sector of the industry, strategy of the firm, growth or country (Berger & Di Patti, Citation2006; Degryse et al., Citation2012; Lindblom et al., Citation2011; O’Brien, Citation2003). Thus, capital structure is in most cases an active strategic choice by firm management and that strategies are changed over time and are not fixed (O’Brien, Citation2003).
Hence, the choice of how to supply capital to a firm is an important decision. The decision is most often based on a cost-benefit assessment to evaluate the return rate of the borrowed capital (leverage) and the price that the firm must pay in interest to secure the loan. The capital structure of a firm then refers to a mix of debt and equity capital that a firm holds, supplied by different sources of funds, such as short-term and long-term funds (Margaritis & Psillaki, Citation2010). Thus, this framework tries to uncover the optimal balance between equity and debt used to finance firm operations. Following the efficiency-risk hypothesis, equity capital will be substituted by the high-expected returns from greater profit efficiency in order to avoid the costs of bankruptcy and financial distress (Berger & Di Patti, Citation2006). On another hands, franchise-value hypothesis proposed high efficiency firm to hold more equity capital in order to protect the expected return.
There is increasing evidence that firm structure is changing in Mediterranean aquaculture, a sector that is primarily producing gilthead seabream (Sparus aurata) and European seabass (Dicentrarchus labrax) (Fernández-Polanco et al., Citation2021; Llorente et al., Citation2020; Nielsen et al., Citation2021). In the 1990s, large-scale aquaculture production of seabream and seabass was started in several countries around the Mediterranean Sea. At first, the industry was quite successful showing fast growth in production volume and turnover. However, during the 2000s, the industry faced serious setbacks due to falling prices of their product caused by the increased volumes of supply (Llorente & Luna, Citation2014; Llorente et al., Citation2020). This led to bankruptcies of firms and longer periods of market instability, with high volatility in supply and prices (Fernández-Polanco et al., Citation2021; STECF, Citation2016, Citation2018), strongly affecting the firms’ operational margins (Llorente et al., Citation2020).
Despite the fact that this industry is the most important within aquaculture production in the Mediterranean area and the second largest in the EU, surprisingly little attention has been directed toward how these firms perform and how they cope with the new more competitive business environment (Nielsen et al., Citation2021). Only a hand full of papers have examined the productivity and efficiency among these aquaculture producers focusing on one major producer, Greece (Karagiannis et al., Citation2000; Karagiannis & Katranidis, Citation2000; Karagiannis et al., Citation2002) and only two on the overall Mediterranean aquaculture production (Fernández-Sánchez et al., Citation2020; Nielsen et al., Citation2021). One of the main reasons is that seabass and seabream production takes place in many different countries, and there has not been a common system for data collection, which has been a limitation to conduct research. This limitation has been even greater when research demands information at the firm level, such as efficiency, productivity and performance (Nielsen et al., Citation2021). The review of literature shows that no one has ever related the aquaculture firm efficiency with firm capital structure within the aquaculture sector. Thus, the relationship in focus here is the capital structure as a driver for performance.
Other studies of technical efficiency in aquaculture with a longer time dimension estimating technical change are (Aponte, Citation2020; Aponte & Tveteras, Citation2019; Asche et al., Citation2013; Rahman et al., Citation2021). Furthermore, recent studies analyzing specific effects on technical efficiency include agglomeration (Asche et al., Citation2016; Rahman, Nielsen, & Khan, Citation2019), effects of co-management (Hukom et al., Citation2021) and environmental heterogeneity (Rahman, Nielsen, Khan, et al., Citation2019; Mitra et al., Citation2020). There also exists a significant literature on technical efficiency using firm level data with a short time dimension. Sharma and Leung (Citation2003), Iliyasu, et al. (Citation2014), Long et al. (Citation2020) and See et al. (Citation2021) provide overviews and some recent examples are Khan et al. (Citation2021) and Hukom et al. (Citation2020).
The paper is structured as follows. After this introduction, we provide a brief description of the Mediterranean seabream and seabass aquaculture industry. This is followed by a method and data section before the empirical results are reported. Finally, we discus and conclude on the main findings.
Overview of seabream and seabass production and markets
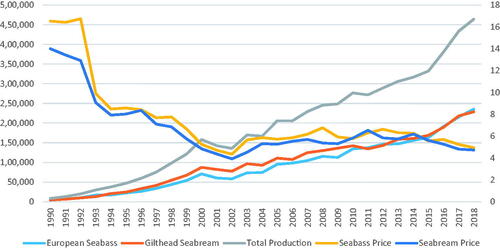
The combined total aquaculture production of Gilthead seabream and European seabass was under 8.000 ton in 1990. It increased to 158.000 ton in 2000 and reaching 464.000 ton in 2018 valued at 2,247 million dollars, what represented an increase of 71% and 29% in quantities and value, respectively in the period 2011–2018 (FAO, Citation2020). The seabream and seabass aquaculture production in the Mediterranean Sea covers 95% of the global production in 2018. In common with other successful aquaculture species (Asche, Citation2008; Kumar & Engle, Citation2016), the rapid production growth has been accompanied by a steep price decline creating a keen competitive environment where poor profitability at times is a challenge (Llorente et al, Citation2020).
Turkey and Greece are the leading producer countries, producing 42% and 22% of the total volume, respectively. Together with Egypt, Spain, and Tunisia they cover 88% of production volume in 2018. Most producers have increased production since 2014 led by Turkey, Egypt and Tunisia, while production among European producers Greece, Spain and Italy grows at a lower rate (FAO, Citation2020). In 1990, the real price per kilo was more than 16 dollars, falling to an all-time low in 2002 of 4 dollars per kilo. This price reduction initiated a crisis among the aquaculture producers in the sector. Hereafter, the prices slightly increased level around 5–6 dollars per kilo, but with cycles. However, increasing production in later years has initiated a decreasing trend from 2011 and onwards ().
Figure 1. Global aquaculture production of seabream and seabass (ton) and average price per kilo (USD) 1990–2018. Source: FishStatJ—Software for Fishery and Aquaculture Statistical Time Series (FAO).
The reaction of seabream and seabass producers to the over-supply crises was price competition, and with portion-sized fish as the main product, it was difficult to differentiate. This has led to a process of business concentration to enhance economic efficiency (Cidad et al., Citation2018; Llorente et al., Citation2020; STECF, Citation2016, Citation2018). The economic performance of seabream and seabass firms in the EU was on average negative from 2008 to 2013 and, after this period, firms returned to positive profitability. Llorente et al. (Citation2020) observed positive effects of a larger firm size on profitability. The comparison of performance indicators by firm size shows that very large firms obtain the highest returns on assets, followed by large firms and the medium-sized firms. However, the very large firms do not necessarily obtain the highest return on equity. The most leveraged firms suffer largely the negative effects of a high degree of indebtedness (Llorente et al., Citation2020).
In Greece, the concentration process of the sector was mainly financed by loans. By 2014, many of these firms were unable to repay these loans and the ownership of the major seabass and seabream aquaculture firms was transferred to the Greek banks. In 2018, the ownership of the three largest firms in Greece was transferred to an investment fund (STECF, Citation2018). Despite the fact that both the financing and the economic performance of seabream and seabass firms have undergone significant changes in recent years, there are no studies that have addressed the effects that capital structure and leverage can have on their competitiveness and profitability.
Method
Application of the agency theory involves determining the relationship between capital structure and firm performance and the relationship that exists between them (Berger & Di Patti, Citation2006).
Several measures have been employed in literature to capture firm performance and encompass variations of financial ratios, mixes of accounting and market values, stock market returns and their volatility, and efficiencies computed from parametric and nonparametric approaches. In this article, we use firm level inefficiency estimates as an indicator of firm performance computed from a stochastic production function. Following Battese and Coelli (Citation1992), we express the stochastic frontier function as:
(1)
(1)
where
is the output in terms of sales revenue of the ith aquaculture firm in period t;
is the vector of input quantities including cost of labor, capital and materials;
is the vector of unknown parameters to be estimated;
is a random term assumed to be independent and identically distributed
and independent of
and
is random term associated with non-negative technical inefficiency of production that is also assumed to be independent and identically distributed with half normal,
or truncated normal of
Both the truncated normal of Pitt and Lee (Citation1981) and the half-normal distribution assumptions of Battese and Coelli (Citation1992) can be tested. Furthermore, time varying effects of technical efficiency is allowed by
where
is an unknown scaler parameter. As such, the non-negative firm effects, technical efficiency,
decrease, remain constant or increase as t increases, if
respectively. The case in which
is positive is likely to be appropriate when firms tend to improve their technical efficiency over time. The variance components of the likelihood function are estimated in terms of
and
The stochastic frontier estimation requires a specific functional form and different forms exist in the literature. We use the more flexible widely used functional form, the translog. A translog can be expressed as:
(2)
(2)
where when all
the translog function reduces to a Cobb–Douglas function. In the Cobb-Douglas function,
represent output elasticities with respect to inputs and their sum equals the estimated output elasticity, which measures returns to scale. In the translog function, the corresponding elasticity evaluated at sample means is given by
Agency cost and reverse causality
In the heart of corporate governance literature is the effect of capital structure impact on firm performance. This relationship is described by what is called the agency cost theory. The agency cost theory deals with the misaligned interests of managers and stakeholders of a firm. In the seminal paper of Jensen and Meckling (Citation1976), the authors emphasize the importance of agency costs of equity arising from the separation of ownership and control of firms whereby managers tend to maximize their own utility rather than the firm’s value. Such conflicts are also observed between debt and equity investors, which arise when there is risk of default that may lead to underinvestment or debt overhang. In this case, debt will have a negative relationship with the value of the firm (Myers, Citation1977). Beyond Myers (Citation1977), early researchers such as Stulz (Citation1990) showed that debt financing can mitigate overinvestment but aggravate underinvestment problem and conclude that debt can have both negative and positive effects on firm performance. This has led to the generally tested agency cost hypothesis that states that higher leverage is expected to lower agency cost, reduce inefficiency and thereby increase firm’s performance. The regression equation for testing this hypothesis can be expressed as:
(3)
(3)
Where INEFF denotes firm performance measured in terms of inefficiency estimates () generated from EquationEquation (1)
(1)
(1) , LEV indicates the leverage ratio (debt-asset ratio), and
denotes vectors of factors other than capital structure that correlate with leverage.
is the stochastic term and
are unknown parameters to be estimated. Under the specified inefficiency model in EquationEquation (3)
(3)
(3) , the effect of leverage on inefficiency should be negative,
However, the literature (Margaritis & Psillaki, Citation2010) shows that possibilities exist such that at high leverage levels, the effect of leverage on inefficiency may be positive, hence,
We allow for quadratic specification of leverage in order to capture this U-shaped relationship.
Following Berger and Di Patti (Citation2006) and Margaritis and Psillaki (Citation2010), firm performance may also affect the choice of capital structure, leading to a reverse causality between capital structure and firm performance. It is stipulated that under the efficiency-risk hypothesis, more efficient firms choose higher leverage ratios because higher efficiency is expected to lower the costs of financial distress. On the other hand, firms which are expected to sustain high efficiency rates into the future are likely to choose lower debt to equity ratios as a means of safeguarding economic rents or franchise value generated by these inefficiencies from the threat of liquidation (Berger & Di Patti, Citation2006). Hence, under the franchise-value hypothesis more efficient firms are likely to choose lower leverage ratios to protect their future income or franchise value. As a result, we empirically estimate the following leverage equation:
(4)
(4)
Here, captures all factors that correlate with leverage other than firm performance while all other terms are as defined in EquationEquation (3)
(3)
(3) . The parameter
could be negative,
in which case reflecting the efficiency-risk hypothesis or positive,
denoting the franchise-value hypothesis. According to Myers (Citation2001), outcome of the model depends on firms debt-equity choice and the economic aspect as well as firm’s characteristics focused on.
The use of ordinary least squares to estimate EquationEquations (3)(3)
(3) and Equation(4)
(4)
(4) can result in biased estimates for two reasons: first because of simultaneity or the bidirectional causal nature between capital structure and firm performance, and secondly, because of unobserved heterogeneity of firms, which may be correlated with capital structure and performance. This occurs when the independence assumption between explanatory variables and the random terms is violated. Omitted variable bias due to unobserved heterogeneity can be addressed using the panel data structure. The simultaneity problem is often addressed using an instrumental variable approach, however, this comes with the challenge of finding valid and strong instruments for the endogenous variables. Internal instrumental variable (IIV) models have now advanced to correct for endogeneity problems when valid instruments are hard to find (see Ebbes et al., Citation2005; Lewbel, Citation1997, Citation2012; Park & Gupta, Citation2012; Kim & Frees, Citation2007).
In this study, we employ Kim and Frees (Citation2007) IIV generalized method of moment multilevel modeling with correlated effects to identify our model given the panel data structure. The multilevel modelFootnote1 can simply be expressed in stacked form as:
(4)
(4)
where
is the response variable,
is composed of regressors that may be exogenous or exogenous in nature and
is the corresponding unknown parameter to be estimated.
is a composite term for all random elements in the model: the structural error term and random components. The multilevel GMM estimator is such that, the GMM estimator is the usual GLS estimator (random effect) when all
are assumed exogenous (i.e.,
) while fixed effects result when all
are assumed endogenous (i.e.,
). The more generalized estimator GMM proposed by Kim and Frees (Citation2007) allows
to be composed of both endogenous and exogenous predictors and uses this information to build internal instruments and this results in
To facilitate the choice of the estimator, a Hausman-test for panel data (Hausman, Citation1978) is used to compare a robust estimator and an estimator that is efficient under the null hypothesis of no omitted variables, and to compare two robust estimators at different levels.
Data
The research is carried out with economic and financial data from the accounts of aquaculture firms. The data is obtained from the Orbis database (Orbis, Citation2018). This database contains firm-level financial accounts (balance sheets and profit and loss accounts) for more than 300 million firms around the world. The information is obtained from public balance sheet declarations for the European firms. Firms within the aquaculture sector are identified by their NACE code,Footnote2 which reveals their main business activity.
For our analysis, 91 firms farming seabass and seabream were selected, covering 612 observations over the years 2008 and 2016. Five countries are included in the data set France, Croatia, Italy, Spain and Greece.Footnote3 To be included in the analysis, firm must have a minimum of two observations over the years covered. The number of firms within each country and year are presented in .
Table 1. Summary statistics, numbers of firms divided on country and year.
The output in the efficiency model is represented by the sales revenue,Footnote4 whereas the inputs are represented by labor cost, material cost and capital cost. All variables are expressed in Euros.Footnote5 In this analysis, each variable is deflated by the country-specific producer price index (however, conclusions from real and nominal values are the same, thus we only present the real value results here) ().
Table 2. Summary statistics of variables included in the models.
Results
The estimation results are presented in two parts: first the measurement of firm performance and subsequently the capital structure—firm performance relationship.
Measurement of firm performance results
presents the parameter estimates of the stochastic frontier model comparing different specifications time varying and time invariant assumptions of the (in)efficiency estimates. Under the time varying assumption, we estimate both half normal and truncated normal models. These variants of models are explored as a search process to identify which properly fits the data at hand. Columns 2, 3 and 4 of presents the time invariant (TINVARTL), the variant—half normal (TVARTL) and time variant—truncated normal (TVARTRTL) variants of the translog production function respectively. The truncated normal time varying production function appear to perform better than the time invariant and half-normal time varying functions. Hence, we choose the time varying translog production function under the truncated-normal assumption. This is confirmed by a likelihood ratio test of hypotheses of parameters of the distribution of the firm effects, the efficiency estimates shown in . All restrictions rejected at the 1 percent significance level indicating that the truncated normal translog function has the best representation of the data.
Table 3. Results of the stochastic frontier production functions.
Table 4. Parameter restrictions of inefficiency distribution and elasticity estimates.
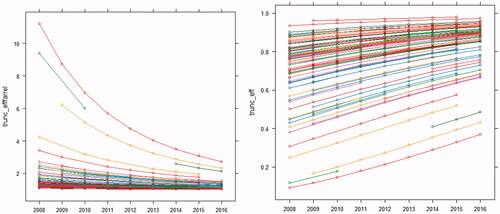
To assess the input effects the marginal effects of each input is estimated, where the marginal product is equal to the elasticity of scale for each input. These are presented at the lower part of where labor shows significantly negative estimate while capital and material have confidence interval estimates that include zero. The parameter, is significantly positive even across models indicating that technical efficiency has been improving over time. Trends in (in)efficiency estimates of individual firms are presented in where each firm’s technical efficiency improves over time. The individual firm level technical efficiencies are our estimates of interest and our measure of firm performance to be used in determining the capital structure and performance relationship in the subsequent section.
Figure 2. (A) Firm level inefficiency trends. (B) Firm level efficiency trends.
Capital structure-firm performance model identification results
In the following, the multilevel IIV approach by Kim and Frees (Citation2007) is applied to identify the appropriate model that identifies the equations of interest. The performance variable is the technical efficiency estimates derived from the previous section. In this subsection, it is represented as inefficiency estimates and hence has values greater than one to infinity. The capital structure or leverage ratio is defined as the debt-asset ratio for which we distinct between short-term (SDA), long-term (LDA) and total (DA) debt-asset ratios. Therefore, we estimate three capital structure equations and four performance equations where each of the SDA, LDA, DA and SDA + LDA are used as explanatory variables. presents Hausman (Citation1978) tests to facilitate the choice of estimator that best represents each equation. The test compares a random effect, fixed effect and general method of moments estimator.
Table 5. Hausman test of representative model for capital structure and performance relations.
Column labeled 1 compares fixed effect estimator at levels 2 and 3 with random effect estimator where lack of statistical significance indicates that the random effect estimator is the most suitable. With the exception of the SDA model, all models show that the random effect model should be chosen. Following this, the deciding estimator is tested against level 2 and 3 GMM estimator where a significant model indicates that a GMM estimator should be used. This implies explanatory variables are composed of a mix of exogenous and endogenous variables. This conclusion applies to all models except the inefficiency model with SDA + LDA as explanatory variables. For the indicative GMM estimator, level 2 is tested against level 3 to decide the most appropriate estimator. In all models except one, the test concludes using a GMM estimator for which internal instruments are constructed to alleviate endogeneity problems.
The agency cost model results
We now turn to evaluating the role of leverage on inefficiency and in turn, whether differences in inefficiency are related to leverage. We evaluate in the presence of other moderating factors. presents the results of the efficiency model for which we evaluate short-term, long-term and total leverage effects on inefficiency. Our aim here is to explore the agency cost hypothesis. The hypothesis states that an increase in leverage increases efficiency and at sufficient leverage levels, efficiency can be negative. From our results, the column labeled Model A shows short-term leverage (SDA) has a significant negative effect on inefficiency where at higher levels of SDA, inefficiency begins to increase given the significant quadratic leverage term. Such a relationship confirms the inverted U shape relationship between efficiency and leverage.
Table 6. Agency cost equations.
Long-term and total leverage effects (LDA and DA) shown in columns labeled Model B and C show similar effects. However, when SDA and LDA are included separately in a single model, only the SDA effect becomes prominent, indicating a high correlation between SDA and LDA. Hence, the agency cost hypothesis is confirmed in the Mediterranean aquaculture industry. Using Croatia as the reference level, we observe that Greece has the same level of inefficiency as Croatia but France, Italy and Spain have significantly lower levels of inefficiency.
Regarding the moderating factors, growth in sales has a significant positive effect on inefficiency only when the short-term leverage is included in the model. Factors such as profit margin and liquidity generally have a significant and negative effect on inefficiency. Risk and investment have no significant effect on inefficiency.
The leverage model results
The leverage model evaluates the relationship between firm performance and leverage with a focus on two hypotheses: the franchise-value and efficiency-risk hypotheses. Our results indicate that inefficiency has a significantly positive effect on all levels of leverage with a somewhat stronger effect is observed in the short-term leverage model. This relationship is consistent to that of the franchise-value hypothesis where firms with high efficiency will try to protect the value of their high income by holding more equity capital.
The levels of leverage for Greece seems to be the same as that of Croatia given that there is no significant effect for the Greece leverage coefficients, which most likely is a consequence of the low number of firms representing Greece in the dataset. However, differences exist between France, Italy and Spain across the leverage levels. For instance, we observe that France, Italy and Spain have significantly higher short-term leverage than Croatia. For long-term leverage, only France and Italy have lower leverage values than Croatia, while total leverage values show equal levels across all countries with the exception of Italy which has higher values than Croatia. The positive and negative effects of France coefficients in short- and long-term leverage models, respectively, appear to be nullified in the total leverage model.
Regarding the moderating factors, asset tangibility has no effect on any of the leverage levels. However, investment, profit margin and liquidity have negative effect on short-term leverage implying that higher values of these variables tend to decrease firm debt-asset ratios. Risk on the other hand increases leverage given the significantly positive relationship. Turning to the long-term leverage equation, the only variable identified to have an effect is liquidity, with a negative effect. The total leverage model mimics that of the short-term leverage model. Therefore, it can be concluded that the effects observed in the total leverage model are driven by the effects in the short-term equation regarding the moderating factors ().
Table 7. Capital structure equations.
Conclusions
This study investigates the relationship between performance in terms of firm efficiency and firm leverage levels for Mediterranean aquaculture production firms. Firm level efficiency is determined using a stochastic frontier production function. The multilevel internal instrument variable approach is then employed to identify the causal relationships between performance and leverage.
Overall, the results from our analysis show that technical efficiency has been increasing across all firms over the period 2008–2016. After the crises in the sector at the beginning of 2000 due to increased supply and falling prices and the financial crises in 2008, Mediterranean aquaculture firms seems to be on a path to improving their economic performance (Llorente et al., Citation2020; Nielsen et al., Citation2021; STECF, Citation2018). One of the reasons for this improvement is that firms are increasing farm size, engaging in mergers and vertical integrations to exploit economies of scale (Fernández-Polanco et al., Citation2021; Guillen et al., Citation2019; Llorente et al., Citation2020; Rad & Köksal, Citation2000; Rad, Citation2007; STECF, Citation2014; Wagner & Young, Citation2009).
Despite improved efficiency the results have shown that there is still room for improved technical efficiency in the production of seabream and seabass. The optimization of the operational scale is one driver to increase efficiency, but requiring new investments (Nielsen et al., Citation2021). Therefore, it is important to extend the knowledge about how the financing structure affects the efficiency and performance of companies, as has been done successfully in other industries such as salmon.
Our results confirm that the agency-cost hypothesis holds in Mediterranean aquaculture sector, such that leverage has an inverted U-shaped relationship with performance. This implies that leverage increase with efficiency, but efficiency begins to decrease at sufficiently high levels of leverage. This is in line with the results in Llorente et al. (Citation2020), who observed that firms with the highest leverage did not get the highest return on equity. Increasing profit margin and liquidity significantly improve aquaculture firm’s efficiency, whereas risk and investments show no significant effects on firm performance. In aquaculture, a large proportion of capital is bound within the standing biomass compared to other physical equipment (Asche & Bjørndal, Citation2011). If firms have a high level of leverage it might increase the pressure on delivering short-term economic results to leverage holders. This in turn forces these firms to harvest before the fish reaches the economically optimal size (receive lower prices). This pressure to obtain liquidity in the short term, generated by debt, can be partly explanation of oversupply situations that cause price drops scenarios. Despite declining prices, companies may be forced to market the product to obtain liquidity. Instead of keeping biomass in cages expecting more favorable market conditions, they may need to sell the product, even when prices threaten the profitability of the activity. Firms with lower level of leverage may experience less pressure and have more flexibility to wait for the optimal harvest time. Thus, an optimal balancing of leverage levels could in turn reflect positively on profit margins and liquidity, which would improve firm efficiency according to our results.
The markets for fish products are highly competitive (Anderson et al., Citation2018) and the supply of aquaculture products are increasing continuously (FAO, Citation2020), especially from low cost countries outside of the EU (FAO, Citation2020). The knowledge that the balancing of leverage can help reduce firm inefficiency could increase profitability in the European aquaculture sector. Using this new tool, the sector could also obtain more robustness to withstand future economic shocks.
Acknowledgments
The authors would like to thank the MedAID (Mediterranean Aquaculture Integrated Development) project, under which this research was conducted.
Additional information
Funding
Notes
1 Multilevel models are also called random effects, mixed effects, hierarchical models.
2 NACE Rev.2 is the Statistical classification of economic activities in the European Community. Section A contains the economic activities related to agriculture, forestry and fishing. Group 03.2 corresponds to “Aquaculture”, i.e., the production process involving the culturing or farming of aquatic organisms.
3 In the Orbis database, Turkish and Greek company accounts do not contain the variables “material cost” (Material) and “cost of employees” (Labour), except for two Greek firms. Thus, only firms reporting these data are included in the analysis.
4 Using revenue as output is common in economic modelling (Malikov & Lien, Citation2021) and in addition a number of studies shows that the law of one price (LOP) holds at the producer and trade level, implying that aggregation can be conducted (Asche et al., Citation1999)
5 When estimating efficiency, using variables on cost and revenue, economic efficiency is estimated. This is different from estimating technical efficiency using physical inputs and outputs.
References
- Anderson, J. L., Asche, F., & Garlock, T. (2018). Globalization and commoditization: The transformation of the seafood market. Journal of Commodity Markets, 12, 2–8. https://doi.org/https://doi.org/10.1016/j.jcomm.2017.12.004
- Aponte, F. R. (2020). Firm dispersion and total factor productivity: Are Norwegian salmon producers less efficient over time? Aquaculture Economics & Management, 24(2), 161–180. https://doi.org/https://doi.org/10.1080/13657305.2019.1677803
- Aponte, F. R., & Tveteras, S. (2019). On the drivers of cost changes in the Norwegian salmon aquaculture sector: A decomposition of a flexible cost function from 2001 to 2014. Aquaculture Economics and Management, 23(3), 276–291.
- Asche, F., & Bjørndal, T. (2011). The economics of salmon aquaculture. Wiley-Blackwell.
- Asche, F., Bremnes, H., & Wessells, C. R. (1999). Product aggregation, market integration, and relationships between prices: An application to the world salmon markets. American Journal of Agricultural Economics, 81(3), 568–581. https://doi.org/https://doi.org/10.2307/1244016
- Asche, F., Guttormsen, A. G., & Nielsen, R. (2013). Future challenges for the maturing Norwegian salmon aquaculture industry: An analysis of total factor productivity change from 1996 to 2008. Aquaculture, 396–399, 43–50. https://doi.org/https://doi.org/10.1016/j.aquaculture.2013.02.015
- Asche, F., Roll, K. H., Sandvold, H. N., Sørvig, A., & Zhang, D. (2013). Salmon aquaculture: Larger companies and increased production. Aquaculture Economics & Management, 17(3), 322–339. https://doi.org/https://doi.org/10.1080/13657305.2013.812156
- Asche, F. (2008). Farming the sea. Marine Resource Economics, 23(4), 527–547. https://doi.org/https://doi.org/10.1086/mre.23.4.42629678
- Asche, F., Roll, K. H., & Tveterås, R. (2016). Profiting from agglomeration? Evidence from the salmon aquaculture industry. Regional Studies, 50(10), 1742–1754. https://doi.org/https://doi.org/10.1080/00343404.2015.1055460
- Asche, F., Sikveland, M., & Zhang, D. (2018). Profitability in Norwegian salmon farming: The impact of firm size and price variability. Aquaculture Economics & Management, 22(3), 306–317. https://doi.org/https://doi.org/10.1080/13657305.2018.1385659
- Battese, G. E., & Coelli, T. J. (1992). Frontier production functions, technical efficiency and panel data: With application to paddy farmers in India. Journal of Productivity Analysis, 3(1–2), 153–169. https://doi.org/https://doi.org/10.1007/BF00158774
- Berger, A. N., & Di Patti, E. B. (2006). Capital structure and firm performance: A new approach to testing agency theory and an application to the banking industry. Journal of Banking & Finance, 30(4), 1065–1102. https://doi.org/https://doi.org/10.1016/j.jbankfin.2005.05.015
- Bergesen, O., & Tveterås, R. (2019). Innovation in seafood value chains: The case of Norway. Aquaculture Economics & Management, 23 (3), 292–320. https://doi.org/https://doi.org/10.1080/13657305.2019.1632391
- Cidad, M., Peral, I., Ramos, S., Basurco, B., Lopez-Francos, A., Muniesa, A., Cavallo, M., Perez, J., Aguilera, C., Furones, D., Reverte, C., Sanjuan-Vilaplana, A., Brun, E., Jansen, M. D., Tavornpanich, S., Raux, P., Baraibar, E., Cobo, A., Fernandez-Polanco, J. M., & Komen, H. (2018). Assessment of Mediterranean aquaculture sustainability. Deliverable 1.2 of the Horizon 2020 project MedAID (GA number 727315), published in the project web site on 21.12.2018. http://www.medaid-h2020.eu/index.php/deliverables/
- Dahl, R. E., Oglend, A., & Yahya, M. (2021). Salmon stock market prices revealing salmon price information. Marine Resource Economics, 36(2), 173–190. https://doi.org/https://doi.org/10.1086/713769
- Degryse, H., Goeij, P. D., & Kappert, P. (2012). The impact of firm and industry characteristics on small firms’ capital structure. Small Business Economics, 38(4), 431–447. https://doi.org/https://doi.org/10.1007/s11187-010-9281-8
- Ebbes, P., Wedel, M., Böckenholt, U., & Steerneman, T. (2005). Solving and testing for regressor-error (in) dependence when no instrumental variables are available: With new evidence for the effect of education on income. Quantitative Marketing and Economics, 3(4), 365–392. https://doi.org/https://doi.org/10.1007/s11129-005-1177-6
- Fernández-Sánchez, J. L., Llorente García, I., & Luna, M. (2020). Technical efficiency of sea bass and sea bream farming in the Mediterranean Sea by European firms: A stochastic production frontier (SPF) approach. Aquaculture Economics & Management, 24(4), 526–514. https://doi.org/https://doi.org/10.1080/13657305.2020.1840660
- Jensen, M. C., & Meckling, W. H. (1976). Theory of the firm: Managerial behavior, agency costs and ownership structure. Journal of Financial Economics, 3(4), 305–360. https://doi.org/https://doi.org/10.1016/0304-405X(76)90026-X
- FAO. (2020). Fisheries and aquaculture information and statistics branch. FAO.
- Fernández-Polanco, J., Llorente, I., & Asche, F. (2021). Gilthead seabream price dynamics in the Spanish market: The role of retailers and international trade on price linkages. Aquaculture, 530, 735801. https://doi.org/https://doi.org/10.1016/j.aquaculture.2020.735801
- Garlock, T., Asche, F., Anderson, J., Bjørndal, T., Kumar, G., Lorenzen, K., Ropicki, A., Smith, M. D., & Tveterås, R. (2020). A global blue revolution: Aquaculture growth across regions, species, and countries. Reviews in Fisheries Science & Aquaculture, 28(1), 107–116. https://doi.org/https://doi.org/10.1080/23308249.2019.1678111
- Guillen, J., Asche, F., Carvalho, N., Fernández Polanco, J. M., Llorente, I., Nielsen, R., Nielsen, M., & Villasante, S. (2019). Aquaculture subsidies in the European Union: Evolution, impact and future potential for growth. Marine Policy, 104, 19–28. https://doi.org/https://doi.org/10.1016/j.marpol.2019.02.045
- Hausman, J. A. (1978). Specification tests in econometrics. Econometrica, 46(6), 1251–1271. https://doi.org/https://doi.org/10.2307/1913827
- Hukom, V., Nielsen, R., & Nielsen, M. (2021). Effects of co-management on technical efficiency and environmental stressors: An application to small-scale shrimp polyculture in Indonesia. Aquaculture Economics & Management, 1–20. https://doi.org/https://doi.org/10.1080/13657305.2021.1897190
- Hukom, V., Nielsen, R., Asmild, M., & Nielsen, M. (2020). Do aquaculture farmers have an incentive to maintain good water quality? The case of small-scale shrimp farming in Indonesia. Ecological Economics, 176, 106717. https://doi.org/https://doi.org/10.1016/j.ecolecon.2020 https://doi.org/https://doi.org/10.1016/j.ecolecon.2020.106717
- Iliyasu, A., Mohamed, Z. A., Ismail, M. M., Abdullah, A. M., Kamarudin, S. M., & Mazuki, H. (2014). A review of production frontier research in aquaculture (2001–2011). Aquaculture Economics & Management, 18(3), 221–247. https://doi.org/https://doi.org/10.1080/13657305.2014.926464
- Karagiannis, G., Katranidis, S. D., & Tzouvelekas, V. (2000). Measuring technical, allocative and cost efficiencies of seabass and seabream farms in Greece. Aquaculture Economics & Management, 4(3–4), 191–207. https://doi.org/https://doi.org/10.1080/13657300009380269
- Karagiannis, G., & Katranidis, S. D. (2000). A production function analysis of seabass and seabream production in Greece. World Aquaculture Society, 31(3), 297–305.
- Karagiannis, G., Katranidis, S. D., & Tzouvelekas, V. (2002). Measuring and attributing technical inefficiencies of seabass and seabream production in Greece. Applied Economics Letters, 9(8), 519–522. https://doi.org/https://doi.org/10.1080/13504850110099293
- Khan, M. A., Begum, R., Nielsen, R., & Hoff, A. (2021). Production risk, technical efficiency, and input use nexus: Lessons from Bangladesh aquaculture. Journal of the World Aquaculture Society, 52(1), 57–72. https://doi.org/https://doi.org/10.1111/jwas.12767
- Kim, J.-S., & Frees, E. W. (2007). Multilevel modeling with correlated effects. Psychometrika, 72(4), 505–533. https://doi.org/https://doi.org/10.1007/s11336-007-9008-1
- Kumar, G., & Engle, C. R. (2016). Technological advances that led to growth of shrimp, salmon, and tilapia farming. Reviews in Fisheries Science & Aquaculture, 24(2), 136–152. https://doi.org/https://doi.org/10.1080/23308249.2015.1112357
- Kvaløy, O., & Tveterås, R. (2008). Cost structure and vertical integration between farming and processing. Journal of Agricultural Economics, 59(2), 296–311. https://doi.org/https://doi.org/10.1111/j.1477-9552.2007.00149.x
- Le, T. P. V., & Phan, T. B. N. (2017). Capital structure and firm performance: Empirical evidence from a small transition country. Research in International Business and Finance, 42, 710–726. https://doi.org/https://doi.org/10.1016/j.ribaf.2017.07.012
- Lewbel, A. (1997). Constructing instruments for regressions with measurement error when no additional data are available, with an application to patents and R&D. Econometrica, 65(5), 1201–1213. https://doi.org/https://doi.org/10.2307/2171884
- Lewbel, A. (2012). Using heteroscedasticity to identify and estimate mismeasured and endogenous regressor models. Journal of Business & Economic Statistics, 30(1), 67–80. https://doi.org/https://doi.org/10.1080/07350015.2012.643126
- Lindblom, T., Sandahl, G., & Sjogren, S. (2011). Capital structure choices. International Journal of Banking, Accounting and Finance, 3(1), 4. https://doi.org/https://doi.org/10.1504/IJBAAF.2011.039369
- Long, L. K., Thap, L. V., Hoai, N. T., & Pham, T. T. T. (2020). Data f tyt u8ec vcnvelopment analysis for analyzing technical efficiency in aquaculture: The bootstrap methods. Aquaculture Economics & Management, 24(4), 422–446. https://doi.org/https://doi.org/10.1080/13657305.2019.1710876
- Llorente, I., & Luna, L. (2014). Economic optimisation in seabream (Sparus aurata) aquaculture production using a particle swarm optimisation algorithm. Aquaculture International, 22(6), 1837–1849. https://doi.org/https://doi.org/10.1007/s10499-014-9786-2
- Llorente, I., Fernández-Polanco, J., Baraibar-Diez, L., Odriozola, M. D., Bjørndal, T., Asche, F., Guillen, J., Avdelas, L., Nielsen, R., Cozzolino, M., Luna, M., Fernández-Sánchez, J. L., Luna, L., Aguilera, C., & Basurco, B. (2020). Assessment of the economic performance of the seabream and seabass aquaculture industry in the European Union. Marine Policy, 117, 103876. https://doi.org/https://doi.org/10.1016/j.marpol.2020.103876
- Malikov, E., & Lien, G. (2021). Proxy variable estimation of multiproduct production functions. American Journal of Agricultural Economics, 103(5), 1878–1902. https://doi.org/https://doi.org/10.1111/ajae.12215
- Margaritis, D., & Psillaki, M. (2010). Capital structure, equity ownership and firm performance. Journal of Banking & Finance, 34(3), 621–632. https://doi.org/https://doi.org/10.1016/j.jbankfin.2009.08.023
- Mitra, S., Khan, M. A., & Nielsen, R. (2019). Credit constraints and aquaculture productivity. Aquaculture Economics & Management, 23(4), 410–427. https://doi.org/https://doi.org/10.1080/13657305.2019.1641571
- Mitra, S., Khan, M. A., Nielsen, R., & Islam, N. (2020). Total factor productivity and technical efficiency differences of aquaculture farmers in Bangladesh: Do environmental characteristics matter? Journal of the World Aquaculture Society, 51(4), 918–930. https://doi.org/https://doi.org/10.1111/jwas.12666
- Misund, B., & Nygård, R. (2018). Big fish: Valuation of the world’s largest salmon farming companies. Marine Resource Economics, 33(3), 245–261. https://doi.org/https://doi.org/10.1086/698447
- Modigliani, F., & Miller, M. H. (1959). The cost of capital, corporation finance, and the theory of investment: Reply. The American Economic Review, 49(4), 655–669.
- Myers, S. C. (1977). Determinants of corporate borrowing. Journal of Financial Economics, 5(2), 147–175. https://doi.org/https://doi.org/10.1016/0304-405X(77)90015-0
- Myers, S. C. (2001). Capital structure. Journal of Economic Perspectives, 15(2), 81–102. https://doi.org/https://doi.org/10.1257/jep.15.2.81
- Nielsen, R., Ankamah-Yeboah, I., & Llorente, I. (2021). Technical efficiency and environmental impact of seabream and seabass farms. Aquaculture Economics & Management, 25(1), 106–125. https://doi.org/https://doi.org/10.1080/13657305.2020.1840662
- Nilsen, O. B. (2010). Learning-by-doing or technological leapfrogging: Production frontiers and efficiency measurement in Norwegian salmon aquaculture. Aquaculture Economics & Management, 14(2), 97–119. https://doi.org/https://doi.org/10.1080/13657301003776649
- Nygård, R. (2020). Trends in environmental CSR at the Oslo Seafood Index: A market value approach. Aquaculture Economics & Management, 24(2), 194–211. https://doi.org/https://doi.org/10.1080/13657305.2019.1708996
- Orbis. (2018). A database of comparable financial information for companies across the globe. http://www.bvdinfo.com. Bureau Van Dijk.
- O’Brien, J. P. (2003). The capital structure implications of pursuing a strategy of innovation. Strategic Management Journal, 24(5), 415–431. https://doi.org/https://doi.org/10.1002/smj.308
- Park, S., & Gupta, S. (2012). Handling endogenous regressors by joint estimation using copulas. Marketing Science, 31(4), 567–586. https://doi.org/https://doi.org/10.1287/mksc.1120.0718
- Pitt, M. M., & Lee, L.-F. (1981). The measurement and sources of technical inefficiency in the Indonesian weaving industry. Journal of Development Economics, 9(1), 43–64. https://doi.org/https://doi.org/10.1016/0304-3878(81)90004-3
- Rad, F., & Köksal, G. (2000). An overview of aquaculture in Turkey: With emphasis on sea bass and sea bream. Aquaculture Economics & Management, 4(3–4), 227–239. https://doi.org/https://doi.org/10.1080/13657300009380271
- Rad, F. (2007). Evaluation of the sea bass and sea bream industry in the Mediterranean, with emphasis on Turkey. In P. Leung, C.-S. Lee, & P. J. O’Bryen (Eds.), Species and system selection for sustainable aquaculture. Blackwell Publishing.
- Rahman, M. T., Nielsen, R., & Khan, M. A. (2021). Pond aquaculture performance over time: A perspective of small-scale extensive pond farming in Bangladesh. Aquaculture Economics & Management. https://doi.org/https://doi.org/10.1080/13657305.2021.1979122
- Rahman, M. T., Nielsen, R., & Khan, M. A. (2019). Agglomeration externalities and technical efficiency: An empirical application to the pond aquaculture of Pangas and Tilapia in Bangladesh. Aquaculture Economics & Management, 23(2), 158–187. https://doi.org/https://doi.org/10.1080/13657305.2018.1531948
- Rahman, M. T., Nielsen, R., Khan, M. A., & Asmild, M. (2019). Efficiency and production environmental heterogeneity in aquaculture: A meta-frontier DEA approach. Aquaculture, 509, 140–148. https://doi.org/https://doi.org/10.1016/j.aquaculture.2019.05.002
- See, K. F., Ibrahim, R. A., & Goh, K. H. (2021). Aquaculture efficiency and productivity: A comprehensive review and bibliometric analysis. Aquaculture, 544, 736881. https://doi.org/https://doi.org/10.1016/j.aquaculture.2021.736881
- Sharma, K. R., & Leung, R. S. (2003). A review if production frontier analysis for aquaculture management. Aquaculture Economics & Management, 7(1–2), 15–34. https://doi.org/https://doi.org/10.1080/13657300309380329
- STECF. (2014). The economic performance of the EU aquaculture sector (STECF 1418) (p. 451). Luxembourg: Publications Office of the European Union. EUR 27033 EN, JRC 93169.
- STECF. (2016). Scientific, technical and economic committee for fisheries (STECF) – Economic report of the EU aquaculture sector (EWG-16-12). Luxembourg: Publications Office of the European Union. EUR 28356 EN. https://doi.org/https://doi.org/10.2788/677322
- STECF. (2018). Scientific, technical and economic committee for fisheries (STECF) – Economic report of the EU aquaculture sector (STECF-18-19). Luxembourg: Publications Office of the European Union. https://doi.org/https://doi.org/10.2760/45076, JRC114801.
- Stulz, R. (1990). Managerial discretion and optimal financing policies. Journal of Financial Economics, 26(1), 3–27. https://doi.org/https://doi.org/10.1016/0304-405X(90)90011-N
- Tveteras, R. (2002). Industrial agglomeration and production costs in Norwegian salmon aquaculture. Marine Resource Economics, 17(1), 1–22. https://doi.org/https://doi.org/10.1086/mre.17.1.42629345
- Wagner, B. A., & Young, J. A. (2009). Seabass and seabream farmed in the Mediterranean: Swimming against the tide of market orientation. Supply Chain Management: An International Journal, 14(6), 435–446. https://doi.org/https://doi.org/10.1108/13598540910995219