
 ?Mathematical formulae have been encoded as MathML and are displayed in this HTML version using MathJax in order to improve their display. Uncheck the box to turn MathJax off. This feature requires Javascript. Click on a formula to zoom.
Abstract
The aim of this work is to evaluate how changes in a set of different key operational factors (e.g., the unit sales price, the fingerling unit cost, the feed unit cost, and so on) would impact on the economic performance of a typical grow-out farm producing European sea bass in the Mediterranean under different scenarios of production related to the farm size (production volume) and production strategy (size of the produced fish). A what-if analysis using a deterministic static model to simulate the annual income statement of a typical grow-out farm was carried out. Data was obtained from ten European facilities located in the Mediterranean Sea. Our findings show the importance of the farm’s scale and the production of larger fish to obtain better economic results. Another important conclusion is that increase in fish growth and survival rates, innovating in feed and improving the breeding and health conditions, could compensate the reductions in the sea bass sales prices more efficiently than using other alternatives.
Introduction
European sea bass (Dicentrarchus labrax) is one of the most important species in Mediterranean aquaculture. The culture of sea bass represented in the year 2018 approximately 20% (US$662 million) of the total value of the European aquaculture, ranking the second species in the EU aquaculture industry in terms of value after the Atlantic salmon (STECF, Citation2021). Moreover, the EU is one of the largest producers of farmed sea bass with a 50% value share of the world production, being Greece the largest producer within the EU followed by Spain (STECF, Citation2021).
Traditionally, sea bass has been farmed extensively in coastal lagoons in northern Italy (vallicultura) and brackish ponds in southern Portugal and Spain (esteros), where fish are allowed to enter inside the lagoons and ponds to be trapped and fed naturally until they are harvested (EU, Citation2012), although only a few farms still use these traditional methods to grow fish. In the 1990s, new technology allowed the cage culture in Spain, France, and Italy, being most of the products produced nowadays at industrial scale in floating cages in the sea.
Sea bass aquaculture is an industry with keen competition in which profitability of operations is very sensitive to different factors. During the 1990s, high market prices allowed the companies in the industry to obtain positive economic returns. At the beginning of the 2000s, entry of new companies increased total production leading to reduced prices and firms’ margins. Over the years, periods of oversupply and price drops in the market have followed one another, always with the same profitability challenges for companies. As consequence, several medium and small companies collapsed, while other companies started a consolidation process to achieve economies of scale and reduce average production costs (Fernández-Polanco and Llorente, Citation2019). Another solution for the profitability problem of companies in the industry has been to change business strategies to sell more volume and/or to increase quality to obtain higher prices (e.g., producing larger fish).Footnote1
The economic performance of the sea bass industry presents over time, and between countries, many variations which may be related to the heterogeneity of production facilities and their business strategies (Llorente et al., Citation2020). Even though there is a general tendency toward larger firms and a higher degree of integration, companies also tend to specialize in different business models by levels of production and product strategies.Footnote2 Aguilera et al. (Citation2019) analyze the structure of the Mediterranean marine fish farming sector and show that there is an important heterogeneity of farms and companies throughout the Mediterranean. Hence, the variation of firms’ operating profits and margins cannot be explained only by changes in the market sales prices, but also by other operational factors related to the sea bass production such as the cost of fingerlings, the cost of feed, and so on (Di Trapani et al., Citation2014).
Despite their importance, there is a scarcity of empirical work on this topic. Rizzo and Spagnolo (Citation1996) were the first authors who proposed a model for the simulation and optimization of sea bass aquaculture plants to analyze the economic impact of changes in different operational factors. More recently, several studies have analyzed this topic, but limited to the effect of one specific operational variable. Di Trapani et al. (Citation2014) compared the financial differences of producing sea bass in Italy depending on where the productive facility is located (inshore or offshore). On the other hand, Baki and Yücel (Citation2017) evaluated the economic weight of feed costs in sea bass aquaculture using data from one Turkish company, whereas Arru et al. (Citation2019) analyzed the economic impact of changes in the diet of European sea bass employing the case analysis of a small-sized farm. However, none of these studies have considered different scenarios of production that can moderate the effect of operational factors.
The aim of this work is to evaluate how changes in a set of key operational factors would impact the economic performance of a typical grow-out farm producing European sea bass in the Mediterranean under different scenarios of production related to the farm size (production volume) and production strategy (size of the produced fish). This analysis is important to improve the production efficiency and profitability of this industry since there is still room for its improvement (Fernández Sánchez et al., Citation2020; Nielsen et al., Citation2021). The salmon, shrimp and tilapia industries are good examples of how improvements in fish feeding or fish breeding and health have promoted their production productivity (Asche, Citation2008; Kumar and Engle, Citation2016). In addition, this analysis can be very useful for sea bass producers and policymakers to elaborate business plans and take more appropriate managerial decisions considering different scenarios of production.
To carry out this work, we propose a model to simulate the annual income statement of a typical grow-out farm adjusted to different scenarios of production. This model estimates the operating revenues obtained by the harvesting and sale of adult fish as well as the operating costs of sea bass production and commercialization. Estimations obtained with this model are then used to evaluate, through a what-if analysis, the economic impact of changes in some of the operational parameters.
The structure of this work is as follows. First, we explain the model and the assumptions that we have set up, as well as the values of the model parameters and the scenarios of production used to obtain the baseline values for our analysis. In the following section, we present and discuss the results obtained with the model and the what-if analysis. Finally, in the last section, we present the main conclusions of our work.
Method
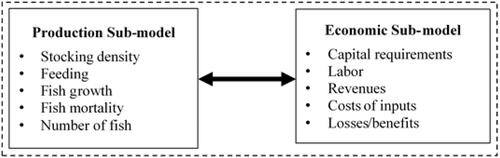
We have designed a deterministic static model programmed with the spreadsheet Excel (version 16.0) to simulate the annual income statement of different European grow-out farm typologies producing European sea bass in the Mediterranean Sea. This model, which is based on the work of Bjørndal (Citation1988), Rizzo and Spagnolo (Citation1996), Cacho (Citation1997), Gasca-Leyva et al. (Citation2002), Pomeroy et al. (Citation2008), Di Trapani et al. (Citation2014), Janssen et al. (Citation2017) and Arru et al. (Citation2019), is composed of two sub-models: a production sub-model with different parameters and variables related with the production process (e.g., stocking density, feeding, fish growth, fish mortality, etc.), and an economic sub-model with parameters and variables related with the economic issues of operating an aquaculture farm (e.g., capital requirements, labor, revenues, costs of inputs, and so on). Our model does not include biological or environmental sub-models as other more complex models do (e.g., bio-economic or system dynamic models) since the aim of our model is not to optimize a farm’s production process. Specifically, the purpose of our model is to simulate the economic performance of a typical farm and to examine how the variations in some operational key parameters (e.g., the unit sales price, the fingerling unit cost, the feed unit cost, and so on) impact on it under different scenarios of farm size (production volume) and production strategy (size of the produced fish) ().
Figure 1. Model framework to simulate the economic performance of sea bass production.
Model description and assumptions
Our aim was to build a model to simulate the operations of a typical grow-out farm during a regular year to estimate its annual net operating profit. This facility employs the production system based on sea-cages and we assume that the production process is continuous with multiple batches (i.e., the fry stocking and fish harvest of is repeated with similar frequency), so that the distribution of the economic variables (prices and costs) and production variables (stocking, feeding, and harvesting) are assumed constant during repeated production cycles. We also assume that limiting factors of production are specific farming conditions (e.g., water temperature or mortality rates) and practices (e.g., selection of fingerling size, stocking density, feed composition or feeding regime), and they are considered fixed and appropriate (optimal) along the production process, so that fry stocking and fish harvesting are unaffected by them.
The annual net operating profit (π) of a sea bass grow-out facility with a continuous production system can be obtained by subtracting the annual total operating costs (TC) from the annual operating revenues (TR) obtained from the fish sales, such as:
(1)
(1)
The annual operating revenues from fish sales were calculated as follows:
(2)
(2)
where TR is the annual operating revenues (€/year); p is the unit sales price of fish (€/kg); and Q equals the annual biomass of fish produced (kg/year). We assume that the harvested fish exhibit homogeneous genetic behavior and weight distribution (no malformations), as well as the harvested biomasses can be sold to a price p independent of the fish supplied. Moreover, the annual biomass of fish produced in each facility can be calculated in the following way:
(3)
(3)
where N is the annual quantity of cultured fish (# units/year); s is the fish survival rate (%); and w1 is the fish final weight (g/unit). The annual quantity of cultured fish can be obtained using the following expression:
(4)
(4)
where d is the fish density per cage (# units/cage); c is the total cages in the facility (# cages); and T equals the production period (# months). This production period has been obtained as follows:
(5)
(5)
where w1 is the fish final weight (g/unit); w0 is the fish initial weight (g/unit); and g is the fish absolute growth rate (g/month).
On the other hand, the total operating cost per year of a grow-out farm is given by the sum of its variable and fixed costs in the period. Fingerling and feed costs are considered variable costs, assuming that these costs are proportional to sea bass production, whereas it is supposed that the remaining operating costs are fixed (see ).Footnote3 In this model we have not included the financial costs (cost of capital) and the corporate taxes to the operating costs to avoid the problems arising from the use of different financial and taxation policies followed in different geographical areas.
Table 1. Annual operating costs of a grow-out farm.a
Dividing the annual operating profit (π) and the total operating cost (TC) between the annual biomass of fish produced in the period (Q), we can obtain respectively the average operating profit () as well as the average operating cost (AC) to produce and sell a kilogram of fish.
In addition, the break-even point of each facility (Q0), which is the level of activity (kilograms of fish produced in each period) in which a firm or farm begins to obtain profits, was calculated as follows:
(6)
(6)
where FC is the annual fixed costs (€/year) and VC the annual variable costs (€/year). With the farm’s break-even point, we have also obtained the margin of safety (MOS), which is the difference between the actual sales and the break-even sales of a firm or farm. It can be also expressed in the form of ratio, which is calculated by using the following formula:
(7)
(7)
so that the larger is the ratio the lesser is the risk in reaching the breakeven point and the risk of business to have losses. It is an important figure for any business because it tells managers how much reduction in revenue will result in break-even serving as a measure of operating risk (Weygandt et al., Citation1999).
Parameter values and scenarios
Once the model has been designed and the work assumptions have been set up, the next stage to conduct the simulation analysis is to hypothesize about the values of model parameters as well as to set up the different scenarios of production. To estimate appropriate parameter values, we have obtained data of a sample of ten grow-out facilities from a representative group of European firms producing sea bass in the Mediterranean Sea (five from Croatia, three from Spain, one from Italy, and one from Cyprus). The period used to estimate the parameters values ranges from 2015 to 2017.
On the other hand, we have considered different assumptions regarding the farm size, i.e., annual production volume (see ), and production strategy, i.e., size of produced fish (see ), so that we have contemplated nine different scenarios (farm typologies) for our analysis. Looking at , we assume that the annual production for a micro-sized farm would be around 180 tons using 12 cages of 1,000 m3 (each cage would have approximately 15 m of diameter and 4 m deep) and having a biomass density of 15 kg/m3 in each one. Regarding the small-sized farm, we assume that the annual production is around 540 tons using 18 cages of 2,000 m3 (each cage would have approximately 22 m of diameter and 6 m deep) and having a biomass density of 15 kg/m3. Finally, we assume that the annual production for a medium-large-sized farm is around 2,250 tons using 40 cages of 3,750 m3 (each cage would have approximately 25 m of diameter and 8 m deep) and having a biomass density of 15 kg/m3. To facilitate the comparison, we have assumed that all operating costs per cage are the same for all facilities (average values obtained from our sample of farms). Thus, the labor cost per employee is 16,440 €/year and the number of employees employed in each facility is 0.8 workers per installed cage. We also assume that there is not any important disease outbreak in the year, so that the regular veterinarian and medicine costs are around 650 €/year. The other operating costs per cage would be around 6,411 €/year and the annual depreciation rate would be 10% with a capital investment of 151,265 €/year per cage.
Table 2. Parameter values depending on the farm size.
Table 3. Parameter values depending on the production strategy.
Looking at , we show the different production strategies that can be employed in the former farms. Thus, each of the former farms can choose to produce and sell different sizes of fish (specifically European sea bass). Strategy 1 is to produce a sea bass of 450 g with a sales price of 5.80 €/kg. We assume an average survival rate in the whole period of production (almost 2 years) of 90%. On the other hand, strategy 2 is to produce a 1-kg sea bass with a sales price of 8.72 €/kg. In this case, we assume an average survival rate in the whole period of production (3 years) of 85%. Finally, strategy 3 is to produce a 2-kg sea bass with a sales price of 11.46 €/kg, although we have also assumed that half of this production would be fished and sold when the fish achieves a weight of one kilogram since it is a habitual practice employed by firms following this production strategy.Footnote4 We assume for this case an average survival rate in the whole period of production (5 years) of 80%. In addition, we have assumed for all cases that the initial weight of fingerlings is 11 g/unit, which are bought to a hatchery or pre-growing external facility at the unit price of 0.31 €/unit. The average feed cost is fixed at 1.05 €/kg, whereas the feed conversion ratio (FCR) is 2.4.
To validate our model, parameters and results were revised by some experts and professionals in sea bass production who verified that these values are close to reality. In addition, we have also compared the relative values of the different operating costs obtained from our model with those from other previous studies (Arru et al., Citation2019; Bozoglu and Ceyhan, Citation2009; Di Trapani et al., Citation2014; Hadelan et al., Citation2012). The relative values obtained with our model are very similar being the feed cost the most important operating cost (a 58.3% on average in our research), whereas the variable operating cost have a value between the 50% and 70% of the farm’s total operating costs (67.7% on average).
Results
Baseline values of economic performance
In , we present the baseline values of the variables employed to measure the economic performance of the nine scenarios proposed for this analysis according to the assumptions set up in and . Looking at the figure, we can observe the scale effect regardless the production strategy. Thus, in a micro-sized farm we can produce a 450 g/fish (strategy 1) with an average operating cost of 5.99 €/kg, whereas this cost is 4.67 €/kg in a small-sized farm and 4.06 €/kg in a medium-large-sized farm. The same effect is obtained with the other production strategies. Further, the difference in the average operating cost between strategy 3 and the other strategies increases according to the farm size, so that the larger the farm, the more important is to choose strategy 3 instead the other production strategies to increase the average net operating profit. Consequently, the best production strategy economically is to culture fish of 2 kilograms (strategy 3) in which we always obtain the largest net operating profit regardless the farm size, since we get higher sales prices and lower operating costs per produced unit.
Figure 2. Economic performance of a typical grow-out farm under different scenarios of production (baseline values).
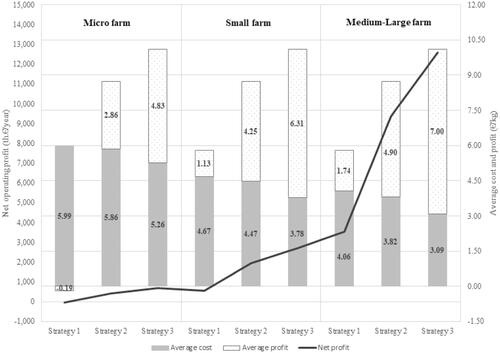
Regarding the operating risk (), the MOS ratio is negative in the micro-sized farms following strategy 1 since their break-even point (174,440 kg/year) is above the level of real production (162,000 kg/year). Therefore, for these farms with a very small yearly production, strategies 2 and 3 would be a better alternative economically since that these farms will obtain net profits and the MOS ratio would be larger (50.7% for strategy 2 and 67.7% for strategy 3) presenting consequently a lower operating risk.
Table 4. Operating risk of a typical grow-out farm under different scenarios of production (baseline values).
Economic impact of changes in model parameters (what-if analysis)
Once the economic baseline values of the typical farm have been obtained, a what-if analysis has been carried out to provide us a more exhaustive economic assessment of the sea bass farming. This analysis involves changing the value of a specific parameter to test its impact on the model variables used to measure the farm’s economic performance. Specifically, we have examined the economic impact on the net operating profit of changes in the baseline values of some operational parameters such as the unit sales price, the survival rate, the growth rate, the fingerling unit cost, the feed unit cost, or the feed conversion ratio (FCR) because of their importance in the production and commercialization process (see ). Each of these model parameters has been varied one by one maintaining the rest of parameters constant (ceteris paribus) by 10% above or below its baseline value.
Table 5. Variation in the net operating profit caused by a change of ±10% in some key operational parameters.
The what-if analysis has demonstrated that the unit sales price (p) is the model parameter with the largest impact on the net operating profit for all scenarios, so that a 10% of reduction in the price will reduce the net operating profit more than every other model parameter regardless the farm size and production strategy. The following model parameters with a significant impact on the farm’s net operating profit are the survival (s) and growth (g) rates (for strategy 1 the survival rate has more impact on it than the growth rate, whereas for strategies 2 and 3 the growth rate is more important), which effect is high and close to the effect of price. On the other hand, the fingerling unit cost (pj) is the model parameter with the lowest impact on the net operating profit regardless the farm size and production strategy.
To introduce the effect of parameter uncertainty in the former analysis, we present in the results about how many units of each model parameter are necessary to obtain a null net operating profit (i.e., we obtain the break-even values of each parameter). According to our findings, the production of 450-g fish (strategy 1) is the worst strategy of production for all parameters regardless the farm size since with this strategy is necessary to fix the higher price, survival rate and growth rate to compensate the farm’s operating costs as well as the lower fingerling unit cost, feed unit cost and FCR to have the lowest operating costs and get positive operating profits. By contrast, in small and medium-large-sized farms the production of 2-kg fish (strategy 3) is the best strategy of production for all parameters. In a micro-sized farm, the production of 1-kg fish (strategy 2) is the best considering only the price parameter, whereas strategy 3 is the best with the rest of parameters. Hence, this analysis confirms the results obtained with the what-if analysis about which scenario of production is the best for economic performance regardless the value employed for each model parameter.
Table 6. Parameters values to achieve a null net operating profit (break-even values).
To improve the what-if analysis, we show in how many units of each model parameter are necessary to compensate a reduction of 10% in the unit sales price. The results show that a reduction in the fingerling unit cost (pj) is not possible to compensate a reduction of 10% in the unit sales price because in this case the cost of the fingerlings would be out the market clearly (pj with negative values or values close to zero). A reduction in the feed unit cost (pf) is also a very unrealistic alternative because farms would have to buy feed, in the highest option (strategy 1), paying around 0.82 €/kg what is far of the market prices nowadays (over 0.90 €/kg). We obtain similar results whether we decide to improve the feed conversion ratio (FCR) since the values presented in are very far from the actual values of production. Thus, we would have to reduce the FCR from 2.4 to 1.9 (i.e., a 21% of reduction) in the case of the best alternative (strategy 1). In the case of the other production strategies (2 and 3), the FCR reduction would have to be larger. Therefore, the best alternatives that we can get would be when farms try to improve their growth and survival rates. Thus, we need an improvement of 2.19 g/month (an increase of 12%) for strategy 1 regardless of the farm size to compensate the reduction of the sea bass market price from 5.80 to 5.22 €/kg. For strategies 2 and 3, it would be necessary an improvement of 3.02 and 3.63 g/month respectively (an increase of 11% in both cases). In the case of an improvement in the survival rate, this option is not possible for strategy 1 since the new values would be over 100%, whereas for strategies 2 and 3 it would be possible if we can reduce the farm’s mortality 11.23 and 10.13 percentage points respectively. Obviously, a reduction in both parameters at the same time would require a smaller increase on them to compensate the reduction in the unit sales price.
Table 7. Parameters values to compensate a 10% of decrease in the unit sales price (p).
Discussion and conclusions
An important result of this work is that the annual volume of production (the farm’s scale) is very important in this industry to obtain better economic results. The baseline values of our simulation model show scale effects regardless the production strategy in accordance with the findings obtained in earlier studies (Fernández Sánchez et al., Citation2020; Llorente et al., Citation2020). The same effects have also founded in the salmon aquaculture industry (Asche et al., Citation2013). This result is important because it provides an explanation of the concentration process of this industry in Europe in the last decade (Llorente et al., Citation2020; STECF, Citation2021).
In addition, the production strategy chosen by producers (i.e., size of the produced fish) is an important decision to achieve the farm’s economic sustainability, mainly in the case of the smallest production facilities. Thus, the farm’s economic performance improves the larger the farm and the larger the fish produced. According to our model, the production of 450-g fish is the worst production strategy and the production of 2-kg fish is the best regardless of the farm size. This result serves to validate the strategic decisions taken for some producers in the last years to be more economically sustainable. Even though the production of 450-g fish is usually the strategy preferred by many producers in this industry because it is considered the best alternative to get cash rapidly and have less risk of loss due to an unexpected event (e.g., a disease outbreak, marine storms and so on), our findings show that it is the worst production strategy from an economic point of view assuming a continuous production system with multiple batches along the time.Footnote5 However, credit constraints may be also a challenge as discussed in Mitra et al. (Citation2019).
On the other hand, the what-if analysis has shown how the unit sales price is the model parameter with the largest impact on the net operating profit for all scenarios, so that a 10% of reduction in the price will reduce the net operating profit more than every other model parameter. This result agrees with the negative impact that the different supply crisis, generating deep price reductions in the market, has had historically on firms’ economic performance and shows the need of improving the efficiency in the sector to counteract that negative effect (Fernández Sánchez et al., Citation2020; Nielsen et al., Citation2021). The following model parameters with a significant impact on the farm’s net operating profit are the growth and survival rates, which effect is very high and close to the effect of price. This result confirms the economic importance of fish growth and survival in sea bass farming as recent studies have shown (Besson et al., Citation2016; Kankainen et al., Citation2012). By contrast, the fingerling unit cost is the model parameter with the lowest impact on the net operating profit regardless the farm size and production strategy.
Hence, the improvement of the growth and survival rates of fish would be a very important decision for sea bass producers. For example, innovating in feed nutrition and feeding efficiency, investing in breeding, and improving health management (prevention, vaccination, biosecurity, etc.) could compensate the reductions in the sea bass sales prices more efficiently than using other alternatives. Moreover, the development of models and tools to evaluate the economic impact of disease outbreaks and health programs could also help to improve farms’ efficiency significantly and, consequently, their economic performance given the relevance of fish survival and the scarcity of economic analyses on it. Investing in higher-quality fingerlings could be also a worthy decision since quality is related to higher fish survival and growth rates (e.g., the case of vaccinated fingerlings bought by sea bass producers). The positive effects of this type of innovations on the farm’s productivity have been reported previously in the salmon aquaculture industry (Asche, Citation2008; Kumar and Engle, Citation2016).
Therefore, we can conclude that the improvements of efficiency in the production of sea bass would allow not only the use of fewer resources and a more sustainable production economically, but also the reduction of the exposure that the operating profits and margins have with price volatility.
Acknowledgements
We want to thank to an anonymous reviewer and the journal editor for their helpful and valuable comments.
Disclosure statement
No potential conflict of interest was reported by the author(s).
Additional information
Funding
Notes
1 Unit prices for seafood tend to increase with the size of an individual. Hukom et al. (Citation2020) and Asche et al. (Citation2021) provide two recent examples.
2 The consolidation and increase in firm size can also be found in other aquaculture sectors like salmon (Asche et al., Citation2013).
3 According to Janssen (Citation2019), trends in the increase in productivity per person support the assumption that labor should be treated more as a fixed cost than a variable cost. Moreover, energy costs are to a larger extent determined by the farm layout than by the realized production and, even though the costs of medicines may vary, veterinary costs are likely to be fixed per farm whereby they can be also considered as fixed costs in our model. Other operating costs include a set of miscellaneous expenses from different external services (rents, fees, repairs, transports, etc.).
4 This practice is carried out to increase the efficiency of farm’s resources. Thus, sea bass producers would obtain more annual revenues with the same fixed investments introducing more fingerlings in each cage at the beginning of the production process since there is available space to do it. However, part of this production is sold before reaching a weight of two kilograms because is necessary to leave enough space in the cages and avoid thus density problems that could affect the growth rate and health of fish.
5 Strategy 1 is more liquid with traditional extensive production systems with a simple batch (e.g., production in ponds) because the frequency of seed and harvest is different depending on the strategy of production (size of produced fish). Nevertheless, this is not an advantage for strategy 1 when a continuous production system with multiple batches (e.g., production in marine farms with sea cages) is considered because the process of seed and harvest fish is repeated with similar frequency along the time regardless the production strategy. Even though the risk of loss per unit is clearly lower in strategy 1, the loss by batch or period in a continuous production system is not so clear because it depends on the whole money invested in the batch or period (the weight produced per batch or year is the same regardless the fish size) and how the risk impact in the production process what can be affected by the fish size (e.g., the impact of a disease outbreak is different depending on the fish size, being higher when fish is small).
References
- Aguilera, C., Furones, D., Reverté, C., Sanjuan-Vilaplana, C. A., Basurco, B., López-Francos, A., Llorente, I., & Ramos, S. (2019). Integrated Holistic Assessment of Mediterranean Aquaculture. Horizon 2020 project MedAID, deliverable 1.3. http://www.medaid-h2020.eu/index.php/deliverables/
- Arru, B., Furesi, R., Gasco, L., Madau, F. A., & Pulina, P. (2019). The introduction of insect meal into fish diet: The first economic analysis on European sea bass farming. Sustainability, 11(6), 1697. https://doi.org/https://doi.org/10.3390/su11061697
- Asche, F. (2008). Farming the sea. Marine Resource Economics, 23(4), 527–547. https://doi.org/https://doi.org/10.1086/mre.23.4.42629678
- Asche, F., Bronnmann, J., & Cojocaru, A. L. (2021). The value of responsibly farmed fish: A hedonic price study of ASC-certified whitefish. Ecological Economics, 188, 107135. https://doi.org/https://doi.org/10.1016/j.ecolecon.2021.107135
- Asche, F., Roll, K. H., Sandvold, H. N., Sørvig, A., & Zhang, D. (2013). Salmon aquaculture: Larger companies and increased production. Aquaculture Economics & Management, 17(3), 322–339. https://doi.org/https://doi.org/10.1080/13657305.2013.812156
- Baki, B., & Yücel, S. (2017). Feed cost/production income analysis of seabass (Dicentrarchus labrax) aquaculture. International Journal of Ecosystems and Ecology Sciences, 7(4), 859–864.
- Besson, M., Vandeputte, M., van Arendonk, J. A. M., Aubin, J., de Boer, I. J. M., Quillet, E., & Komen, H. (2016). Influence of water temperature on the economic value of growth rate in fish farming: The case of sea bass (Dicentrarchus labrax) cage farming in the Mediterranean. Aquaculture, 462, 47–55. https://doi.org/https://doi.org/10.1016/j.aquaculture.2016.04.030
- Bjørndal, T. (1988). Optimal harvesting of farmed fish. Marine Resource Economics, 5(2), 139–159. https://doi.org/https://doi.org/10.1086/mre.5.2.42628926
- Bozoglu, M., & Ceyhan, V. (2009). Cost and profitability analysis for trout and sea bass production in the black sea. Turkey. Journal of Animal and Veterinary Advances, 8(2), 217–222.
- Cacho, O. J. (1997). System modelling and bioeconomic modelling in aquaculture. Aquaculture Economics & Management, 1(1–2), 45–64. https://doi.org/https://doi.org/10.1080/13657309709380202
- Di Trapani, A. M., Sgroi, F., Testa, R., & Tudisca, S. (2014). Economic comparison between offshore and inshore aquaculture production systems of European sea bass in Italy. Aquaculture, 434, 334–339. https://doi.org/https://doi.org/10.1016/j.aquaculture.2014.09.001
- EU. (2012). Fisheries and Aquaculture in Europe, No. 59, December. European Commission, DG for Maritime Affairs and Fisheries.
- EUMOFA. (2019). Seabass in the EU. Case study. European Market Observatory for Fisheries and Aquaculture Products.
- FAO. (2010). Report of the FAO workshop on the on-farm feeding and feed management in aquaculture [FAO Fisheries and Aquaculture Report No. 949]. Food and Agriculture Organization of the United Nations.
- Fernández-Polanco, J., & Llorente, I. (2019). Price transmission and market integration: Vertical and horizontal price linkages for gilthead seabream (Sparus aurata) in the Spanish market. Aquaculture, 506, 470–474. https://doi.org/https://doi.org/10.1016/j.aquaculture.2019.03.052
- Fernández Sánchez, J. L., Llorente García, I., & Luna, M. (2020). Technical efficiency of sea bass and sea bream farming in the Mediterranean Sea by European firms: A stochastic production frontier (SPF) approach. Aquaculture Economics & Management, 24(4), 526–539. https://doi.org/https://doi.org/10.1080/13657305.2020.1840660
- Gasca-Leyva, E., León, C. J., Hernández, J. M., & Vergara, J. M. (2002). Bioeconomic analysis of production location of sea bream (Sparus aurata) cultivation. Aquaculture, 213(1–4), 219–232. https://doi.org/https://doi.org/10.1016/S0044-8486(02)00031-5
- Hadelan, L., Par, V., Njavro, M., & Lovrinov, M. (2012). Real option approach to economic analysis of European sea bass (Dicetrarchus labrax) farming in Croatia. Agriculturae Conspectus Scientificus, 77(3), 161–165.
- Hukom, V., Nielsen, M., Ankamah-Yeboah, I., & Nielsen, R. (2020). A hedonic price study on warm- and cold-water shrimp in Danish retail sale. Aquaculture Economics & Management, 24(1), 1–19. https://doi.org/https://doi.org/10.1080/13657305.2019.1669228
- Janssen, K. (2019). The economic optimization of breeding programs in aquaculture [PhD thesis]. Wageningen University.
- Janssen, K., Berentsen, P., Besson, M., & Komen, H. (2017). Derivation of economic values for production traits in aquaculture species. Genetics Selection Evolution, 49(1), 1–13. https://doi.org/https://doi.org/10.1186/s12711-016-0278-x
- Kankainen, M., Setälä, J., Berrill, I. K., Ruohonen, K., Noble, C., & Schneider, O. (2012). How to measure the economic impacts of changes in growth, feed efficiency and survival in aquaculture. Aquaculture Economics & Management, 16(4), 341–364. https://doi.org/https://doi.org/10.1080/13657305.2012.729247
- Kumar, G., & Engle, C. R. (2016). Technological advances that led to growth of shrimp, salmon, and tilapia farming. Reviews in Fisheries Science & Aquaculture, 24(2), 136–152. https://doi.org/https://doi.org/10.1080/23308249.2015.1112357
- Llorente, I., Fernández-Polanco, J., Baraibar-Diez, E., Odriozola, M. D., Bjørndal, T., Asche, F., Guillen, J., Avdelas, L., Nielsen, R., Cozzolino, M., Luna, M., Fernández-Sánchez, J. L., Luna, L., Aguilera, C., & Basurco, B. (2020). Assessment of the economic performance of the seabream and sea bass aquaculture industry in the European Union. Marine Policy, 117, 103876. https://doi.org/https://doi.org/10.1016/j.marpol.2020.103876
- Mitra, S., Khan, M. A., & Nielsen, R. (2019). Credit constraints and aquaculture productivity. Aquaculture Economics & Management, 23(4), 410–427. https://doi.org/https://doi.org/10.1080/13657305.2019.1641571
- Nielsen, R., Ankamah-Yeboah, I., & Llorente, I. (2021). Technical efficiency and environmental impact of seabream and seabass farms. Aquaculture Economics & Management, 25(1), 106–125. https://doi.org/https://doi.org/10.1080/13657305.2020.1840662
- Pomeroy, R., Bravo-Ureta, B. E., Solis, D., & Johnston, R. J. (2008). Bioeconomic modelling and salmon aquaculture: An overview of the literature. International Journal of Environment and Pollution, 33(4), 485–500. https://doi.org/https://doi.org/10.1504/IJEP.2008.020574
- Rizzo, G., & Spagnolo, M. (1996). A model for the optimal management of sea bass Dicentrarchus Labrax aquaculture. Marine Resource Economics, 11(4), 267–286. https://doi.org/https://doi.org/10.1086/mre.11.4.42629170
- STECF. (2021). The EU aquaculture sector – Economic report 2020 (STECF-20-12). Publications Office of the European Union. https://doi.org/https://doi.org/10.2760/441510
- Weygandt, J. J., Kieso, D. E., & Kimmel, P. D. (1999). Managerial accounting tools for business decision making. John Wiley & Sons.