
 ?Mathematical formulae have been encoded as MathML and are displayed in this HTML version using MathJax in order to improve their display. Uncheck the box to turn MathJax off. This feature requires Javascript. Click on a formula to zoom.
Abstract
This study investigates price relationships along the Norwegian salmon value chains in France, the EU’s leading consumption market for salmon, and Poland, the EU’s largest “processing hub.” Using a vector error correction model framework, our results indicate that the salmon price determination is a supplier-driven process, with the export prices in Norway influencing prices in France and Poland, but not vice versa. Results also suggest that price linkages are strong between the export market in Norway and the retail market in France and the processing industry in Poland; however, the Polish retail sector is separated from markets at the upstream level, while price discovery at the French wholesale market is dominated by the retail market. Our findings imply that the evolved market structures lead to efficiently functioning retail markets in France and wholesale markets in Poland, but put the French wholesale and Polish retail markets at a disadvantage.
Introduction
Norway is the largest producer and exporter of salmon worldwide, and the Norwegian aquaculture industry has been leading the global salmon market and competing in the world market for seafood for quite some time. Salmon is an important source of seafood in Europe, with Norway accounting for 95% of the EU’s salmon imports (Straume, Anderson, et al., Citation2020; WITS, Citation2022). Poland is by far the largest export market for fresh farmed salmon from Norway while France is the second (WITS, Citation2022). Norway exports salmon mainly in the form of fresh whole head-on gutted fish, amounting to 85% of the country’s salmon exports. For exports of salmon in this condition, Norwegian exporters pay a minimal 2% tariff to the EU, whereas the rate sharply increases to 13% for exports of fish in the processed form, such as salmon fillets (Norwegian Seafood Council, Citation2022; Reuters, Citation2016). To circumvent high tariffs, Norwegian suppliers export the whole salmon to hub markets in the EU, including France and Poland, where secondary processing like filleting and smoking takes place. Those countries then sell value-added salmon products domestically or to other EU countries without customs duties that otherwise must be paid if the processed salmon were exported directly from Norway to the EU (VALUMICS, Citation2021).
Although France and Poland both process large volumes of salmon imported from Norway, the organization of their market structures greatly differ, particularly with regard to company ownership structures, vertical integration, and type of contractual relationships. The Norwegian salmon value chain is characterized by the adaptiveness of large vertically integrated aquaculture producers, which creates different types of interfirm relations with their trading partners depending on markets, sales channels, and logistical priorities (Olafsdottir et al., Citation2019). In Poland’s emerging salmon market, Norwegian enterprises, along with enterprises from other countries, directly own secondary processing plants, whereas in France, the EU’s largest consumption market for salmon, retailers have a strong position on the domestic market and hold long-term contracts with the large Norwegian salmon producers (Larsen & Asche, Citation2011). Accordingly, retailers in France purchase salmon directly from Norwegian producers, sub-contract processing operations to domestic fish processors, and apply markup pricing on the cost of primary products (i.e., the purchase price of the whole salmon on the export market) to set selling prices (Guillotreau et al., Citation2005).
Against this background, this paper aims to investigate price formation along the salmon supply chains of France and Poland. Particularly, we analyze price relationships between the export market in Norway and the wholesaleFootnote1 and retail markets of whole salmon and salmon fillets in France and Poland. We assume that the market organization structures have a differential influence on price relationships along the domestic supply chains. Therefore, conducting a comparative study between France and Poland enables the assessment of the role played by the retail-dominated vs. processing-dominated supply chains in the efficiency of markets at the upstream and downstream levels of the supply chains.
The literature on price relationships along the salmon value chains is dominated by the analysis of price pass-through from export to retail markets for a variety of salmon products in typically large and sophisticated consumption markets, such as France, Spain, and the United Kingdom. The general finding from this literature is that the export prices of Norwegian salmon play the leading role in the determination of prices for the European downstream markets, but not vice versa (e.g., Asche et al., Citation2014; Gizaw et al., Citation2021; Landazuri-Tveteraas et al., Citation2018). Analyzing price relationships for 17 salmon products at the retail levels in France and the United Kingdom from 2005 to 2014, Landazuri-Tveteraas et al. (Citation2018) find that Norwegian export market prices influence the prices of salmon products in only half of retail markets, although this price transmission is found to be incomplete, except for the price of fresh salmon fillets in the United Kingdom, which is completely influenced by the export price. Complete price transmission is also found for the retail market of fresh salmon fillets in France for the 2006–2011 period by Asche et al. (Citation2014); however, the French market for smoked salmon is detached from price developments in the export market. In contrast, Asche et al. (Citation2007) identify strong price linkages between the United Kingdom’s producer and export markets and France’s processor and retail markets of smoked salmon for the period 1992–1998. Moreover, the salmon producer price in the United Kingdom is found to lead export prices in the main exporting countries, such as the United Kingdom itself and Canada, Chile, and Norway (Salazar & Dresdner, Citation2021).
Another strand of the literature explores asymmetries in the speed of price responses depending on the size of price margins along the supply chain. Ankamah-Yeboah et al. (Citation2017), Gizaw et al. (Citation2021), and Simioni et al. (Citation2013) identify asymmetries in the speed of price transmission along the salmon supply chains in France and Germany. In contrast to the previous literature, Larsen and Kinnucan (Citation2009) is the only study exploring price relationships exclusively between the export and wholesale prices, finding that, with an average of 60%, the change in the export price is incompletely transmitted to the wholesale price of the whole salmon in France.
Our contributions to the literature on price transmission are 3-fold: First, to the best of our knowledge, this is the first study to analyze price relationships in the Polish salmon market. Poland has emerged as an important salmon market after the turn of the millennium, as it is the largest buyer of fresh farmed salmon from Norway and one of the major markets for the export of processed Norwegian salmon to other EU countries. Hence, Poland is a good example of a country that is an important re-exporter of fish, a rapidly increasing phenomenon (Asche et al., Citation2022), and unique in that salmon imports are fresh not frozen. Therefore, how efficiently salmon markets function in Poland could influence the price formation of EU markets, since price relationships would be transmitted down to the supply chain to the end consumer markets. Second, we study price relationships along each stage of the supply chain at the export, wholesale/processing, and retail levels. Existing studies so far have focused on price linkages either at the level of the export-retail or export-wholesale markets, whereas this paper enables assessing price relationships additionally at the wholesale-retail level. Third, we follow a comparative approach and analyze price transmission along the two supply chains characterized by different market structures. In France, the processing industry has been sub-contracted by supermarkets and also direct contractual relationships exist between retailers and Norwegian salmon producers, whereas the latter directly owns salmon processing plants in Poland.
We use a multivariate vector error correction model (VECM) within a price transmission framework to investigate the transmission of price changes along the salmon value chains in France and Poland. A high degree of price transmission indicates strong price linkages and that markets are efficient. In vertically well-integrated markets, prices at different stages of the supply chain respond not only completely but also quickly to shocks occurring at different stages of the supply chain.
This paper is structured as follows: Section two provides an overview of salmon markets in Norway, France, and Poland. The methodology and estimation framework are presented in section three and the price series are discussed in section four. Finally, section five reports estimation results and section six provides a discussion and concluding remarks.
Salmon markets in Norway, France, and Poland
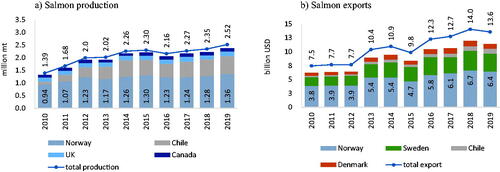
Accompanied by investments in technological innovation, marketing, and sales with the consolidation of farms, the salmon industry has witnessed tremendous growth in recent years, with large firms becoming even larger to achieve economies of scale (Asche et al., Citation2013). The global production of salmon has almost doubled in the last decade, increasing from about 1,400 thousand mt in 2010 to 2,500 thousand mt in 2019 (). Norway is the largest producer of Atlantic salmon in the world, accounting for 54% of total global salmon production in 2019. Similarly, global salmon exports have almost doubled over the last 10 years, with export revenues increasing from 7.5 billion USD to 13.6 billion USD (). With its share of 47% in 2019, Norway is also the largest salmon exporter in the world.
Figure 1. (a) Production of Atlantic salmon in million mt and (b) exports of Atlantic salmon in billion US dollars (USD), 2010–2019. Source: OECD (Citation2022), authors’ elaboration.
Currently, global demand for salmon exceeds supply, and trade has been favorable for aquaculture producers. As new buyers are easily found due to high demand, the duration of stable trade relationships is rather short in the aquaculture industry, making the entry and exit in trade partnership not very costly (Jaghdani, Johansen, et al., Citation2020; Oglend et al., Citation2022; Straume, Landazuri-Tveteraas, et al., Citation2020). Prices have increased continuously, following growing demand in established markets in Europe and successful entry into new markets. However, salmon prices have been historically volatile because of the highly inelastic supply of fish in the short-run (Asheim et al., Citation2011) and biological uncertainties that imperil the availability of harvesting biomass, and hence, stable supplies. For instance, in 2016, algae bloom in Chile and sea lice in Scotland and Norway significantly reduced the global supply of farmed Atlantic salmon. As a consequence, the export price of fresh whole salmon in Norway increased by 40% from an average per kilogram (kg) price of 5.10 USD in 2015 to 7.15 USD in 2016 (FAO, Citation2017). Despite the formation of the futures market in 2007 to cope with the intrinsic price volatility characterizing the salmon market, the use of futures contracts as a risk management tool remains a challenge in this still immature market in which price discovery is led by spot prices (Asche et al., Citation2016). Nevertheless, the latest evidence reveals that a process of maturation is starting to take place (Ewald et al., Citation2022).
The salmon export market is a historically established free market exchange system with numerous sellers and buyers as market participants. The strategic coordination within the salmon chain has resulted in horizontal concentration at the producer level through mergers and acquisitions and vertical coordination downwards in the chain, which has given larger companies a competitive advantage and improved their bargaining position in markets. For instance, according to the global value chain governance model (Gereffi et al., Citation2005), Norwegian aquaculture producers have a relationalFootnote2 governance form with supermarkets in France, whereas small French secondary processors may be captiveFootnote3 to the “lead firm” retailers. The ownership of secondary processing plants in Poland by vertically integrated Norwegian salmon companies corresponds to the hierarchy governance form, which is characterized by “high incentives to centralize control of strategic investments” (Olafsdottir et al., Citation2019, p. 10).
Although the large aquaculture producers have been profitable in recent years while demand has been high, their margins have been offset by higher costs of production due to biological constraints. Moreover, economic studies on market power identify a low degree of market imperfectness in the salmon chain (Jaghdani, Čechura, et al., Citation2020). The analysis of scale efficiency indicates that large producers of Norwegian salmon operate at an almost optimal scale of operation, while small and medium-sized enterprises could improve their productivity and profitability by increasing the scale of their operations (Čechura et al., Citation2020).
Usually, the smallest quantities of salmon are traded on the international market at the beginning of the year. The traded volume increases month over month as the year progresses, reaching its maximum by Christmas time at the end of the year. Because of short-term inelasticity in salmon production (Asheim et al., Citation2011), there is a negative relationship between the export prices and quantities in the short run (one-year period) (). However, with the steadily growing global demand for salmon, this relationship between the supplied quantity and the export prices reverses in the long run (; thick black trendline) due to significant demand growth (Braekkan et al., Citation2018). In particular, over the last 20 years, Norwegian exporters increased the volume of salmon exports 4-fold from about 260 thousand mt in 2001 to 1,047 thousand mt in 2021 and received a two to three times higher price per kg of exported fish (the average export price of salmon increased from 2.9 USD to 6.9 USD during this period).
Figure 2. Export volume (mt) and export price [Norwegian Krone (NOK)/kg] for Norwegian salmon: weekly, 2001–2021. Source: Statistics Norway (Citation2022), authors’ elaboration.
![Figure 2. Export volume (mt) and export price [Norwegian Krone (NOK)/kg] for Norwegian salmon: weekly, 2001–2021. Source: Statistics Norway (Citation2022), authors’ elaboration.](/cms/asset/0d28342a-c3df-46ec-b8a4-60709051e78a/uaqm_a_2104403_f0002_c.jpg)
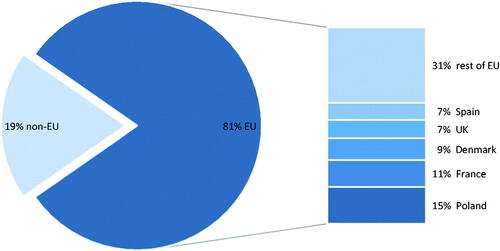
The main buyers of Norwegian salmon, which is usually sold on spot markets, are wholesalers, secondary processors, and retailers providing processed salmon to European and non-European markets. The EU market is the largest export market for Norwegian salmon, representing 81% of its total export sales value in 2018 (). Two EU countries, Poland and France, are the largest individual export markets for Norway. In 2018, Norway exported about 142 thousand mt of fresh whole salmon with a value of 1,005 million USD to Poland and 99 thousand mt of salmon with a value of 733 USD million to France (WITS, Citation2022). This corresponds to a 15 and 11% share of Norway’s total exports to Poland and France, respectively ().
Figure 3. Export markets for Norwegian salmon, %, 2018. Source: WITS (Citation2022), authors’ elaboration.
In France, where salmon is one of the most consumed species, the salmon market is well-developed. Each year, French people consume an average of 33.5 kg of fish per person (EUMOFA, Citation2020). In contrast, the salmon market in Poland is emerging and Polish consumers eat an average of 13 kg of fish per person, which is about 11 kg less compared to the EU average (EUMOFA, Citation2020). In spite of pronounced consumption trends, salmon is hardly produced in France. In 2019, salmon production amounted to 0.4 thousand mt in France and 2.4 mt in Poland. However, large quantities of the whole salmon are imported and processed in local processing facilities in France and Poland. In the same year, France and Poland imported 120 and 168 thousand mt of salmon, respectively. In addition, as consumers’ demand is high, processed salmon is also imported into France as locally processed salmon cannot meet the demand. By contrast, Poland exports most processed salmon to other countries, where salmon consumption is low. In particular, France's net import comprises 23.6 thousand mt of salmon fillet and 10.5 thousand mt of smoked salmon, whereas Poland is a net exporter of salmon fillet (31.4 thousand mt) and smoked salmon (50.1 thousand mt) ().
Table 1. Salmon production, trade, and consumption, 2019.
Accordingly, France’s retail sector, compared to that of Poland’s, more actively participates in the export market transactions through trading companies owned by large French vertically integrated firms. French retailers generally favor large salmon suppliers to ensure stable supplies and lower transaction costs; hence, establishing direct long-term contractual relationships with large Norwegian exporters is becoming more common in France. On the other hand, because of the high domestic demand for seafood, with about 265 processing companies the processing sector in France is well-developed and highly competitive (CNPMEM, Citation2016). Nevertheless, individual secondary processors are at a disadvantage since they have to compete with Norwegian suppliers that hold long-term contracts with French retailers and also with processing companies that are subsidiaries of the large French vertically integrated firms.
At the same time, the fish processing sector is becoming more consolidated in Poland (EC-JRC, Citation2019), and has significant foreign ownership. Compared to Norway, this EU member country has much lower salmon processing (which is a labor-intensive activity) wage costs and this allows tariff-free exports of end salmon products to EU markets. The secondary processing of salmon has particularly increased since 2014 in Poland, mainly due to the fact that Norwegian salmon-producing companies have created their own processing plants or have formed long-term contractual relationships with the existing Polish processors. For example, the largest vertically integrated Norwegian seafood company, Mowi, acquired the secondary Polish processing company Morpol in 2013, which, with a total processing capacity of 150 thousand mt of salmon annually, is one of the largest salmon processors in the world (Seafood Media, Citation2022).
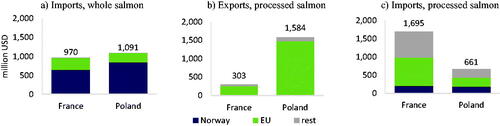
Accounting for 67% of total salmon imports to France and 77% of total imports to Poland, Norway is the most important salmon trading partner for both France and Poland (). Even though France and Poland import almost equally large amounts of fresh whole salmon (970 million USD and 1,091 million USD in 2018, respectively), exports of salmon end products are five times smaller in France compared to Poland (). This is explained by the higher domestic demand for salmon in France, whereas Poland is mainly focused on the export of processed salmon products. Regardless of exported quantities, the main export markets for France and Poland are predominantly EU markets. Furthermore, due to high domestic demand, France also imports large amounts of processed salmon products, mainly in the form of frozen salmon fillets ().
Figure 4. Trade of whole salmon and processed salmon products: France and Poland, million USD, 2018. Note: “Processed salmon products” refers to the sum of trade values in the following categories: fresh and frozen salmon fillets and smoked salmon. Supplementary Appendix B provides further statistics in more detail. Source: WITS (Citation2022), authors’ elaboration.
Methodology and estimation framework
Price plays a central role in defining the extent of the market, whether it be the market in the context of a geographical area for a homogenous good or of a supply chain for a related good with different levels of processing (Stigler & Sherwin, Citation1985). The analysis of price relationships between vertically related markets at different stages of the supply chain builds on the structural model of marketing margins (Gardner, Citation1975). In this model, Gardner shows that under perfect competition and shifts in supply and demand conditions influence relationships between prices at different stages of the supply chain; nevertheless, unlike spatial price relationships (Fackler & Goodwin, Citation2001), price linkages along the supply chain are not generally characterized by proportional movements due to substitution possibilities.
On the other hand, the assessment of price relationships rests on the notion of market integration and market efficiency (Asche et al., Citation2007; Barrett, Citation2001). Markets are considered fully integrated and efficient if they are characterized by the complete transmission of price shocks in the long run. However, the transmission of price shocks might not occur instantaneously and takes place with delays if price adjustment is costly, thus resulting in price disequilibrium in the short run (Vavra & Goodwin, Citation2005).
It is common that commodity price series in levels are non-stationary processes. However, in a network of integrated markets, price series that are individually non-stationary can share a common trend, which then describes the long-run relationship. In integrated markets, price relationships between non-stationary price series at different stages of the supply chain can be evaluated using a vector error correction model (VECM) (Johansen, Citation1988). The multivariate VECM, which is a system of linear equations, takes the following form:
(2)
(2)
where
is the first difference operator,
corresponds with an
-dimensional vector of prices in natural logarithm at
different markets. The
matrix
has reduced rank
with
if all
prices share exactly one common trend. Both
and
are
matrices, where the matrix
contains the normalized cointegrating vectors characterizing long-run equilibria for
linear combinations of prices. To include constant in the long-run price equilibrium equation,
has been modified to
where the matrix
includes price transmission elasticity and the vector
contains the intercept. The price transmission elasticity (
) measures the magnitude of price shock transmissions from one market to another, hence the degree of price transmission. The theoretical value of the long-run price transmission elasticity (
) varies between zero and one, with
indicating that price information is 100% completely transmitted between markets at different stages of the value chain. However, Larsen and Kinnucan (Citation2009) indicate that incomplete price transmission (
) is compatible with perfect price transmission under the condition that the elasticity of price transmission equals the cost share of raw material in the value of the product in the downstream market. Intercept (
) provides an estimate of the fixed markup coefficient under the assumption of perfect competition and perfect price transmission (Bakucs & Fertő, Citation2006).
The loading matrix contains the speed of adjustment coefficients measuring the speed at which deviations from the long-run equilibrium are eliminated by the corresponding price. The expected absolute value of the parameter ranges between zero and one, with the latter indicating that the prices in a particular market adjust all at once to eliminate price disequilibrium after a price shock.
represents a vector of lagged values of the first difference of price series with lags
ensuring that the model residuals are serially uncorrelated.
contains corresponding dynamic short-run parameters, while
is a conventional residual term with
Before the estimation of vertical price relationships, we first assess the non-stationarity property of individual price series by using the Augmented Dickey-Fuller (ADF) unit root test (Dickey & Fuller, Citation1981). For non-stationary price series we examine cointegration and, thus, the existence of long-run price equilibrium between prices using the Johansen test for linear cointegration (Johansen, Citation1988). The test should identify cointegration vectors for
integrated markets. The cointegration analysis is followed by the estimation of VECM to retrieve the long-run price transmission elasticities and adjustment parameters.
Furthermore, since all price series in the VECM depend on each other, a shock to the -th variable not only directly affects the
-th variable but is also transmitted to all of the other endogenous variables through the dynamic structure of the model. Hence, individual coefficient estimates only provide limited information on the reaction of the system to a shock. However, the impulse response function allows for the effect of a one-time shock on current and future values of the endogenous variables to be captured. We use generalized impulse responses to obtain the responses, which do not depend on the ordering of variables in the VECM system (Pesaran & Shin, Citation1998).
Data
Our dataset includes eight price series for salmon at the various stages of the supply chain in Norway, France, and Poland. The dataset comprises 134 weekly observations for each price series in Poland covering the period from August 2017 to February 2020 and 448 weekly observations for each price series in Norway and France covering the period from July 2011 to February 2020 ().Footnote4 All price series are reported in Euros per kg. The price series for Norway and Poland contain missing observations, which we substituted with values drawn using the cubic spline interpolation technique (Forsythe et al., Citation1977). In particular, we interpolated 21 of 448 price observations for the export prices of salmon in Norway, and 28, 10, and 13 of 134 price observations for the whole salmon wholesale prices, wholesale salmon fillet prices, and retail salmon fillet prices in Poland, respectively.
Table 2. Data description, salmon prices.
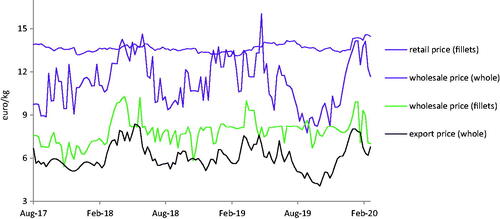
The data set ( and ) comprises export prices of farmed Atlantic salmon (whole, first sale, 3–4 kg) for Norway collected from the European market observatory for fisheries and aquaculture products (EUMOFA, Citation2021). For France, we use the weekly wholesale and retail prices for farmed Atlantic whole salmon and salmon fillets sold at the Rungis International Market, which is the largest wholesale marketplace in France. The data is sourced from the National Authority for Agriculture and Sea Products (FranceAgriMer, Citation2021b). For Poland, we use the weekly wholesale and retail prices of fresh imported salmon. In particular, the wholesale price series are available for whole salmon and salmon fillets, although, for the retail level, the prices are only available for salmon fillets. The dataset is provided by the European Market Observatory for Fisheries and Aquaculture Products (EUMOFA, Citation2021).
Figure 5. Salmon prices in France and Norway, 2011–2020. Source: EUMOFA (Citation2021), FranceAgriMer (Citation2021b), authors’ elaboration.
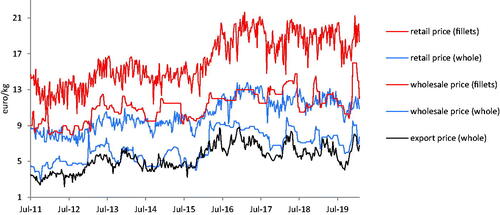
Figure 6. Salmon prices in Poland and Norway, 2017–2020. Source: EUMOFA (Citation2021), authors’ elaboration.
Empirical results
This section ascertains the times series properties of the data and patterns of cointegration between the price series, which is then followed by a cointegration analysis and VECM estimation that provides information on the magnitude and speed of price transmission and price adjustment along the salmon value chains in France and Poland.
Tests of the existence of a unit root and cointegration
Results of the unit root test (Supplementary Appendix A) indicate that the null hypothesis of the non-stationary price series cannot be rejected for all prices across levels but can be rejected for prices in first differences at the 5% significance level for Norway, France and Poland. This indicates that the price series are integrated into order one.
Subsequently, we test whether these non-stationary price series are cointegrated using the multivariate test of cointegration (Supplementary Appendix B). We test cointegration for all export, wholesale and retail prices separately for France and Poland. The cointegration test for France includes five price series: the retail and wholesale prices of whole salmon and salmon fillets in France and the export prices in Norway. Results indicate four cointegration vectors at the 10% significance levelFootnote5 that correspond to the existence of one common stochastic trend in the system, which suggests that retail and wholesale markets of whole salmon and salmon fillets in France and the export market in Norway belong to the same market network. Furthermore, without the inclusion of any lag for price variables, the test of serial correlation indicates that the VECM residuals are serially uncorrelated.Footnote6
The results of the multivariate cointegration test for Poland, which contains four price series (wholesale and retail prices of salmon fillets, wholesale prices of the whole salmon in Poland, and export prices in Norway) do not indicate market integration among them (Supplementary Appendix B). Accordingly, we evaluate market integration among the subset of salmon markets in Poland and the export market in Norway. We first remove the retail price of salmon fillets in Poland and include three price series only: the export price of salmon in Norway, and wholesale prices of whole salmon and salmon fillets in Poland. We use one lag in the system for the multivariate VECM, which is enough to ensure that the residuals are serially uncorrelated.Footnote7 The cointegration test with three price series suggests that there are two cointegration vectors at the 5% significance level and, hence, the wholesale markets of whole salmon and salmon fillets in Poland and the export market in Norway are integrated and belong to the same market network.
Hence, the retail market of salmon fillets in Poland is separated from the upstream wholesale markets in Poland and the export market in Norway. Therefore, we conduct a price transmission analysis between the export price in Norway and the wholesale prices of whole salmon and salmon fillets in Poland within the multivariate VECM.
Long-run price equilibrium relationships
In , we report on the coefficient estimates from the long-run price equilibrium equation, i.e., the intercept and price transmission elasticity. This corresponds to the normalized parameter estimates of four cointegration equations for France and two cointegration equations for Poland. For ease of interpretation, salmon price variables in France and Poland are normalized in a way to represent the pair-wise long-run relationship with the export price in Norway.
Table 3. Long-run price equilibrium relationship: salmon markets in France and Poland.
For France, the results of the long-run price transmission analysis indicate that the degree of price transmission is lower for salmon fillets compared to the whole salmon. At the wholesale level, changes in export prices are transmitted to the price of the whole salmon by 92% and to the price of salmon fillets by 54%. Similarly, at the retail level, the price transmission elasticity equals 0.68 for whole salmon and 0.66 for salmon fillets. Furthermore, we observe a lower degree of price transmission at the retail level compared to the wholesale level. In particular, for the whole salmon, changes in the export price are transmitted to its wholesale price by 92%, whereas price changes are transmitted to its retail price by 68%. Interestingly, for salmon fillets, the price transmission elasticity from the export price to the retail price of salmon fillets (0.68) is larger compared to the wholesale price of salmon fillets (0.54).
For Poland, we only evaluate market integration between the Polish wholesale markets and the export market in Norway, since cointegration is not confirmed for the retail market in Poland (compare ). The results of the price transmission analysis indicate that the price transmission is weaker between the Norwegian salmon market and the wholesale market of whole salmon () compared to salmon fillets (
), which is about twice as large in magnitude. This finding that the degree of price transmission is lower for the whole salmon compared to salmon fillets is in contrast to the results obtained for France.
Next, we test the existence of perfect price transmission between markets using the multivariate likelihood ratio test () by jointly restricting the long-run price transmission elasticities of the export price to the value of one in every cointegration equation: where
denotes the number of cointegration equations. The results indicate the absence of the perfect price transmission jointly within the selected market networks both in France and Poland. Moreover, the test of perfect price transmission for individual market pairs (
) provides contrasting results. For France, the results provide evidence of full price transmission between the export market in Norway and the wholesale market of the whole salmon in France, whereas they allow for the null hypothesis of complete price transmission for the rest of the salmon markets to be rejected at the 5% significance level. In Poland, complete price transmission is identified for the wholesale market of salmon fillets, whereas price transmission is incomplete for the wholesale market of the whole salmon, which is in contrast to results obtained for France ().
Under perfect price transmission, the coefficient of intercept provides an estimate of the constant markup coefficient. Therefore, by jointly restricting price transmission elasticities to one in a multivariate VECM, we obtain estimates of the markup parameter for each downstream price with regard to export price ().
Table 4. Estimates of the fixed markup between the downstream and export prices.
Various marketing costs can also shape price developments along the salmon value chains in France and Poland. Regarding the fixed markup coefficients (), we find that the lowest markup estimate is 0.229 for the whole salmon at the wholesale level in France and the highest markup estimate is 2.096 for salmon fillets at the retail level in France. Furthermore, the price markup coefficient is generally lower at the wholesale/processing level compared to the retail level and higher for salmon fillets compared to the whole salmon.
Comparing the markup coefficients across countries, the absolute percentage markup is higher by 6.3% for the whole salmon in Poland (29.2%) compared to France (22.9%) at the wholesale level, though this difference turns in an opposite direction and increases to 23.6% for salmon fillets, corresponding with a price markup percentage between the wholesale price of salmon fillets and export price of 110.6% in France and 86.9% in Poland. This could be explained by higher processing costs in France compared to Poland, as salmon processing is a labor-intensive activity and processing costs are much lower in Poland (EC-JRC, Citation2019). The gap between France’s and Poland’s fixed percentage markup coefficients for salmon fillets (209.6 and 128.5%, respectively) further increases to 81% at the retail level. Interestingly, for salmon fillets, price markup has sharply increased by 90% from the wholesale (110.6%) to the retail level (209.6%) in France, whereas in Poland it has increased by about half, from 86.9% at the wholesale level to 128.5% at the retail level reflecting French consumers’ stronger demand for salmon and higher purchasing power compared to Polish consumers.
Correction of the temporary price disequilibrium
Reflected in the large values of the price adjustment parameters, efficient markets are characterized by the quick elimination of temporary price deviations from the long-run price equilibrium. The estimated adjustment parameters for France and Poland are reported in .
Table 5. Price adjustment parameters along the salmon value chains in France and Poland.
Our results indicate that the salmon prices in France and Poland adjust to eliminate price deviations and restore the long-run price equilibrium at the different stages of the value chain (diagonal elements of with a negative sign). In contrast, export prices do not react to eliminate price disequilibrium, as adjustment coefficients of the salmon export price in Norway are statistically insignificant at the 5% significance level in all cointegration equations for France and Poland.
Next, we assess the leading role of markets in price formation along the value chains in France and Poland. Particularly, we use the likelihood ratio test to evaluate the weak exogeneity of salmon markets by jointly restricting the adjustment parameters for each price series in all cointegration equations. The results indicate that the weak exogeneity of all salmon price series in France and Poland can be rejected at the 1% significance level. This implies that salmon prices in France and Poland do not have a leading role and they adjust to price developments in the salmon export market. On the other hand, the test statistic is unable to reject the null hypothesis of weak exogeneity for the export price of salmon, which confirms the leading role of the export price in Norway for price formation at the wholesale and retail markets of whole salmon and salmon fillets in France and Poland.
Furthermore, in France, the adjustment of the individual salmon prices to the equilibrium relationship with the export price is about four times quicker at the retail level compared to the wholesale level. For example, responding to a market shock, retail prices of whole salmon and salmon fillets react quicker and eliminate 44 and 45% of price disequilibrium in 1 week, respectively, compared to wholesale prices. At the wholesale level, on the other hand, just 10 and 13% of price deviations from the equilibrium relationship with the export price are eliminated by the wholesale prices of whole salmon and salmon fillets in 1 week, respectively.
Compared to France, price adjustment is quicker at the wholesale level in Poland. The price adjustment coefficients are equal to 0.38 and 0.52 for whole salmon and salmon fillets, respectively, suggesting that the adjustment speed is greater by 28 and 39% in Poland compared to France.
Furthermore, in France, we observe “cross-product” and “cross-market” price adjustment at the retail level in the short run (off-diagonal elements of with statistically significant positive values at the 5% significance level). The retail price of the whole salmon reacts to changes in the retail price of salmon fillets (0.240) and vice versa (0.170). Similarly, the results also indicate that the retail prices react to changes in the wholesale prices albeit at a lower adjustment rate (0.068 and 0.095). In addition, changes in the retail price of salmon fillets trigger short-term price changes at the wholesale market of salmon fillets (0.112). These results suggest that the salmon prices are determined in an interdependent manner in the French salmon value chain, whereas salmon prices in Poland exclusively react to price changes only for the export market.
Analysis of the impulse response functions ( for France and for Poland in Supplementary Appendix C) indicates that the retail market in France and wholesale market in Poland are much quicker in responding to price shocks, whereas we observe more sluggish price reactions for the wholesale market in France. Notwithstanding responses to their own market shocks, salmon prices for the downstream markets in France and Poland react strongest to export prices. Furthermore, wholesale prices in France are more responsive to the retail market’s shocks compared to retail prices, which barely react to the wholesale market’s shocks.
Discussion and concluding remarks
In this paper, we have investigated price relationships along the salmon value chains in France and Poland to assess market efficiency and price transmission in their salmon markets.
We find that the downstream markets in France and Poland do not influence price formation in the export market in Norway. Our results align with the findings of studies on price transmission (Asche et al., Citation2014; Gizaw et al., Citation2021; Landazuri-Tveteraas et al., Citation2018) and governance of global value chains (Olafsdottir et al., Citation2019), which indicate that the global salmon value chain is characterized by supplier-driven price determination processes.
Furthermore, the results identify the dominance of the retail sector in the price formation of the salmon fillet market within the French salmon value chain. This provides evidence for the influence of hypermarkets on prices at the secondary processing level, which may subsequently result in squeezed margins for the processing companies in the retailer-driven domestic supply chain in France, which is characterized by a captive governance structure (Olafsdottir et al., Citation2019).
Concerning Poland, the wholesale market for salmon fillets functions more efficiently and is more strongly linked with the export market of Norway compared to France. This finding for the salmon fillet market in Poland complies with the organization of market structures in Poland, and specifically Norwegian companies’ direct ownership of the processing plants in Poland, which is compatible with the hierarchy governance form (Olafsdottir et al., Citation2019), ensuring strong price linkages between the export market in Norway and the Polish market of processed salmon products.
Our comparative analysis was motivated in part by observed differences in governance structures along the salmon value chains in France and Poland. In particular, we noted that the direct ownership of the Polish processing plants and direct transactional relationships with the French retailers ensures strong price linkages and high market efficiency. However, these implications are drawn from an analysis employing aggregated price data and if terms of individual market transactions diverge from the trends discovered for these markets at large, this would limit the generalizability of our findings to the individual interfirm relationships along the salmon value chains.
Supplementary_materials.docx
Download MS Word (65.9 KB)Acknowledgments
The research on which this paper is based formed part of the VALUMICS project “Understanding Food Value Chain and Network Dynamics” funded from the European Union’s Horizon 2020 research and innovation programme under grant agreement No 727243.
Notes
1 We use the terms “wholesale market” and “processing sector” interchangeably even though price setting might differ at these two stages of the supply chain. As price data is only available at the wholesale level, we assume that the pricing behavior at the wholesale level closely follows that of the processing sector.
2 Olafsdottir et al. (Citation2019, p. 11) define relational governance as the “mutual dependence between buyers and suppliers [that] leads to sustained interactions and explicit coordination between both parties.”
3 In a captive type of governance structure, “suppliers are subject to the extensive intervention and monitoring of lead firms and depend on resources and market access provided by the lead firms” (Olafsdottir et al., Citation2019, p. 11).
4 The use of different periods makes the results not directly comparable, which might be considered a limitation of the comparative study. Nevertheless, this study contributes to the literature by providing valuable insights, especially regarding Poland, which has not been studied before.
5 However, the test indicates three cointegration equations formed among five price series at the 5% significance level, which is against the central market hypothesis (Asche et al., Citation2012) suggesting that cointegration vectors are identified for
integrated markets.
6 Using the Lagrange Multiplier (LM) test, the null hypothesis of no serial correlation with six lags cannot be rejected at the 1% significance level (p-value = 0.47).
7 Using the Lagrange Multiplier (LM) test, the null hypothesis of no serial correlation with one lag cannot be rejected at the 1% significance level (p-value = 0.08).
References
- Ankamah-Yeboah, I., Nielsen, M., & Nielsen, R. (2017). Price formation of the salmon aquaculture futures market. Aquaculture Economics & Management, 21(3), 376–399. https://doi.org/10.1080/13657305.2016.1189014
- Asche, F., Roll, K. H., H. N., Sandvold, H. N., Sørvig, A., & Zhang, D. (2013). Salmon aquaculture: Larger companies and increased production. Aquaculture Economics & Management, 17(3), 322–339. https://doi.org/10.1080/13657305.2013.812156
- Asche, F., Gjølberg, O., & Guttormsen, G. A. (2012). Testing the central market hypothesis: A multivariate analysis of Tanzanian sorghum markets. Agricultural Economics, 43(1), 115–123. https://doi.org/10.1111/j.1574-0862.2011.00569.x
- Asche, F., Dahl, R. E., Valderrama, D., & Zhang, D. (2014). Price transmission in new supply chains – The case of salmon in France. Aquaculture Economics & Management, 18(2), 205–219. https://doi.org/10.1080/13657305.2014.903309
- Asche, F., Jaffry, S., & Hartmann, J. (2007). Price transmission and market integration: Vertical and horizontal price linkages for salmon. Applied Economics, 39(19), 2535–2545. https://doi.org/10.1080/00036840500486524
- Asche, F., Misund, B., & Oglend, A. (2016). The spot-forward relationship in the Atlantic salmon market. Aquaculture Economics & Management, 20(2), 222–234. https://doi.org/10.1080/13657305.2016.1156192
- Asche, F., Yang, B., Gephart, J. A., Smith, M. D., Anderson, J. L., Camp, E. V., Garlock, T. M., Love, D. C., Oglend, A., & Straume, H.-M. (2022). China’s seafood imports: Not for domestic consumption? Science, 375(6579), 386–388. https://doi.org/10.1126/science.abl4756
- Asheim, L. J., Dahl, R. E., Kumbhakar S. C., Oglend A., & Tveteras, R. (2011). Are prices or biology driving the short-term supply of farmed salmon? Marine Resource Economics, 26(4), 343–357. https://doi.org/10.5950/0738-1360-26.4.343
- Bakucs, L. Z., & Fertő, I. (2006). Marketing margins and price transmission on the Hungarian beef market. Acta Agriculturae Scandinavica, Section C – Food Economics, 3(3–4), 151–160. https://doi.org/10.1080/16507540601176075
- Barrett, C. B. (2001). Measuring integration and efficiency in international agricultural markets. Review of Agricultural Economics, 23(1), 19–32. https://doi.org/10.1111/1058-7195.00043
- Braekkan, E. H., Thyholdt, S. B., Asche, F., & Myrland, Ø. (2018). The demands they are A-Changin. European Review of Agricultural Economics, 45(4), 529–531. https://doi.org/10.1093/erae/jby003
- Čechura, L., Žáková Kroupová, Z., Rumánková, L., Jaghdani, T. J., Samoggia, A., & Thakur, M. (2020). Assessment of Economies of scale and technical change along the food chain. The VALUMICS project funded by EU Horizon 2020 G.A. No 727243. Deliverable: D5.6, Czech University of Life Sciences, Prague (p. 169). https://doi.org/10.5281/zenodo.5161347
- CNPMEM. (2016). French fisheries. https://www.comite-peches.fr/wp-content/uploads/2016/01/Brochure_la-p%C3%AAche-francaise_EN_FINAL.pdf
- Dickey, D. A., & Fuller, W. A. (1981). Likelihood ratio statistics for autoregressive time series with a unit root. Econometrica, 49(4), 1057–1072. https://doi.org/10.2307/1912517
- EC-JRC. (2019). European Commission, Joint Research Centre, Scientific, Technical and Economic Committee for Fisheries, The EU fish processing sector: economic report (STECF-19-15) (J. Guillen, N. Carvalho, & L. Malvarosa, Eds.). Publications Office. https://doi.org/10.2760/30373
- EUMOFA. (2020). Eumofa, The EU Fish Market, 2019 edition. https://www.eumofa.eu/documents/20178/415635/EN_The±EU±fish±market_2020.pdf
- EUMOFA. (2021). Online database. https://www.eumofa.eu/data
- Eurostat. (2022). Online database. https://ec.europa.eu/eurostat
- Ewald, C.-O., Haugom, E., Kanthan, L., Lien, G., Salehi, P., & Størdal, S. (2022). Salmon futures and the Fish Pool market in the context of the CAPM and a three-factor model. Aquaculture Economics & Management, 26(2), 171–191. https://doi.org/10.1080/13657305.2021.1958105
- Fackler, P. L., & Goodwin, B. K. (2001). Chapter 17 Spatial price analysis. Handbook of Agricultural Economics, 1, 971–1024. https://doi.org/10.1016/S1574-0072(01)10025-3
- FAO. (2017). Severely elevated prices in 2016 has salmon sector searching for solutions, GLOBEFISH – Information and Analysis on World Fish Trade. https://www.fao.org/in-action/globefish/market-reports/resource-detail/en/c/902748/
- Forsythe, G. E., Malcolm, M. A., & Moler, C. B. (1977). Computer methods for mathematical computations. Journal of Applied Mathemetics and Mechanics, 59(2), 141–142. https://doi.org/10.1002/zamm.19790590235
- FranceAgriMer. (2021a). The fisheries and aquaculture sector in France. November 2020 edition ISSN: 2259-9177.
- FranceAgriMer. (2021b). Online database. https://www.franceagrimer.fr/
- Gardner, B. L. (1975). The farm-retail price spread in a competitive food industry. American Journal of Agricultural Economics, 57(3), 399–409. https://doi.org/10.2307/1238402
- Gereffi, G., Humphrey, J., & Sturgeon, T. (2005). The governance of global value chains. Review of International Political Economy, 12(1), 78–104. https://doi.org/10.1080/09692290500049805
- Gizaw, D., Myrland, Ø., & Xie, J. (2021). Asymmetric price transmission in a changing food supply chain. Aquaculture Economics & Management, 25(1), 89–105. https://doi.org/10.1080/13657305.2020.1810172
- Guillotreau, P., Le Grel, L., & Simioni, M. (2005). Price-cost margins and structural change: Sub-contracting within the salmon marketing chain. Review of Development Economics, 9(4), 581–597. https://doi.org/10.1111/j.1467-9361.2005.00295.x
- Hryszko, K. (2020). Rynek i spożycie ryb w 2019 roku (Market and fish consumption in 2019). In XLV Szkolenie – Konferencja Hodowców Ryb Łososiowatych, October 14.
- Jaghdani, T. J., Johansen, U., Thakur, M., & Đurić, I. (2020). Assessment of persistence of business/trade relationships along the selected food chains of different European countries and sectors. The VALUMICS project funded by EU Horizon 2020 G.A. No 727243. Deliverable: D5.3, Leibniz Institute of Agricultural Development in Transition Economies (IAMO), Germany (p. 43). https://doi.org/10.5281/zenodo.5161193
- Jaghdani, T. J., Čechura, L., Ólafsdóttir, G., & Thakur, M. (2020). Market power in Norwegian Salmon Industry. In Proceedings of 60th Annual Conference German Association of Agricultural Economists (GEWISOLA), Halle/Saale, Germany, September 23–25. https://doi.org/10.22004/ag.econ.305590
- Johansen, S. (1988). Statistical analysis of cointegration vectors. Journal of Economic Dynamics and Control, 12(2–3), 231–254. https://doi.org/10.1016/0165-1889(88)90041-3
- Landazuri-Tveteraas, U., Asche, F., Gordon, D. V., & Tveteraas, S. L. (2018). Farmed fish to supermarket: Testing for price leadership and price transmission in the salmon supply chain. Aquaculture Economics & Management, 22(1), 131–149. https://doi.org/10.1080/13657305.2017.1284943
- Larsen, T. A., & Asche, F. (2011). Contracts in the salmon aquaculture industry: An analysis of Norwegian salmon exports. Marine Resource Economics, 26(2), 141–150. https://doi.org/10.5950/0738-1360-26.2.141
- Larsen, T. A., & Kinnucan, H. W. (2009). The effect of exchange rates on international marketing margins. Aquaculture Economics & Management, 13(2), 124–137. https://doi.org/10.1080/13657300902885220
- Norwegian Seafood Council. (2022). Tollsats-og tolloversikt til EU 2022 (Tariff and customs overview for EU 2022). https://sfd-seafood-prod.azureedge.net/48d52b/globalassets/markedsadgang/toll/tolltariff-til-eu/2022/tolltariffen-til-eu-2022.pdf
- OECD. (2022). Online database – OECD Statistics. https://stats.oecd.org/
- Oglend, A., Asche, F., & Straume, H.-M. (2022). Estimating pricing rigidities in bilateral transactions markets. American Journal of Agricultural Economics, 104(1), 209–227. https://doi.org/10.1111/ajae.12230
- Olafsdottir, G., Mehta, S., Richardsen, R., Cook, D., Gudbrandsdottir, I. Y., Thakur, M., Lane, A., & Bogason, S. G. (2019). Governance of the farmed salmon value chain from Norway to the EU. Aquaculture Europe, 44(2), 5–19. https://doi.org/10.5281/zenodo.5494436
- Pesaran, H. H., & Shin, Y. (1998). Generalized impulse response analysis in linear multivariate models. Economics Letters, 58(1), 17–29. https://doi.org/10.1016/S0165-1765(97)00214-0
- Reuters. (2016). Norwegian satisfies EU smoked salmon appetite through Polish back-door. Retrieved March 17, 2016, from https://www.reuters.com/article/us-britain-eu-norway-salmon-idUKKCN0WI1VJ
- Salazar, L., & Dresdner, J. (2021). Market integration and price leadership: The U.S. Atlantic salmon market. Aquaculture Economics & Management, 25(3), 245–268. https://doi.org/10.1080/13657305.2020.1843562
- Seafood Media. (2022). Companies Directory. https://seafood.media/fis/companies/details.asp?l=e&filterby=companies&=&country_id=&page=1&company_id=114433
- Simioni, M., Gonzales, F., Guillotreau, P., & Le Grel, L. (2013). Detecting asymmetric price transmission with consistent threshold along the fish supply chain. Canadian Journal of Agricultural Economics, 61(1), 37–60. https://doi.org/10.1111/j.1744-7976.2012.01257.x
- Statistics Norway. (2022). Online database. https://www.ssb.no/en/statbank/table/03024/tableViewLayout1/
- Stigler, G. J., & Sherwin, R. A. (1985). The extent of the market. The Journal of Law and Economics, 28(3), 555–585. https://doi.org/10.1086/467101
- Straume, H.-M., Landazuri-Tveteraas, U., & Oglend, A. (2020). Insights from transaction data: Norwegian aquaculture exports. Aquaculture Economics & Management, 24(3), 255–272. https://doi.org/10.1080/13657305.2019.1683914
- Straume, H.-M., Anderson, J. L., Asche, F., & Gaasland, I. (2020). Delivering the goods: The determinants of Norwegian seafood exports. Marine Resource Economics, 35(1), 83–96. https://doi.org/10.1086/707067
- UN Comtrade. (2022). International trade statistics database. https://comtrade.un.org/
- VALUMICS. (2021). Norwegian salmon value chain: How does it influence the EU markets? Research Findings Brief, The VALUMICS project funded by EU Horizon 2020 G.A. No 727243. https://valumics.eu/wp-content/uploads/2021/08/Salmon_Brief.pdf?fbclid=IwAR3PoXjT8DZMbkV_ARDR-P4bnQCFtRDKN9K9o32Qwzv4T6ymdtehOM9Yq1g
- Vavra, P., & Goodwin, B. K. (2005). Analysis of price transmission along the food chain. OECD Food. Agriculture and Fisheries Papers. https://www.oecd-ilibrary.org/docserver/752335872456.pdf?expires=1643389672&id=id&accname=guest&checksum=60DFF3208AEBA36B622B75BFB7DE1629
- WITS. (2022). Online database. https://wits.worldbank.org
- World Bank. (2022). Online database. https://data.worldbank.org/