
 ?Mathematical formulae have been encoded as MathML and are displayed in this HTML version using MathJax in order to improve their display. Uncheck the box to turn MathJax off. This feature requires Javascript. Click on a formula to zoom.
Abstract
We analyze costs, break-even prices, and profits for multiple scales of operation of an off-bottom oyster culture operation, ranging from 27,000 oysters planted on half an acre to 1.28 million oysters planted on four acres. The analysis focuses on the first five years of operation and accounts for factors such as operation startup, periodic adverse environmental conditions, variations in stocking and mortality rates, method of sale, and price to grower. We estimate total annual cost, including depreciation and interest on invested capital, labor, fuel, seed, and other expenses, to range from approximately $50,000 to operate a single line of floating bags to approximately $250,000 to operate twenty-four lines. We estimate the five-year average break-even price to range from $2.57 per oyster for 40,000 oysters planted on half an acre, to $0.71 per oyster for 480,000 oysters planted on two acres, to $0.52 per oyster for 960,000 oysters planted on four acres. Consistent with previous findings, we find that the average small-scale operation is not expected to be profitable. We estimate that it is generally necessary to operate at or above levels of 720,000 oysters planted on three acres to realize a positive average annual profit.
Introduction
Off-bottom oyster culture in the U.S. usually involves the production of hatchery-reared oysters in containers, floating or suspended in the water column or on the sea floor. It goes by different names in different places, including “oyster farming”, “oyster aquaculture”, “container culture”, and “alternative oyster culture”. Here, we are distinguishing this production method from traditional oyster culture, which usually involves harvesting oysters that recruit naturally on existing reefs or on cultch (shell, limestone, broken concrete, or some other substrate placed on the sea floor where oysters can attach). Traditional methods sometimes also involve relaying seed oysters from seed oyster grounds to an oyster bed for grow-out, as is done by some producers in Louisiana, or using remote-set spat-on-shell, as done in some East Coast states.
Given the historical loss of reefs worldwide (Beck et al., Citation2011), limited natural recruitment of oysters, as well as the relative scarcity and cost of substrate for bottom production (Petrolia, Citation2022), off-bottom oyster culture has been promoted as a means to supplement or even replace traditional oyster production in places facing some or all of these limitations (Botta et al., Citation2020). For example, the State of Louisiana recently implemented a grants program to subsidize growers, oyster “parks”, hatcheries, and nurseries (Petrolia, Citation2023). The Gulf Coast in general, and Louisiana in particular, is one of the few remaining places where naturally recruited oysters are harvested commercially. Natural recruitment of oysters is one of the major advantages that Louisiana oystermen have compared to producers in other states. Other states, including Alabama, Alaska, Maryland, and North Carolina, established loan programs for oyster growers to purchase seed and equipment (Hill & Collins, Citation2024; Parker et al., Citation2020). Oyster culture has also been touted as providing some of the same ecosystem services as natural reefs (Barrett et al., Citation2022; Petrolia et al., Citation2022; Petrolia et al., Citation2020).
In this paper, we analyze costs, break-even prices, and profits for multiple scales of operation of an off-bottom oyster culture operation, ranging from as few as 27,000 oysters planted on half an acre to as many as 1.28 million oysters planted on four acres. The analysis focuses on the first five years of operation and accounts for factors such as operation startup, periodic adverse environmental conditions, variations in stocking and mortality rates, method of sale, and price to grower. To preview the results, we find that the average small-scale operation is not expected to be profitable. We estimate that it is generally necessary to operate at or above levels of 720,000 oysters planted on three acres to realize a positive average annual profit.
Previous findings in the literature are mixed. Moor et al. (Citation2022) conducted a profitability analysis of three gear systems (floating bags, floating cages, and adjustable long-lines) for a farm size of 1.5 acres growing 105,000 oysters per year initially and ramping up to as many as 325,000 oysters per year. They found that when no environmental risks were introduced, all three systems were profitable by the end of the first ten years. Under environmental risk scenarios, they found that while floating bags performed worse, they still have a positive cash position at the end of the ten-year period. Floating cages and adjustable long-lines fared worse. They found minimal impact of insurance on profitability. Overall, they concluded that floating bags are less costly to set up and more profitable than the other systems analyzed.
Engle et al. (Citation2021) analyzed the profitability of oyster culture at two production scales among Maryland growers: ≤600,000 oysters sold per year and >600,000 oysters sold per year. They found that production was profitable, on average, when annual depreciation and opportunity cost of capital were ignored, but found that only large-scale production (>600,000 oysters sold) was profitable, on average, when all relevant costs were included. Note that their small production level of ≤600,000 oysters sold corresponds approximately to the two largest production levels considered in this study, implying that none of the production levels considered here would be considered profitable by their standards. Similarly, Parker et al. (Citation2020) analyzed the net present value (discounted profit over a ten-year period) of water-column oyster culture for Maryland growers at four production levels: 500,000, one million, two million, and 2.5 million oysters sold per year. They found that the two smaller production levels had negative net present values, on average, whereas the two larger production levels had positive net present values. Note well, however, that their analysis ignores depreciation and opportunity costs of capital. Again, their two smaller production levels correspond approximately to the largest production level considered in this report, again implying that none of the production levels considered in this report would be expected to be profitable by their standards.
Observations from the off-bottom oyster culture sector in the southeastern U.S
A handful of states have publicly available data on off-bottom oyster culture. Intensive oyster culture in Virginia has grown from less than 1 million oysters in 2004 to a peak of over 40 million oysters in 2016, to 31.1 million oysters in 2018 (Hudson, Citation2017, Citation2018, Citation2019; Hudson & Murray, Citation2014, Citation2015, Citation2016; Murray & Hudson, Citation2011, Citation2012, Citation2013; Murray & Oesterling, Citation2006, Citation2007, Citation2008, Citation2009, Citation2010). In Maryland, harvest ranged between 5.6 million and 8.8 million since 2017 (Parker, Citation2023).
In Alabama, oyster aquaculture sales have grown from 1.9 million in 2018 to a peak of 4.7 million in 2021, to 4.5 million in 2022 (Grice & Tarnecki, Citation2022, Citation2023; Grice & Walton Citation2019, Grice & Walton, Citation2020). Although total production has grown, the number of farms has declined, from a high of 22 in 2018, to 10 farms in 2022. The number of acres permitted has not changed much, and the number of acres in production has increased slightly, from 37 in 2018 to 45 in 2022, implying that average farm size is increasing.
Additional data are available for Florida, Georgia, Maryland, Mississippi, North Carolina, and Texas (Herbst et al., Citation2022, Parker, Citation2023). Of the states reporting farm and acreage data, Florida reports the highest number of farms/leases at 125, followed by North Carolina (119) and Maryland (109). Maryland has the highest acreage, at 568 acres, followed by Florida (400) and North Carolina (365). Mississippi has a grow-out park with 516 acres permitted with two-acre leases available for growers. Farms in Florida and North Carolina average just over three acres, whereas in Maryland it is 5.5 acres. Georgia and Texas began in 2022, with farm/lease sizes ranging between 7.5 and ten acres. For the states reporting number of farms, acreage, and harvest data, we calculate that North Carolina has the highest average productivity; in 2021, they averaged 148,134 oysters harvested per farm and 48,296 oysters harvested per acre.
Price received by Virginia growers vary widely, from a low of $0.10 per oyster in 2008 to a high of $1.20 per oyster in 2018. This wide range has been consistent every year. Although the upper bound has trended upward over time, the average price received has remained relatively consistent, ranging between $0.29 and $0.41. Thus, although prices at or above $1 per oyster have been observed repeatedly, the average remains below $0.50 per oyster. Among Maryland growers, the average price to growers in the half-shell market is $0.40–0.50 per oyster (Parker, Citation2023).
Given the important role of imports in the U.S. market, their price signals can be informative. Focusing on Canada and Mexico and adjusting for inflation using the GDP Implicit Price Deflator (U.S. Bureau of Economic Analysis, Citation2024), prices for farmed oysters from Canada, which account for more than half of all imports, range from $0.57 in 2012 to $0.80 in 2021. Prices for wild oysters from Canada, which comprise a small share of imports, are somewhat lower, ranging from $0.51 in 2012 to $0.72 in 2021. Prices for farmed oysters from Mexico, which account for a third of imports, are much lower, ranging from $0.25 in 2016 to $0.35 in 2023. Import prices should be interpreted as being in the neighborhood of wholesale prices, and thus these price estimates are consistent with the price estimates reported earlier from the individual states.
Cost, break-even, and profitability analysis
Study area
Louisiana is a major player in domestic oyster production. Louisiana was the top oyster producing state during the 2021 reporting year, landing 5.9 million pounds and accounting for one-fourth of the U.S. total (NOAA Fisheries, Citation2023). Louisiana has been the top oyster producing state thirty-five out of the past seventy-two years and has been in the top three every year since 1952. Despite being a perennial leader, Louisiana’s oyster landings have declined in recent years. Louisiana’s oyster landings averaged 11.6 million pounds per year between 2000 and 2019 but has averaged only 5.8 million pounds per year between 2020 and 2022.
Off-bottom oyster culture has not played a significant role in Louisiana oyster production thus far. According to Melancon (Citation2023), there were nine such farms operating on 51.5 acres in 2021, but that number fell to zero after Hurricane Ida hit in August 2021. In 2022, Louisiana began subsidizing off-bottom oyster culture by providing grants to jump-start this nascent industry. Off-bottom oyster culture is one of several strategies identified to mitigate the impacts of anticipated salinity changes due to large-scale Mississippi River diversions (Louisiana’s Seafood Future, Citation2023; USACE Citation2022). State funding for off-bottom was predicated on Louisiana’s longstanding history of oyster hatchery research, the apparent success of off-bottom oyster production in other states, and the asserted mobility of off-bottom production systems to “move to different growing areas in response to episodic events or longer-term changes in salinity” (CPRA Citation2022). Today, there are approximately twenty grow-out farms operating on approximately 50 acres (most subsidized), and the state has a total of 219 acres available for grow-out (Melancon, Citation2023). There are two oyster hatcheries in the state: the Michael C. Voisin Oyster Hatchery on Grand Isle and a private inland (recirculating) hatchery (also subsidized). There are a limited number of hatcheries located in other Gulf states, but those facilities tend to give priority to their own constituents prior to selling seed to Louisiana buyers. Current production data are not available, but nearly all current harvest occurs in the vicinity of Grand Isle.
Production assumptions
The number of oysters planted and harvested varies according to several factors. We consider six production levels characterized by the number of containers, lease size (acres), number of oysters planted (assuming 25% expected mortality), and expected number of oysters harvested (). Acreage requirements are based on the space requirements described by Walton et al. (Citation2012), Pruente et al. (Citation2023), and observations of current oyster culture operations.
Table 1. Production levels analyzed.
There are a variety of gear types for container-based oyster aquaculture, including an adjustable longline system, floating cages, semi-automated floating baskets, and floating bags. Based on discussions with Louisiana oyster farmers and Louisiana Sea Grant personnel, it was determined that most farmers in Louisiana use either floating cages or floating bags. We chose floating bags as the basis for the analysis. Based on the work of Pruente et al. (Citation2023), per-acre costs are similar between these two types, and based on their calculations using default gear spacing and stocking rates, floating bags can accommodate more oysters for the same amount of space. With the floating cage system, the bags are inside the cages, usually with three or six bags per cage, and thus offer more protection to the bags.
Following Pruente et al. (Citation2023), Walton (Citation2021), and Walton et al. (Citation2012), we include the following items for the floating gear system, assuming R6 seed is purchased (that is, seed that will retain on 6 mm mesh): large mesh bags for final grow-out, equal to the number of lines x number of bags per line (200); small mesh bags for initial grow-out, equal to one-eighth of the number of large mesh bags; bag closures equal to twice the sum of small and large mesh bags; anchor lines equal to the number of lines; screw anchors equal to twice the number of anchor lines; and floating buoys equal to twice the number of anchor lines.
Following Pruente et al. (Citation2023) and Walton et al. (Citation2012), we assume that a line of floating bags is 300 feet long and two feet wide, with each line holding 100 bags on each side, for a total of 200 bags per line, with a 20-foot boat lane required between lines. Under these assumptions, Pruente et al. (Citation2023) indicate that six lines can fit within one acre and that thirteen lines can fit within two acres. Walton et al. (Citation2012), however, assumes five lines per acre. We compromise and assume a flat rate of six lines per acre so that twelve lines can fit within two acres, acknowledging that an individual farmer may deploy more or less gear.
We include the following additional equipment: a power washer ($300) and harvest baskets ($35 each, one per 100 12 mm floating bags). In the case of a grower operating within an oyster “park”, we assume that a tumbler/sorter/washer is provided by the park at no additional cost to the farmer. We add 24.2% to the cost of all gear and other equipment to account for sales tax and shipping cost, based on a sample of actual gear invoices for current Louisiana growers that ranged from less than 10% to over 30%, and the sales tax rate for Grand Isle (9.2%). Maxwell and Supan (Citation2010) reported shipping costs that were 20–26% of gear value.
We assume a boat with a motor and trailer will be required. We assume that farm work is feasible with a Class A vessel (less than 16 ft) with a minimum 15-HP motor, but that some growers may already own a Class 1 vessel (16–26 ft) and use that. Based on this and other searches, we assumed a cost of $20,000 for a used boat, motor (50-HP), and trailer, with a useful life of ten years and straight-line depreciation. Given the saltwater environment, the assumption of a ten-year life for a used outboard motor may be somewhat optimistic. Motor lifespan will also be a function of running hours, which this analysis does not factor in. We assume a salvage value of $2,500 for the combined boat, motor, and trailer. Following Johnson (Citation2018), an annual cost of taxes, insurance, and housing for the boat, motor, and trailer is included using the formula (total sales price of boat, motor, and trailer/2) × 1.5%. We base boat, motor, and trailer repair costs on Johnson (Citation2018), using a modified formula: 1% × purchase price × motor running hours. We base boat motor lubrication and filter costs on Johnson (Citation2018), assuming 15% of fuel costs.
The farmer will require some form of transportation to commute from home to the dock nearest the farm. However, in Louisiana, particularly in Grand Isle in the short-run, direct delivery to buyers, likely to larger cities such as New Orleans, Baton Rouge, Lafayette, and the Mississippi Coast, will also be required. This will require a reliable vehicle with mechanical refrigeration to make weekly trips to and from buyers. We assume a used truck can be purchased for $25,000 depreciated over ten years, with a $2,500 salvage value. For reference, a new base-model Ford F-150 starts at $33,695 before taxes, title, and license. Following Johnson (Citation2018), an annual cost of taxes, insurance, and housing for the truck is included using the formula (total sales price of the truck)/2) × 1.5%. For truck maintenance (including oil, lubrication, tires, and repairs), we use the Bureau of Transportation Statistics (Citation2023) rate of $0.097 per mile per year.
For mechanical refrigeration, we assume a mobile refrigeration trailer using an AC window unit, a digital temperature controller (CoolBot), and a retro-fit insulated trailer (Perkins-Veazie, Citation2012; Store It Cold LLC, Citation2021). The estimated cost is $3,471; to this we add $129 to cover the cost of an AC/DC inverter to power the unit from the truck, for a total of $3,600. Alternatively, the unit could be powered with a gas generator at a similar cost. We assume a five-year useful life on the refrigeration unit.
A grower can establish his own lease, he can lease a plot within one of Louisiana’s oyster parks, or in limited cases, can operate on private water bottoms. If he leases a plot within a park, we assume that the plot is pre-permitted and approved and no further surveying or permit work is required. If the grower establishes his own lease, he must hold an oyster lease. Once a lease is obtained, he must apply for an alternative oyster culture permit, which costs $100 (good for ten years). As part of the permitting process, a Coastal Use Permit is required, which has its own $100 application fee (one-time fee). The permit process may also require permits from the US Army Corps of Engineers, a state water-quality certification, completion of a US Coast Guard Private Aids to Navigation Application, and any other state or federal approvals that may apply. A surety bond is also required if the farm is to be located on a state oyster lease, based on the estimated cost of gear removal and the bond rate. A reasonable cost for the bond is $1,000. A surety bond is not required if a grower operates within a park or on a private water bottom. Given direct sales, we also include a one-time $390 cost for HACCP training. of the Appendix summarizes all key assumptions.
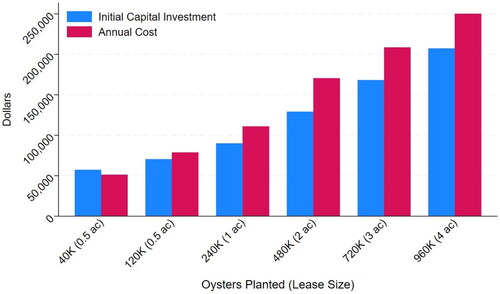
shows the estimated initial capital investment and annual operating cost, which includes annual fixed cost, for each production scale analyzed. Total initial capital investment is estimated to range from approximately $57,000 for a single line of floating bags (40,000 oysters planted) to over $200,000 for twenty-four lines (960,000 oysters planted). Details can be found in of the Appendix.
Figure 1. Estimated initial capital investment and annual cost.
Seed (baby) oysters can be purchased from a hatchery or nursery as either diploid or triploid, and at different sizes. Although they are hatchery-reared, diploid oyster seed are the type typically found in the wild (for the Gulf and Atlantic coasts, the Eastern oyster, Crassostrea virginica). Triploid oyster seed are the same species, but produced artificially through a patented process that crosses a wild diploid female with a patented tetraploid male. Triploid oysters are mostly sterile and tend to grow faster because they do not expend as much energy on reproduction. Consequently, they tend to remain “fat” all year long as opposed to a diploid oyster that may become “watery” or “milky” during spawning.
Seed can be purchased in various sizes. Sizes are often denoted by an “R” value, where the “R” stands for “retained” meaning the mesh screen size on which the seed will be retained, that is, will not fall through. This lets the grower know the size of mesh bags needed to contain a given size of seed. Growers face a tradeoff when purchasing seed. Smaller seed are cheaper, but require additional handling and generally have higher mortality rates. Some growers will operate their own nurseries, either in an upweller system or in a “field” nursery, which means growing the seed in small-mesh sleeves within the regular gear. Observations of current Louisiana off-bottom oyster growers indicate they are purchasing a variety of seed sizes (R2, R4, or R6). We assume the farmer purchases R6 seed at a cost of $28.75 per 1,000.
Parker et al. (Citation2020) cite several studies to support their assumption of 50% mortality from seed (5–10 mm triploid) to market-size, and describe this as “a medium level of mortality based on the published data and discussions with commercial operations” (p. 8). Dame et al. (Citation2019), whose analysis relied partly on grower input, assumed that 80% of oysters survived from planting to harvest, and of those, 90% were marketable, implying 28% mortality from planting to market. Bodenstein et al. (Citation2021) found mortality rates between near-zero and 40% for diploid oysters and between 5% and 60% for triploids. Sturmer et al. (Citation2018) report mean mortality rates for diploid and triploid oysters of 18% and 15%, respectively. Walton et al. (Citation2013) report a mean mortality rate of 29%, with no significant difference between diploids and triploids. Sturmer et al. (Citation2022) investigate unexplained spring and summer mortality events in 2018 and 2019 in two counties in Florida that resulted in 50–80% mortality. Wadsworth (Citation2018) reports mortality rates at four farms across the Gulf Coast ranging from around 25% to above 50% for triploids and less than 25% for diploids. Walton et al. (Citation2012) assume 10% mortality. We assume 25% expected mortality from seed purchase to harvest and assume that growers account for expected mortality by purchasing an amount of seed equal to the ratio of expected annual production and (1 − expected mortality rate). For example, if expected annual production is 60,000 oysters and expected mortality is 25%, then the grower will purchase 60,000/(1 − 0.25) = 80,000 oyster seed.
We base boat fuel requirements on Johnson (Citation2011), who recommends dividing horsepower for a gasoline outboard motor by ten to determine gallons per hour. We assume motor running hours are equal to 10% of labor hours. We base truck fuel requirements on the city miles per gallon reported for a 2023 Ford F-150 (19 mpg). We assume a home location of Thibodaux (81 miles one-way to Grand Isle) and a direct delivery location of New Orleans (107 miles one-way from Grand Isle). We assume travel to the farm three to seven days per week, depending on production level, 52 weeks per year. We assume oyster delivery to New Orleans once per week, 52 weeks per year. We assume $3.20 per gallon of gasoline, which is the average monthly retail gasoline price over all grades and formulations for the Gulf Coast over the period August 2022-July 2023 (EIA Citation2023).
Current Louisiana oyster parks have lease fees ranging from $200 per year (flat rate) to $2,000 per year for a two-acre lease, to $3,000 per year for a half-acre lease. We use the median of these three rates ($1,000 per acre per year). If he operates on his own lease, he is required to pay an annual permit fee to the state of $2 per acre or portion of acre, but must take care of the permitting process, surveying and marking, obtain a surety bond, have his own tumbling/sorting equipment and staging area, etc.
An Oyster Harvester License is required, at a cost of $100 (resident) per year, and a Commercial Fisherman License is required, at a cost of $75.50 (resident non-senior). Given the need for direct sales, an oyster grower must also hold a Wholesale/Retail Seafood Dealer License ($400 per year) and a Seafood Transport License ($56.50 per year per vehicle). We include the cost of general liability insurance at the rate of $1,000 per acre. This rate is based partly on Parker et al. (Citation2020), who use a rate of $1,000 per $150,000 in sales. At $0.75 per oyster, production of 200,000 oysters would yield $150,000 in sales, and approximately one acre is needed to grow that number of oysters.
The literature contains a handful of labor estimates. Hudson et al. (Citation2013) report estimated labor hours required for operations ranging from less than 100,000 to two million oysters planted per year. Their estimates are based on four years (2008–2011) of grower data from the Virginia Sea Grant Marine Extension Program’s annual shellfish aquaculture crop reporting survey. Their estimates range from 960 combined full-time and part-time hours for less than 100,000 oysters planted to 12,000 h for up to two million oysters planted. Parker et al. (Citation2020) adapted those estimates to analyze larger-scale operations in Maryland, ranging from 500,000 to 2.5 million oysters per year. They assumed a fixed 2,080 supervisory labor hours per year. For general labor hours, they added office labor hours to those of Hudson et al. (Citation2013). Engle and van Senten (Citation2018) report labor cost per unit sold rather than reporting a number of hours and hourly wage for their bottom container culture analysis. They report a labor cost of $15 ± $11 per 100-count box of oysters sold for an operation producing 600,000 or more oysters per year. Maxwell and Supan (Citation2010) provide labor requirements for both construction/installation and operation for an adjustable longline system on a one-acre lease producing between 60,000 and 120,000 oysters. They report 15 h of labor for construction and installation. They report between 30 and 109 d of labor for seeding, maintenance, and harvest at a rate of $100 per day (equivalent to $12.50 per hour for an eight-hour day, which is assumed here); and 250 h at a rate of $6 per hour for bag cleaning. Converting days to hours assuming an eight-hour day yields between 490 and 1,122 h.
We use the labor estimates of Hudson et al. (Citation2013) because they covered the full production range analyzed here. Both Parker et al. (Citation2020) and Engle and van Senten (Citation2018) focused on larger operations and their results may not translate directly to smaller operations. Thus, the estimates used here are lower than those of Parker et al. (Citation2020) and very similar to those of Maxwell and Supan (Citation2010). For comparison to Engle et al. (Citation2021), the estimated labor cost under the baseline scenario (discussed later in the report) for the two highest production levels is $21–24 per 100-count of oysters, thus within the upper range of Engle and van Senten (Citation2018).
We assume two labor types: supervisory labor (which can be interpreted as the owner-operator) and general labor. The labor hours used, as taken from Hudson et al. (Citation2013) are reported as is in of the Appendix. In terms of full-time equivalent (FTE) days per week spent working at the farm, assuming 52 weeks per year and an eight-hour day, planting up to 100,000 oysters requires one person working 2.3 days per week. Planting between 100,000 and 200,000 oysters requires one person working five days per week (or two people working 2.5 days each). Producing up to one million oysters requires 17.3 FTE days, implying that three people working nearly six days per week is required. Their estimates are a function of the number of oysters planted and stops at the farm gate, assuming that a wholesale distributor does the marketing. Thus, their labor requirements exclude marketing and transportation needed for direct delivery. We add 25% to labor hours to account for direct sales, which appears to be the most likely option for growers in Louisiana, at least in the short run. Note that even with this increase, labor requirements used by Parker et al. (Citation2020) are still 16-28% higher.
We assume rates of $20 per hour for supervisory labor and $12.50 per hour for general labor (equivalent to $100 per day for an eight-hour day) (Parker et al. (Citation2020). We allocate hours as follows: first, we determine the total hours required for a given number of oysters planted from Hudson et al. (Citation2013) and multiply that number by 1.25 to account for added labor for direct sales. We then allocate hours to supervisory labor first at the rate of $20 per hour, assuming that in the owner-operator case, the owner-operator will carry out as much work himself as possible, up to the annual full-time maximum of 2,080 h (8 h/d × 5 d/week × 52 weeks/year). Remaining hours, if any, are then allocated to general labor at the lower $12.50 per hour rate. Employer-paid taxes are then added to general labor costs at the rate of 13.8% (federal payroll tax/FICA, 6.2%; workmen’s compensation, 5.0%; unemployment insurance, 2.6%). Employment taxes are not charged on supervisor labor because we assume an owner-operator arrangement, so supervisory wages are an implicit cost and would not incur taxation. We assume that the cost of retail container material (mesh bags, cardboard boxes, and/or styrofoam boxes) is $1 per 100 oysters destined for the half-shell market (Parker et al., Citation2020). We assume a fixed $2,500 cost for marketing, promotion, website maintenance, etc.
We assume that the farmer will finance farm gear and equipment, boat, motor, truck, and trailer. We also assume that the farm will need to obtain an operating loan for cash-on-hand to pay expenses prior to harvest. Following Johnson (Citation2018), annual interest on gear is calculated as (principle/2) × interest rate. The annual interest on operating capital is calculated as one-half total annual cost x interest rate. The interest rate used is the current rate for a Small Business Administration loan for under seven years on $25,001–$50,000, which is 11.75% (SBA Citation2023; NerdWallet, Citation2023). Total annual cost is estimated to range from approximately $50,000 to operate a single line of floating bags to approximately $250,000 to operate twenty-four lines. The largest cost categories at all production levels are labor and fuel costs. See in the Appendix for more details on individual cost categories.
Five-year break-even and profit projections
The five-year projections are meant to provide realistic estimates of annual average break-even price and profit during the first five years of operation. The analysis accounts for several uncertainties, summarized in . First, we consider three alternative mortality cases: “Best Case”, which assumes no adverse mortality events, such that harvest is as expected every year; “Moderate Loss Case”, where we assume 75% of a single year’s expected harvest is lost (we chose Year 4 arbitrarily); and “Severe Loss Case”, where we assume 100% of one year’s expected harvest is lost (Year 4), and that, due to lingering effects (e.g., partial gear damage/loss, seed scarcity, farm closures or water quality issues), 50% of the following year’s expected harvest is also lost (Year 5).
Table 2. Alternative assumptions considered in five-year profit projections.
Second, we consider three alternative stocking rates: 100, 150, and 200 market-size oysters per bag. The intermediate level, 150, is the level recommended for floating bags by Pruente et al. (Citation2023) and Walton et al. (Citation2012). Other sources and discussions with growers and other individuals indicate that stocking densities as high as 250 oysters per bag are possible, but that 200 is the highest that a typical farmer is likely to use. Higher stocking densities tend to require additional maintenance and may run the risk of higher mortality. The assumption of 200 oysters per bag reflects this more optimistic outcome. A seed shortage may also lead to lower stocking densities. The assumption of 100 oysters per bag approximates such a scenario. There is currently a Gulf-wide shortage of seed and there is no guarantee that a grower can obtain all the seed that he wants.
Third, we consider three alternative direct-sale branded-oyster prices to grower: $0.50, $0.75, and $1.00. Here we assume direct delivery, using New Orleans as the representative delivery location. We assume that 90% of the harvest is sold in the high-value branded half-shell market at one of the aforementioned prices, and 10% is sold in the lower-value sack-oyster market, at an average price of $0.25 per oyster. Note that the price assumptions do not apply to the break-even analysis, since the purpose of this analysis is to identify the price at which revenue and cost are equal.
Market prices tend to be misunderstood. We consulted with experienced growers, wholesalers, and restaurant owners to develop an approximate outline of prices along the farmed oyster supply chain. The price observed on a menu in an oyster bar is not what is paid to the grower. An oyster that sells for $3 apiece at an oyster bar was likely purchased from a wholesaler or a grower that sells directly for $0.75–$1. If the oyster bar purchased it from a wholesaler, the wholesaler likely purchased that oyster from a grower for approximately $0.50.
So, if selling to a wholesaler, a grower should expect a price in the neighborhood of $0.50 per oyster, and if selling directly, should expect a price in the $0.75–$1.00 range. As indicated earlier in this report, however, prices observed in other states ranged from $0.10 to $1.20 per oyster, with state averages ranging between $0.40 and $0.59 per oyster. Keep in mind that direct sale entails substantial additional cost and effort that will offset, at least partially, the additional revenue associated with the higher price. At this time, it appears that growers in Louisiana have very limited options for selling to a wholesaler and so must sell directly.
The traditional sack-oyster market can likely serve as the “backstop” market, that is, the market that growers will need to fall back on in times of excess supply (e.g., limited buyers). Using commercial oyster landings data for Louisiana (NOAA Fisheries, Citation2023), which is in pounds of meat, converted to number of oysters assuming 6.47 pounds of meat per sack (Keithly & Kazmierczak, Citation2006) and 180 oysters per sack (Banks et al., Citation2016), we calculate average dockside prices of sack oysters at $0.27 (2020) and $0.28 (2021) per oyster.
Finally, the analysis assumes a farm startup period. It is expected that the first year will be used in setting up the farm, including construction, training, etc., as well as purchasing and assembling gear, obtaining seed, and finally deploying gear and seed. Following Parker et al. (Citation2020), we assume the farm ramps up gradually to full capacity over the first two years of operation: seed planted is at 25% of full capacity during the first year and 75% of full capacity during the second year. It is reasonable to assume that because production is lower, costs would also be lower. Consequently, labor costs follow the lower levels associated with the lower number of oysters planted.
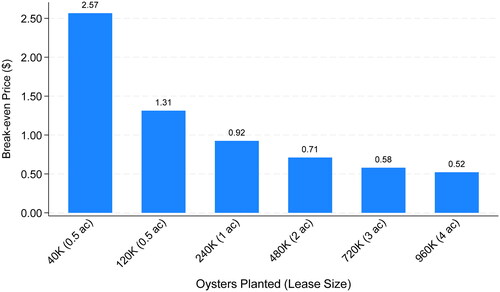
Break-even analysis estimates the per-unit price at which revenue just equals cost over some period of time. The break-even price to the grower is calculated as reports the break-even price for each production level, assuming a final stocking rate of 150 oysters per bag, under the Moderate Loss mortality case. At the lowest level of production, the break-even direct-sale price to the grower is $2.57 per oyster. As production increases, the estimated break-even price to grower generally declines, and falls below $1 per oyster at the 240,000 oysters planted level. At the highest production level considered, the estimated break-even price to the grower is still above $0.50. of the Appendix reports break-even prices under all other scenarios of the final stocking rate and mortality case.
Figure 2. Estimated Average Break-even Price for 150 oysters per bag, under Moderate Loss mortality case.
Profit is defined as Because there are three levels for each of the three sets of assumptions, there are 33 = 27 possible combinations for each production level. With six production levels, there are 27 scenarios × 6 production levels = 162 profit estimates. summarize these results. Each row shows a particular scenario according to stocking rate and price. Each dot on a given row indicates the estimated profit under the Best, Moderate Loss, and Severe Loss mortality cases for a given production level.
Figure 3. Estimated Average Annual Profit by Scenario, 26,667–160,000 Oysters Planted (0.5 Acre, 1–3 Lines).
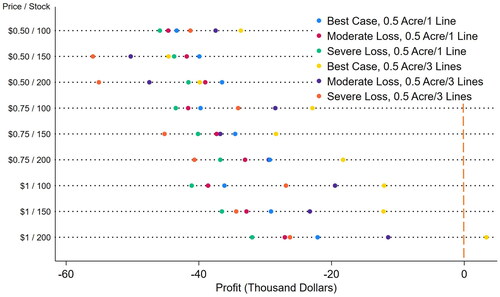
Figure 4. Estimated Average Annual Profit by Scenario, 160,000–640,000 Oysters Planted (1–2 Acres).
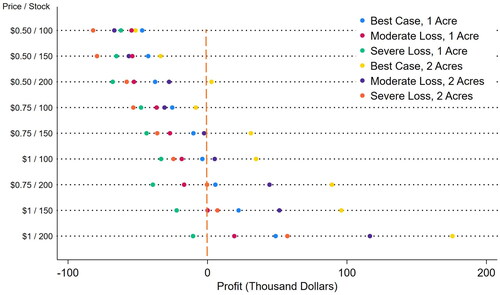
Figure 5. Estimated Average Annual Profit by Scenario, 480,000–1,280,000 Oysters Planted (3–4 Acres).
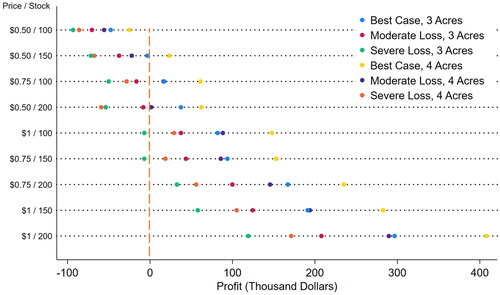
shows the estimated average annual profit by scenario for the two lowest production levels (26,667–53,333 and 80,000–160,000 oysters planted) on 0.5 acre. For the lowest production level, estimated profit is negative under all scenarios considered, indicating that this production level is not likely to be profitable, even under the most favorable conditions. For the second-lowest production level, the estimated profit is negative under all scenarios except the very best one, with a profit of approximately $3,000.
shows the estimated average annual profit by scenario for the third and fourth production levels (160,000–320,000 oysters planted on one acre and 320,000–640,000 oysters planted on two acres). For the third production level, profit is negative under most scenarios. Profit is generally positive under only the scenarios with a $1 price or a $0.75 price combined with some other favorable outcomes. However, profit is not robust at this level; in all cases at least one of the profit estimates lies to the left of zero. For the fourth production level, profit is only partly robust to the various scenarios, requiring a $1 price and a mid-to-high stocking rate. Profit is generally negative under any scenario with a $0.50 price.
shows the estimated average annual profit by scenario for the two highest production levels (480,000–960,000 oysters planted on three acres and 640,000–1,280,000 oysters planted on four acres). Under the second-highest production level, profit is only partly robust to the various scenarios. With one exception, profit is still negative under scenarios with a $0.50 price. Profit is generally positive under a mid-to-high stocking rate and at least a $0.75 price, or a $1 price. For the highest production level, profit still struggles under a $0.50 price. Profit is generally positive under higher price scenarios combined with at least a stocking rate of 150.
Discussion
Previous analyses in the literature estimate the threshold for profitable production to be in the same range as what we found or higher (Engle et al., Citation2021; Parker et al., Citation2020; Moor et al., Citation2022). The aggregate production data from Alabama presented at the beginning of this report, which indicates that the number of farms is decreasing while average farm size is increasing, also supports the general conclusions reached here. It is worth noting that this threshold is reduced to 120,000 oysters planted on half an acre if certain costs are ignored. Specifically, some argue that owner-operator labor and depreciation on boat and truck should be excluded. The arguments are as follows. Owner-operator labor is an investment in the operation, what some refer to as “sweat equity”. But this argument ignores the opportunity cost of the grower’s own time, that is, what they could be earning elsewhere. The other argument is that many growers already own a boat and truck and may also use them for other purposes, so that these expenses are not actually incurred or at least should not be fully charged to oyster culture operations. But this argument also ignores the opportunity cost of these assets; at minimum it ignores wear and tear. It is true that the present analysis assumes that the boat and truck are 100% dedicated to the oyster culture operation, so an assumption of partial dedication would indeed lower these costs. At the same time, we assumed costs that represent a used truck and a used boat, and assumed a ten-year useful life. So the more conservative assumption likely offsets the more liberal one. Overall, what the present results imply is that the “returns” to sweat equity at this lower scale of production are likely to be negative. See Petrolia (Citation2023) for a detailed analysis that both includes and excludes these costs.
One assumption that may be unique to Louisiana is the extreme distance from home to farm, which here is assumed to be 81 miles one-way. We tested this assumption against an alternative assumption of living just one mile from the farm and found that, on average, profit increases by 18% at the smallest production scale, but is still negative. For 320,000-640,000 oysters grown on two acres, profit switches from slightly negative (−$2,462) under the original assumption to positive ($12,996) under the alternative assumption. The percent change is also 18% at the largest production scale. The break-even price falls by 13–14% at the smaller scales and by 6–8% at the larger scales. So the change in assumption certainly does have a positive impact on profitability, but changes the story only slightly in terms of positive versus negative profit. Also, this alternative represents the other extreme, that of living only one mile from the farm.
Although there are hundreds, if not thousands, of establishments selling oysters in the northern Gulf region, most establishments do not sell off-bottom cultured oysters. Most market their oysters generically and focus on the preparation rather than on the source (Botta et al., Citation2023; Petrolia et al., Citation2017). Based on personal communications with some Louisiana growers and chefs, internet searches, in-person visits, and previous research (Petrolia, Citation2018), we estimate that there are currently between ten and fifteen establishments that do sell them. In most cases, these restaurants feature multiple varieties of oysters, often from all three coasts (Gulf, Atlantic, and Pacific) as well as Canada. If operations in the region grow to the size estimated here to be necessary to be profitable, and there are a significant number of them, it remains to be seen whether the local market will be able to absorb all the oysters produced, at least at current prices, and growers may need to find alternative outlets for their oysters. More markets can be accessed if growers can connect with a wholesaler, but wholesalers will require a lower price in the neighborhood of $0.50 per oyster. reports how the estimated mean profit and break-even price would change under a dockside-to-wholesaler scenario relative to direct sale at $0.50 per oyster. Under this alternative scenario, additional costs associated with marketing and delivery would not be incurred. We find that mean profit would increase by 22% at the smallest scale (but still be negative), and by 131% at the largest scale, becoming slightly positive. The break-even price would fall by 18% at the smallest scale and by 12% at the largest scale. The break-even price would fall below $0.50 at the largest scale only. Other alternatives include sales to the sack-oyster market, but this will likely require a price well below $0.50 per oyster. This market also has more and intense competition, especially in Louisiana, a state that has led the nation in reef-based oyster culture. It should be noted that some growers also sell direct to households and through special events, offering additional sales outlets, but these are not expected to represent a significant share of total sales.
Table 3. Estimated mean profit, break-even price, and relative changes for dockside-to-wholesaler scenario relative to direct-sale.
Summary and conclusions
Off-bottom oyster culture is expensive. It requires gear, seed, and labor at levels not associated with traditional oyster production. A single line of 200 floating bags, holding 30,000–40,000 oysters, is estimated to cost over $6,000. Other equipment, including refrigeration for direct delivery, is estimated at nearly $5,000. Including the cost of a boat, motor, truck, and trailer ($45,000) and other startup costs, the total initial investment is estimated to range from less than $60,000 for a single line of floating bags to over $200,000 for twenty-four lines. The total annual cost, including depreciation and interest on invested capital, labor, fuel, seed, and other expenses, is estimated to range from approximately $50,000 to operate a single line of floating bags to approximately $250,000 to operate twenty-four lines.
Under reasonable assumptions of a farm startup period and moderate crop losses due to periodic adverse environmental conditions, the five-year average break-even price is estimated to range from $2.57 per oyster for 40,000 oysters planted on half an acre, to $0.71 per oyster for 480,000 oysters planted on two acres, to $0.52 per oyster for 960,000 oysters planted on four acres. We find that the average annual profit is estimated to be negative for production levels at or below 480,000 oysters planted on two acres. Profit is estimated to be positive at production levels at or above 720,000 oysters planted on three acres. Sensitivity analysis indicates that none of the production levels considered are fully robust to the variety of conditions that off-bottom oyster culture is likely to face. Only the largest production level, on four acres, is estimated to be robust to most of the various scenarios considered.
Off-bottom oyster culture is dependent upon a small set of buyers willing to pay high prices, and it remains to be seen whether the local market will be able to absorb all the oysters produced, at least at current prices, and growers may need to find alternative outlets for their oysters. In Louisiana and other production regions, operations are located distant from markets. Some growers do not have access to an established wholesaler/distributor, requiring them to market and deliver oysters directly. Delivery can yield higher prices, but also requires added travel distance, time, and costs, and requires more logistical and marketing efforts on the part of growers, which can erode much of the gains associated with those higher prices.
Off-bottom oyster culture is dependent upon a source of hatchery-reared seed. Traditional oyster production relies on cultch and the natural recruitment of oysters. There is currently a shortage of hatchery-reared seed across most U.S. growing regions and individual states tend to prioritize their own growers. There are also regulatory constraints to interstate seed trade that differ by state and region. There is currently an even greater shortage of triploid seed, an alternative type of seed that does not reproduce, can grow faster, and provides off-bottom oyster culture an advantage during summer months. Without triploids, this genetic advantage does not exist. Off-bottom oyster culture gear and infrastructure are also susceptible to tropical storms, despite the perception by some that it can be sunk or relocated in time to avoid losses.
Off-bottom oyster culture is promoted and subsidized in several states, either with loan programs or grants given directly to oyster parks, hatcheries, and grow-out operations. Although such efforts can act as a production catalyst, it does distort market signals and may give the impression that economic conditions are better than they actually are. The eventual disappearance of such programs could put pressure on all points along the supply chain. To compensate for less-favorable loan terms or absent grant dollars, grow-out parks might ultimately need to raise lease rates. Likewise, hatcheries might also need to raise seed prices to producers, who, in turn, could be less able to pay those higher prices and/or will need to demand higher prices from buyers. Buyers will then need to ask consumers to absorb the higher prices, or as has been experienced in other markets like shrimp, will look to cheaper alternatives, like reef-based oysters and/or imports from Canada and Mexico.
There are several limitations of the present study that are worth noting. First, this study does not consider the impact of insurance. Off-bottom oyster growers are eligible for insurance/assistance under at least two programs: the USDA Non-Insured Crop Disaster Assistance Program (NAP) and the USDA Emergency Assistance for Livestock, Honey Bees, and Farm-Raised Fish Program (ELAP). These loss-case scenarios would likely be associated with a natural disaster (such as a hurricane) covered under both programs. However, Moor et al. (Citation2022) find that insurance has little to no impact on profitability. Second, it is possible that oyster growers in warmer waters may realize shorter grow-out periods, allowing for multiple crops per year. Third, the present study does not delve into the economic tradeoffs associated with using diploid versus triploid seed. Fourth, this study does not delve into the issue of when mortality occurs during the production cycle, and how that can impact labor requirements and other costs. Fifth, this study does not consider the case of collaborative, cooperative-based production and marketing. Multiple small farms may be able to work together to generate efficiencies with regard to on-farm labor and/or getting product to market. Sixth, this study does not delve into the tradeoffs associated with selling oysters directly into local markets versus through a wholesaler. Future research is needed to estimate the impacts that these additional issues may have on the present results.
Acknowledgments
We would like to thank the editor, Frank Asche, and two anonymous reviewers for suggestions that improved the manuscript. We also thank the following people for providing insights, advice, data, providing feedback during earlier presentations of results, and/or reviewing earlier versions of this manuscript: Sarah Bodenstein, Weldon Danos, Anne Dugas, Albert “Rusty” Gaudé, Jim Gossen, Rusty Grice, Boris Guerrero, Marcos Guerrero, Nathan Herring, Jody Houck, Thomas Hymel, Gregory Lutz, J.T. McKissack, Earl Melancon, Kim Montie, Chris Nelson, Ralph (Wood) Oglesby, Ryan Prewitt, Vicky Pruente, Jason Rider, Elizabeth Robinson, Kevin Savoie, Dominique Seibert, Leslie Sturmer, John Supan, Beth Walton, and Bill Walton. This work was conducted and funded by the Louisiana State University Sea Grant College Program while Petrolia held the Laborde Endowed Chair for Sea Grant Research and Technology Transfer in 2023.
Disclosure statement
No potential conflict of interest was reported by the author(s).
Additional information
Funding
References
- Banks, P., Beck, S., Chapiesky, K., & Isaacs, J. (2016). Louisiana oyster fishery management plan, Louisiana department of wildlife and fisheries. Office of Fisheries, Updated November, 23, 2106.
- Barrett, L. T., Theuerkauf, S. J., Rose, J. M., Alleway, H. K., Bricker, S. B., Parker, M., Petrolia, D. R., & Jones, R. C. (2022). Sustainable growth of non-fed aquaculture will generate valuable ecosystem benefits. Ecosystem Services, 53, 101396. https://doi.org/10.1016/j.ecoser.2021.101396
- Beck, M. W., Brumbaugh, R. D., Airoldi, L., Carranza, A., Coen, L. D., Crawford, C., Defeo, O., Edgar, G. J., Hancock, B., Kay, M. C., Lenihan, H. S., Luckenbach, M. W., Toropova, C. L., Zhang, G., & Guo, X. (2011). Oyster reefs at risk and recommendations for conservation, restoration, and management. BioScience, 61(2), 107–116. https://doi.org/10.1525/bio.2011.61.2.5
- Bodenstein, S., Walton, W. C., & Steury, T. D. (2021). Effect of farming practices on growth and mortality rates in triploid and diploid eastern oysters. Aquaculture Environment Interactions, 13, 33–40. https://doi.org/10.3354/aei00387
- Botta, R., Asche, F., Borsum, J. S., & Camp, E. V. (2020). A review of global oyster aquaculture production and consumption. Marine Policy, 117, 103952. https://doi.org/10.1016/j.marpol.2020.103952
- Botta, R., Garlock, T., Asche, F., Camp, E. V., & Ropicki, A. (2023). The value of product attributes for farmed oysters: A hedonic price analysis of US restaurant menus. Journal of the Agricultural and Applied Economics Association, 2(2), 295–305. https://doi.org/10.1002/jaa2.58
- Bureau of Transportation Statistics. (2023). Average Cost of Owning and Operating an Automobile. Excel Dataset. U.S. Department of Transportation. https://www.bts.gov/content/average-cost-owning-and-operating-automobilea-assuming-15000-vehicle-miles-year.
- Coastal Protection and Restoration Authority (CPRA). (2022). Monitoring and adaptive management plan for the mid-Barataria sediment diversion project (CPRA Project Number BA-0153), (pp. 145). CPRA.
- Dame, R., Sturmer, L. N., Adams, C. M., Weldon, R., & Grogan, K. A. (2019). Financial risk in off-bottom oyster culture along Florida’s West Coast. Food and Resource Economics Department, IFAS Extension, University of Florida, Document FE1017, September, https://edis.ifas.ufl.edu/publication/FE1070.
- Energy Information Agency (EIA). (2023). Gulf Coast (PADD 3) gasoline and diesel retail prices. https://www.eia.gov/dnav/pet/pet_pri_gnd_dcus_r30_a.htm.
- Engle, C. R., & van Senten, J. (2018). Economic analysis of oyster production in Maryland. https://repository.library.noaa.gov/view/noaa/37917.
- Engle, C., van Senten, J., Parker, M., Webster, D., & Clark, C. (2021). Economic tradeoffs and risk between traditional bottom and container culture of oysters on Maryland farms. Aquaculture Economics & Management, 25(4), 472–503. https://doi.org/10.1080/13657305.2021.1938295
- Grice, R., & Tarnecki, A. (2022). Alabama shellfish aquaculture situation & outlook report: Production year 2021. Alabama Cooperative Extension Report ANR–2915 and MS–AL Sea Grant Publication MASGP–22–036, August. https://www.aces.edu/wp-content/uploads/2022/08/ANR-2915_AlabamaShellfishAquacultureReport2021_081722L.pdf.
- Grice, R., & Tarnecki, A. (2023). Alabama shellfish aquaculture situation & outlook report: Production year 2022. Alabama Cooperative Extension Report ANR–2997 and MS–AL Sea Grant Publication MASGP–23–029, revised April 2023. https://www.aces.edu/wp-content/uploads/2022/08/ANR-2997_AlabamaShellfishAquacultureReport2022_041723L-G.pdf
- Grice, R., & Walton, W. (2019). Alabama Cooperative Extension Report ANR–2674 and MS–AL Sea Grant Publication MASGP–19–026, September. https://www.aces.edu/wp-content/uploads/2020/09/ANR-2674-Ala-Shellfish-Aquaculture-Report-2019_090120L-G.pdf.
- Grice, R., & Walton, W. (2019). Alabama shellfish aquaculture situation & outlook report 2018. Alabama Cooperative Extension Report ANR–2467 and MS–AL Sea Grant Publication MASGP–19–026, July. https://www.aces.edu/wp-content/uploads/ 2020/04/ANR-2467_Shellfish_Aquaculture_2018-Report_082319L-G.pdf.
- Grice, R., & Walton, W. (2020). Alabama Shellfish Aquaculture Situation & Outlook Report: Production Year 2019. Alabama Cooperative Extension Report ANR–2674 and MS–AL Sea Grant Publication MASGP–19–026, September. https://www.aces.edu/wp-content/uploads/2020/09/ANR-2674-AlaShellfish-Aquaculture-Report-2019_090120L-G.pdf.
- Herbst, E., Pedigo, S., L, T., Sturmer, L., Grice, R., Rider, J., Callam, B., & Marquez, M. (2022). Oyster south symposium state update. Presented at the 2022 Oyster South Symposium, April 5-7, Biloxi, MS.
- Hill, K., & Collins, W. (2024). State shellfish aquaculture funding programs: Example and options for Georgia’s oyster farming industry. University of Georgia Sea Grant. https://gacoast.uga.edu/wp-content/uploads/2024/03/2401-jamestown-state-funding-programs-shellfish-farming-jan30-508.pdf.
- Hudson, K. (2017). Virginia shellfish aquaculture situation and outlook report: Results of the 2016 Virginia shellfish aquaculture crop reporting survey. VIMS Marine Resource Report No. 2017-07. Virginia Institute of Marine Science, College of William and Mary. https://doi.org/10.21220/V51K6T
- Hudson, K. (2018). Virginia shellfish aquaculture situation and outlook report: Results of the 2017 Virginia shellfish aquaculture crop reporting survey. VIMS Marine Resource Report No. 2018-9, Virginia Sea Grant VSG-18-3, https://doi.org/10.25773/jc19-y847
- Hudson, K. (2019). Virginia shellfish aquaculture situation and outlook report: Results of the 2018 Virginia shellfish aquaculture crop reporting survey. VIMS Marine Resource Report No. 2019-8, Virginia Sea Grant VSG-19-2, https://doi.org/10.25773/jc19-y847
- Hudson, K., & Murray, T. J. (2014). Virginia shellfish aquaculture situation and outlook report: Results of the 2013 Virginia shellfish aquaculture crop reporting survey. VIMS Marine Resource Report No. 2014-05, Virginia Sea Grant Publication No. VSG-14-02. Virginia Institute of Marine Science, College of William and Mary. https://doi.org/10.21220/V52X4T
- Hudson, K., & Murray, T. J. (2015). Virginia shellfish aquaculture situation and outlook report: Results of the 2014 Virginia shellfish aquaculture crop reporting survey. VIMS Marine Resource Report No. 2015-03, Virginia Sea Grant Publication No. VSG-15-01. Virginia Institute of Marine Science, College of William and Mary. https://doi.org/10.21220/V56Q74
- Hudson, K., & Murray, T. J. (2016). Virginia shellfish aquaculture situation and outlook report: Results of the 2015 Virginia shellfish aquaculture crop reporting survey. VIMS Marine Resource Report No. 2016-4. Virginia Institute of Marine Science, College of William and Mary. https://doi.org/10.21220/V5BD8N
- Hudson, K., Kauffman, D., & Murray, T. J. (2013). Cultchless (Single-Seed) oyster crop budgets for Virginia: 2013 User manual. Publication AAEC-40P, Virginia Cooperative Extension, Virginia Tech and Virginia State University. https://ncseagrant.ncsu.edu/wp-content/uploads/2019/09/L10_Budget-Tool_User-Manual.pdf.
- Johnson, J. (2018). Farm machinery cost calculations. Publication 3543 (POD-10-20), Mississippi State University Extension Service. https://extension.msstate.edu/sites/default/files/publications/publications/P3543_web.pdf.
- Johnson, T. (2011). Saving fuel on your recreational or charter boat. Alaska Sea Grant Marine Advisory Program ASG-56. https://seagrant.uaf.edu/bookstore/pubs/ASG-56.html.
- Keithly, W. R., & Kazmierczak, R. F. (2006). Economic analysis of oyster lease dynamics in Louisiana. Report to the Louisiana Department of Natural Resources, October 1.
- Louisiana’s Seafood Future. (2023). Alternative oyster culture: LSG statement of purpose. https://www.laseafoodfuture.com/lsg-statement-purpose.
- Maxwell, V. J., & Supan, J. E. (2010). Economic analysis of off-bottom oyster culture for triploid Eastern oyster, Crassostrea virginica, culture in Louisiana. World Aquaculture, 41(1), 9–14.
- Melancon, E. (2023). AOC in Louisiana present status & future needs. Presentation Given to CPRA and LDWF, April 17, 2023.
- Moor, J., Ropicki, A., Anderson, J. L., & Asche, F. (2022). Stochastic modeling and financial viability of mollusk aquaculture. Aquaculture, 552, 737963. https://doi.org/10.1016/j.aquaculture.2022.737963
- Murray, T. J., & Hudson, K. (2011). Virginia shellfish aquaculture situation and outlook report: Results of the 2010 Virginia shellfish aquaculture crop reporting survey. VIMS Marine Resource Report No. 2011-11, Virginia Sea Grant Publication No. VSG-11-06. Virginia Institute of Marine Science, College of William and Mary. https://doi.org/10.21220/V5TD80
- Murray, T. J., & Hudson, K. (2012). Virginia shellfish aquaculture situation and outlook report: Results of the 2011 Virginia shellfish aquaculture crop reporting survey. VIMS Marine Resource Report No. 2012-04, Virginia Sea Grant Publication No. VSG-12-07. Virginia Institute of Marine Science, College of William and Mary. https://doi.org/10.21220/V5PQ7G
- Murray, T. J., & Hudson, K. (2013). Virginia shellfish aquaculture situation and outlook report: Results of the 2012 Virginia shellfish aquaculture crop reporting survey. VIMS Marine Resource Report No. 2013-02, Virginia Sea Grant Publication No. VSG-13-02. Virginia Institute of Marine Science, College of William and Mary. https://doi.org/10.21220/V5Z71V
- Murray, T. J., & Oesterling, M. J. (2006). Virginia shellfish aquaculture situation and outlook report: Results of the 2004-2006 Virginia shellfish aquaculture crop reporting survey. VIMS Marine Resource Report No. 2006-5, Virginia Sea Grant Publication No. VSG-06-06. Virginia Institute of Marine Science, College of William and Mary. https://doi.org/10.21220/V52123
- Murray, T. J., & Oesterling, M. J. (2007). Virginia shellfish aquaculture situation and outlook report: Results of the 2005-2007 Virginia shellfish aquaculture crop reporting survey. VIMS Marine Resource Report No. 2006-5, Virginia Sea Grant Publication No. VSG-06-06. Virginia Institute of Marine Science, College of William and Mary. https://doi.org/10.21220/V55Q7T
- Murray, T. J., & Oesterling, M. J. (2008). Virginia shellfish aquaculture situation and outlook report: Results of the 2007 Virginia shellfish aquaculture crop reporting survey. VIMS Marine Resource Report No. 2008-2, Virginia Sea Grant Publication No. VSG-08-02. Virginia Institute of Marine Science, College of William and Mary. https://doi.org/10.21220/V59H8C
- Murray, T. J., & Oesterling, M. J. (2009). Virginia shellfish aquaculture situation and outlook report: Results of the 2008 Virginia shellfish aquaculture crop reporting survey. VIMS Marine Resource Report No. 2009-5, Virginia Sea Grant Publication No. VSG-09-04. Virginia Institute of Marine Science, College of William and Mary. https://doi.org/10.21220/V5F716
- Murray, T. J., & Oesterling, M. J. (2010). Virginia shellfish aquaculture situation and outlook report: Results of the 2009 Virginia shellfish aquaculture crop reporting survey. VIMS Marine Resource Report No. 2010-6, Virginia Sea Grant Publication No. VSG-10-03. Virginia Institute of Marine Science, College of William and Mary. https://doi.org/10.21220/V5JX45
- NerdWallet. (2023). SBA Loan Rates 2023. Retrieved August 7, 2023, from https://www.nerdwallet.com/article/small-business/sba-loan-rates.
- NOAA Fisheries. (2023). Commercial fisheries landings. https://www.fisheries.noaa.gov/foss/f?p=215:240:4422088353212::NO:::.
- Parker, M. (2023). Maryland oyster aquaculture industry summary. https://lookerstudio.google.com/reporting/03f76a85-980f-4b5b-b308-f4ffa938ce8f/page/p_e8ar2gwt6c?s=llZNhdMkel4.
- Parker, M., Lipton, D., & Harrell, R. M. (2020). Impact financing and aquaculture: Maryland oyster aquaculture profitability. Journal of the World Aquaculture Society, 51(4), 874–895. https://doi.org/10.1111/jwas.12702
- Perkins-Veazie, P. (2012). Mobile refrigeration trailer for N.C. farmers. Plants for Human Health Institute, NC State University. https://plantsforhumanhealth.ncsu.edu/wp-content/uploads/sites/127/2015/06/PackNCool-Manual2.pdf.
- Petrolia, D. R. (2018). An Assessment of market feasibility for oysters produced using the nature conservancy’s proposed production system. Report prepared for The Nature Conservancy - Louisiana.
- Petrolia, D. R. (2022). Economic assessment of a Mississippi oyster shell recycling program. Report prepared for The Nature Conservancy – Mississippi.
- Petrolia, D. R. (2023). Economic analysis of alternative oyster culture (AOC) in Louisiana. Report prepared for Louisiana Sea Grant College Program, Louisiana State University. https://www.laseagrant.org/wp-content/uploads/AOC-Econ-Report-Petrolia-Aug15-2023-Final.pdf.
- Petrolia, D. R., Nyanzu, F., Cebrian, J., Harri, A., Amato, J., & Walton, W. C. (2020). Eliciting expert judgment to inform management of diverse oyster resources for multiple ecosystem services. Journal of Environmental Management, 268, 110676. https://doi.org/10.1016/j.jenvman.2020.110676
- Petrolia, D. R., Walton, W. C., & Cebrian, J. (2022). Oyster economics: Simulated costs, market returns, and nonmarket ecosystem benefits of harvested and non-harvested reefs, off-bottom aquaculture, and living shorelines. Marine Resource Economics, 37(3), 325–347. https://doi.org/10.1086/719969
- Petrolia, D. R., Walton, W. C., & Yehouenou, L. (2017). Is there a market for branded Gulf of Mexico oysters? Journal of Agricultural & Applied Economics, 49(1), 45–65.
- Pruente, V., Grice, R., & Chaplin, G. (2023). Estimating farm size and gear costs for commercial oyster aquaculture calculator. ANR-2999, Alabama Cooperative Extension System, Auburn University, and Mississippi-Alabama Sea Grant. https://www.aces.edu/blog/topics/coastal-programs/estimating-farm-size-and-gear-costs-for-commercial-oyster-aquaculture-calculator/.
- Small Business Administration (SBA). (2023). Terms, conditions, and eligibility. https://www.sba.gov/partners/lenders/7a-loan-program/terms-conditions-eligibility#id-interest-rates.
- Store It Cold LLC. (2021). CoolBot trailer construction guide: DIY trailer walk-in cooler, Rev 2021-07A. https://storeitcold.com/wp-content/uploads/2020/03/DIY-Trailer-Guide-2023-06A.pdf.pdf.
- Sturmer, L. N., Kane, A. S., Philips, E. J., Erik, L., Holden, H., & Natalie, A. (2022). Addressing oyster mortalities in Florida’s off-bottom oyster aquaculture industry. Final Report Covering June 2020-December 2021, UF-IFAS Support for Emerging Enterprise Development Integration Teams (SEEDIT) Program. https://shellfish.ifas.ufl.edu/wp-content/uploads/Oyster-Culture-SEEDIT-Final-Report-3.07.22-compressed.pdf.
- Sturmer, L., Cyr, C., & Markham, R. (2018). Application of triploidy to an emergent oyster culture industry on Florida’s Gulf Coast: Results of growers’ trials. UF-IFAS Workshops, May 3–4, 2018, St. Teresa and Cedar Key, FL. http://shellfish.ifas.ufl.edu/wp-content/uploads/Growers-Trials-for-Workshops_reduced-size.compressed.pdf.
- U.S. Army Corps of Engineers (USACE). (2022). Final environmental impact statement for the proposed mid-barataria sediment diversion project, Plaquemines Parish, Louisiana. USACE New Orleans District, Prepared by G.E.C. Inc., September 2022.
- U.S. Bureau of Economic Analysis. (2024). Gross domestic product (implicit price deflator) [A191RD3A086NBEA]. FRED, Federal Reserve Bank of St. Louis. https://fred.stlouisfed.org/series/A191RD3A086NBEA.
- Wadsworth, P. C. (2018). Comparing triploid and diploid growth and mortality in farmed oysters, Crassostrea virginica, in the Northern Gulf of Mexico. [Master’s thesis, School of Fisheries, Aquaculture and Aquatic Sciences]. Auburn University.
- Walton, B. (2021). Planting your first crop. Lecture included in the Online Oyster Culture Course, University of Florida. https://shellfish.ifas.ufl.edu/news/the-online-oyster-culture-course-is-available-now/.
- Walton, B., Davis, J., Chaplin, G., Scott Rikard, F., LaDon Swann, D., & Hanson, T. (2012). Gulf coast off-bottom oyster farming gear types. MASGP Publication No. 12-013-04. https://shellfish.ifas.ufl.edu/wp-content/uploads/Off-bottom-Oyster-Culture-Gear-Types.pdf.
- Walton, W. C., Rikard, F. S., Chaplin, G. I., Davis, J. E., Arias, C. R., & Supan, J. E. (2013). Effects of ploidy and gear on the performance of cultured oysters, Crassostrea virginica: Survival, growth, shape, condition index and Vibrio abundances. Aquaculture, 414–415, 260–266. https://doi.org/10.1016/j.aquaculture.2013.07.032
Appendix
Figure A1. Annual cost by cost category for four production levels.
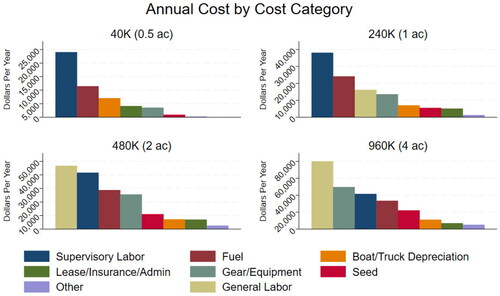
Figure A2. Estimated average break-even price for 100, 150, and 200 oysters per bag, under Best (Top), Moderate Loss (Center), and Severe Loss (Bottom) mortality cases.
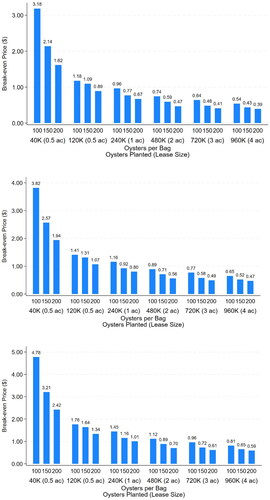
Table A1. Summary of key production assumptions.
Table A2. Estimated capital costs and annual depreciation for one line of floating bags.
Table A3. Estimated labor hours required, based on number of oysters planted.