
ABSTRACT
A set of 12,436 papers published in 20 GIScience journals in the period 2000–2014 were analysed to extract publication patterns and trends. This comprehensive scientometric study focuses on multiple aspects: output volume, citations, national output and efficiency (output adjusted with econometric indicators), collaboration, altmetrics (Altmetric score, Twitter mentions, and Mendeley bookmarking), authorship, and length. Examples of notable observations are that 5% countries account for 76% of global GIScience output; a paper published 15 years ago received a median of 12 citations; and the share of international collaborations in GIScience has more than tripled since 2000 (31% papers had authors from multiple countries in 2014, an increase from 10% in 2000).
1. Introduction
Geographical information science (GIScience) is a rapidly evolving discipline with thousands of papers spread over dozens of journals and conferences. As a result of the growing number of publications, it is increasingly difficult to keep up with trends. An approach to understand patterns and to evaluate the impact of scientific publications is to employ techniques established by scientometrics, a discipline dealing with quantitative aspects of science and technology (Hood and Wilson Citation2001, Pouris Citation2012). While many scientometric studies have been carried out in other disciplines (Section 2), this work identifies that GIScience lacks a comprehensive analysis. The goal of this paper is to bridge this gap by using scientometric techniques to conduct a comprehensive, longitudinal, and systematic survey study on the GIScience research production in the last 15 years (period 2000–2014).
The paper first presents a list of prominent GIScience journals to draw a large sample of papers that represent the relevant GIScience body (Section 3). This task has been hampered by the fact that GIScience is not a homogenous and strictly defined discipline, and that there is no consensus among GIScience researchers about the relevant publication outlets. This list can also be considered as a by-product of this study.
The analysis provides several insights which may aid GIScience researchers, educational institutions, and policymakers in understanding the development of the field. Several aspects are investigated, mostly by employing conventional methods (Section 4), such as:
How many papers are published in relevant GIScience journals, and is their annual output increasing?
How are publications distributed among countries, and which countries are currently producing most papers? How do countries perform when demographic or econometric indicators are taken into account?
How much attention do GIScience papers receive in social media, how does that compare to other disciplines, and do highly mentioned papers capitalise this attention in citations?
How many publications are a result of an international collaboration, and which entities collaborate most? Do countries with more experience in international collaboration tend to produce papers with a higher impact?
What are the most cited papers in GIScience, and which papers are most frequently found in researchers’ collections? Is there a correlation between the two?
2. Related work
Several similar studies have been carried out in other disciplines, for example, cloud computing (Heilig and Voß Citation2014), neurology (Garnett et al. Citation2013, Gupta et al. Citation2014), dentistry (Yang et al. Citation2001), human geography (Wang and Liu Citation2014), alternative medicine (Chiu and Ho Citation2005), epidemiology (Dannenberg Citation1985, Ugolini et al. Citation2007), remote sensing (Zhuang et al. Citation2013, Peng et al. Citation2015), nursing (Estabrooks et al. Citation2004), clinical radiology (Rahman et al. Citation2005), knowledge management (Gu Citation2004, Serenko and Bontis Citation2004), economics and business (Nederhof and van Raan Citation1993, De Bakker et al. Citation2005), tourism (Michael Hall Citation2011), wastewater research (Zheng et al. Citation2015), genetics (Sangam et al. Citation2013), and earthworm research (Xiang et al. Citation2015).
While evaluating science has been thoroughly addressed in many disciplines, to the best of my knowledge, there is a lack of a general and comprehensive scientometric study in GIScience. This paper aims to carry out a thorough scientometric analysis focusing on multiple aspects, with an addition of altmetric indicators.
It is beneficial to mention other scientometric and bibliometric work related to GIScience, mostly focused on a specific publication aspect.
Tian et al. (Citation2008) record all 1997–2006 papers in journals indexed by the Institute for Scientific Information (ISI) that contain the term GIS in the title, abstract, or keywords. The research indicates that the journal with most such occurrences is the International Journal of Geographical Information Science. However, their work is too liberal on the inclusion criterion: it does not distinguish between GIScience papers and those that only use GIS as a tool, considering that the analysis includes 1918 journals belonging to all 202 different discipline categories determined by ISI. This paper is focused on GIScience, taking into account only well-established and well-known sources that publish predominantly GIScience research papers (Section 3).
Parr and Lu (Citation2010) present a study on trends and patterns of research activities in GIScience in the period 1997–2007, for example, connections between GIScience researchers and the productivity of departments within several research themes. Sun and Manson (Citation2011) carry out a scientometric social network analysis to explore the authorship aspect of GIScience papers, for example, degree of connected authors and number of multiauthor papers. Wei et al. (Citation2015) mapped the GIS knowledge domain by identifying the most important papers and analysing how GIScience research interests evolve over time. Skupin (Citation2014) and Zhan et al. (Citation2014) conduct scientometric studies on the impact of the work of Professor David M. Mark, a renowned GIScientist. Old (Citation2001) investigates the use of spatial analysis in scientometrics. Caron et al. (Citation2008) and Kemp et al. (Citation2013) present ranked inventories of GIScience journals (more on these initiatives in the next section). Blaschke and Eisank (Citation2012) carry out a scientometric analysis on the relation of terms GIScience and GIS in literature. Stojanovski et al. (Citation2015) investigate the coverage of mapping science journals by 14 bibliographic databases, such as Web of Science and Scopus. Gutiérrez and López-Nieva (Citation2001) study the internationalisation of journals in geography, which is relevant considering that the work covers a few journals that might be of interest to GIScientists. Duckham (Citation2015) uses a citation and keyword analysis to identify a shared core of GIScience expertise.
3. Methodology
3.1. Selecting GIScience journals
Since it is not possible to capture all GIScience literature that exists, relevant GIScience journals should be selected and their inclusion is an important part of the methodology. Although scientometric analyses may be applied to any type of publication, analyses such as this one usually consider only journals for consistency. Conference proceedings are excluded also for technical reasons (e.g. occurrence at irregular intervals, not all proceedings of the same series are indexed, and difficulties with retrieving data). This should by no means imply the depreciation of the importance and contribution of papers published in GIScience conferences.
Before going into more details in the selection of GIScience journals, an overview of encountered barriers is given, followed by related work:
GIScience is nonhomogeneous, multidisciplinary, without clear boundaries, and arguably without an authoritative definition. This uncertainty propagates to defining what is exactly a GIScience journal (Caron et al. Citation2008), and a consensus on the list of GIScience journals cannot be reached (Kemp et al. Citation2013). There have been several discussions on the demarcation of GIScience (Goodchild Citation1992, Citation2009, Wright et al. Citation1997, Mark Citation2003, Reitsma Citation2013), and such deliberations have been taken into account.
ISI does not contain a GIScience discipline category, thus the usual approach of scientometric researchers (e.g. Dong et al. Citation2006, Yu et al. Citation2006, Amat Citation2008, Sugimoto et al. Citation2013) who select the corresponding ISI category cannot be used. For instance, GeoInformatica, without debate a GIScience journal, is assigned to two categories: (i) computer science/information systems and (2) geography/physical; most of the journals in these two categories are not related to GIScience.
GIScientists publish also in journals in other disciplines (Kuhn and Brox Citation2011). For example, journals Building and Environment and Computers & Graphics have published papers that can be considered in the scope of GIScience (e.g. see Tashakkori et al. Citation2015 and Germs et al. Citation1999, respectively), but that does not categorise them as GIScience journals. It is uncertain where to place a threshold on how many such papers a journal has to publish in order to be considered a GIScience source (and is such a thing possible considering that the term GIScience paper is also fuzzy).
Multidisciplinary journals are interesting to mention as a relatively new uncertainty. For instance, PLOS ONE has published a number of GIScience papers (e.g. Kang et al. Citation2015). They are not considered since their inclusion would bias the results.
Deriving a list of relevant journals in GIScience and related fields has already been an effort of several researchers. An early example is the work of Salichtchev (Citation1979) who compiled a list of cartographic-geodetic journals.
The study of Caron et al. (Citation2008) ranks several GIScience journals based on a survey, and it provides an important foundation for this research. The ranking contains 21 ISI and 23 non-ISI journals, which have been selected by an international questionnaire. The list is generous with the notion of a GIScience journal; hence, arguably less related journals have been included.
Kemp et al. (Citation2013) carry out a similar study, resulting in journals grouped in a few categories that reflect their reputation in the GIScience community. Researchers conclude their survey by stating that they have not reached a consensus among GIScientists about the list and ratings of journals.
Frančula et al. (Citation2013b) have derived an extensive list of 105 mapping journals. A journal was considered relevant to mapping sciences if more than half of its contents covered at least one branch of geodesy (cartography, photogrammetry and remote sensing, marine, satellite and physical geodesy, applied geodesy and geomatics). While the list is not focused on GIScience, it has been carefully considered. In a succeeding research, Frančula et al. (Citation2013a) expose 35 non-mapping ISI journals which could be of interest to mapping scientists. The link was established through checking the Aims and Scope of a journal, and by searching titles published in each journal 3 years prior to the research. The research lists 5 journals that could be of interest to GIScientists, and these have been taken into account.
Duckham (Citation2015) identifies four core (leading) GIScience journals which have been included in this research. Furthermore, the research points out that determining the corpus of GIScience journals is inevitably subjective, owing to increasingly blurred lines between disciplines.
The research of Gutiérrez and López-Nieva (Citation2001) focuses on geography, but it contains a few journals that are of interest in the scope of this work.
Finally, it is important to note that a few research groups maintain lists of preferred GIScience journals on their websites. For instance, my research group at the TU Delft curates a public listFootnote1 of journals that we consider when preparing a manuscript. Such listsFootnote2 have also been found as valuable input when selecting the journals.
As it can be expected, there are significant discrepancies between all the analysed inventories, hence an authoritative list of GIScience journals that can be borrowed for this research does not exist. Analysing related work revealed that there is a consensus about only a few core GIScience journals, but restricting this analysis to such small set of journals would not be interesting. Furthermore, within this project, several attempts have been made to derive objective criteria for the selection of journals, but without success, mostly due to the indistinct demarcation of GIScience and mixed content of journals (e.g. journals that publish GIScience papers along with papers from other geomatics disciplines such as hydrography). Consequently, it was decided to derive a new list of journals by combining inventories found in related work, with some modifications (e.g. exclusion of predominantly remote sensing journals).
As this part of the methodology cannot be considered as exact science, one should accept some subjectivity and personal choice here. Many researchers in related scientometric analyses (Section 2) confronted with the same problem take a degree of liberty in the selection of journals they consider to represent a discipline, hence this approach is in line with scientometric practices. Furthermore, the aforementioned related research papers, despite some of them using scientific methodologies (e.g. the Delphi method), are inherently based on personal preference.
Nevertheless, the obtained list of journals has a high degree of overlap with the results of related work, and it captures a large share of GIScience output which is adequately significant and sufficiently large to draw conclusions:
Annals of the Association of American Geographers (AAG)
Cartography and Geographic Information Science (CaGIS)
Computers & Geosciences (C&G)
Computers, Environment, and Urban Systems (CEUS)
Environment and Planning B: Planning and Design (EPB)
Geographical Analysis (GEAN)
GeoInformatica (GEIN)
GIScience & Remote Sensing (G&RS)Footnote3
International Journal of Applied Earth Observation and Geoinformation (JAG)
International Journal of Digital Earth (IJDE)
International Journal of Geographical Information Science (IJGIS)
ISPRS International Journal of Geo-Information (IJGI)
ISPRS Journal of Photogrammetry and Remote Sensing (P&RS)
Journal of Geographical Systems (JGS)
Journal of Spatial Information Science (JOSIS)
Journal of Spatial Science (JSS)
Photogrammetric Engineering & Remote Sensing (PE&RS)
Photogrammetrie, Fernerkundung, Geoinformation (PFG) [Journal of Photogrammetry, Remote Sensing and Geoinformation Processing]
Spatial Cognition & Computation (SCC)
Transactions in GIS (TGIS)
A few selected journals are not principally GIScience outlets. An example is the ISPRS Journal of Photogrammetry and Remote Sensing (P&RS). As the title suggests, it is focused towards photogrammetry and remote sensing; however, it has been known to have published a significant amount of relevant GIScience papers in the past. For instance, the papers of Gröger and Plümer (Citation2012) and Boguslawski et al. (Citation2011) are works of arguably high relevance to the GIScience community that have been published in P&RS (moreover, both papers have received the best paper award in the year they were published (see Vosselman Citation2012 and Lichti Citation2013, respectively, for details). Therefore, overlooking such sources of GIScience literature would not be just.
3.2. Acquisition of data
Data of papers have been retrieved from Scopus through its application programming interface (API). Scopus includes citations from a wide range of publications, which gives a comprehensive picture about the impact of papers. For each paper, data such as digital object identifier (DOI), Scopus citation count, and affiliations were retrieved. Altmetrics data (explained in more detail in Section 4) were acquired through the APIs of Altmetric and Mendeley. All data were collected on 23 September 2015.
There are some exceptions caused by limitations: (1) IJGI is not yet included in Scopus and (2) volumes of IJDE published in 2008 and 2009 are not indexed by Scopus. These volumes were supplemented from the publishers’ records. Since a large part of the methodology presented in this paper relies on data from Scopus (e.g. received citations and affiliations of authors), most of the analyses do not cover IJGI and IJDE papers published in 2008 and 2009. These two exceptions amount to 1.6% of the total number of analysed papers.
3.3. Selection of papers
All papers included in journal issues published from 2000 to 2014 were considered, except records such as book reviews, corrigenda, list of reviewers, etc. Furthermore, only papers with a cover date in the range 2000–2014 were considered. Therefore, an additional filter was set to disregard papers that are not yet published in an issue (i.e. ‘in press’, ‘ahead of print’).
3.4. Normalising the output and citations
Most of the analyses presented in this paper deal with comparing the number of papers and the citations with several other indicators. Here it is important to clarify different measures that are used in this study.
In general, multiauthor and multinational contributions constitute a problem in measuring the scientific output as there are different approaches to allocating credits (Nederhof and Moed Citation1993, Kim and Kim Citation2015). For instance, a multinational publication authored by three people with addresses in three countries can be credited as one publication to each, or as a third per each country/author. In fact, there are many different approaches to calculate the researcher’s (or country’s) number of publications, for example, assigning one full score to each author, assigning a score only to the first author, distributing a fractional score to each author, and assigning a different score based on the order of authors (Cole and Cole Citation1981, Van Hooydonk Citation1997, Egghe et al. Citation2000). Unless noted otherwise, in this paper, fractional counting is used, that is, the scores are uniformly distributed among participating authors and affiliations.
The multitude of different approaches to credit contributions entails different approaches to account the received citations. The citations are treated in the same manner, unless noted otherwise. For instance, a citation to a paper originating from three countries is credited as a third of a citation for each.
This is not the only uncertainty when it comes to citations. Citation takes time, and age significantly influences the number of citations per publication. Therefore, it is meaningless to directly compare citations of two papers published with a significant temporal distance (e.g. one published in 2013 and other in 2000). In order to suppress this chronological bias, in some instances, the normalised citation impact index (NCII) is used: the number of citations of a publication is divided by its age in years (Serenko and Bontis Citation2004). This measure gives a more realistic view on the impact and contribution of a paper not misrepresented by its age.
Furthermore, in analyses such as this one, it is a practice to exclude self-citations, as they introduce bias in measuring the impact of a publication (MacRoberts and MacRoberts Citation1989, Glänzel and Thijs Citation2004a). A self-citation is defined as a citation in which the citing and the cited paper have at least one author in common (Aksnes Citation2003, Hyland Citation2003). All citation counts and analyses presented in this study exclude self-citations.
Finally, due to the usually skewed distribution of citations, medians are computed instead of means when giving aggregated results, for example, average number of citations per paper. This topic has been discussed in Calver and Bradley (Citation2009) and Vaughan and Shaw (Citation2008).
4. Analysis and findings
The number of analysed papers, that is, those that satisfy the criteria in Section 3.3, is 12,436.
The quantitative results are presented in a series of tables and figures, which are divided into different categories, such as journals, national aspect, and authorship to describe statistics of publications within a journal, country, etc. Some findings are given only graphically because of the limited space. Furthermore, in order to compact the results, some results are given together in tables but are discussed disjointedly.
4.1. Output and impact of the selected journals
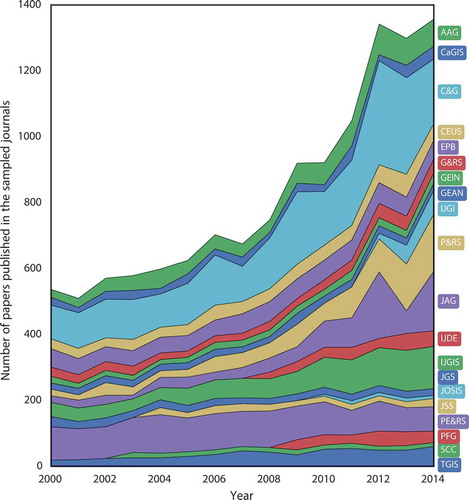
and show the volume of papers in the observed period, decomposed by the year of publication. Output has grown since 2000 – it has more than doubled. The number of journals increased, but that is not the sole factor of the growth of the output – many journals publish more papers than before. It appears that the output reached its peak in 2012 and in the last two years the volume fluctuated less than in the period from 2000 to 2012 (notice the surge from 2011 to 2012).
Table 1. GIScience output of selected journals and impact by year.
Figure 1. Publication output by the covered GIScience journals during the 15-year period analysed by the study.
Papers published in these 15 years have so far attracted 177,054 citations, as tracked by Scopus. The median number of citations per paper is 5, and when normalised with its age, it corresponds to a median NCII of 1.0 (the means are 14.5 and 2.1, respectively, indicating the skewness of the distribution of citations, and hence promoting the use of medians).
4.2. Journals
and decompose the output volume by journal. The first observation is that journals substantially differ in the number of papers published (e.g. a fifth of papers have been published in C&G), and also their output may not be stable (cf. JAG in 2012 and 2013). Furthermore, new journals (e.g. PFG and IJGI) are quick in attracting a number of papers comparable to journals with a longer tradition (e.g. in its inception in 2009, PFG published 31 papers in comparison to 22 of the long-running GEIN). The introduction of new journals which have quickly attained a noticeable share indicates the strong supply of GIScience papers in the past few years.
Table 2. Output and impact by journal.
Besides the volume decomposed by journals, it is important to analyse the impact of a journal, that is, whether the share of received citations follows the share of published papers. In relation to this, it is interesting to investigate how mean citations correspond to the impact factor (IF), considering that the relation between IFs and citations has been weakening in the past 25 years (Lozano et al. Citation2012). contains the share of citations with the meanFootnote4 NCII per paper. It shows that there are deviations between the two values. AAG has the most favourable ratio between the share of citations and share of papers (it accounts to 11.3% of citations in comparison to 6.6% published papers). Since the selected journals do not constitute a closed system (Scopus tracks citations from thousands of other sources), favourable ratios might indicate a wider reach of journals. Such difference is to an extent reflected in the IF of the journal, but this study provides a longer period of analysis (in comparison with the 2-year window of the IF (Garfield Citation1972)), and a direct comparison between the share of papers and citations. It shows that journals with comparable IF might differ in the average number of citations they have received in the past; however, in general it follows the most recent IF (r = 0.658). IFs go up and down, and the average NCII per paper may give a more stable figure of the impact papers published in a journal have attained in the past.
4.3. A closer look on citations and impact
In this section, citations are examined in more detail. shows the distribution of citations per paper. To a degree, there is an inequality in citedness, since the top 1% cited papers account for 17.9% citations (31,753; percentile rank of score). The 99th percentile is at 133 citations.
Figure 2. Distribution of citations from publications indexed in Scopus. Papers that received more than 100 citations represent less than 2% of the population and are not shown here.
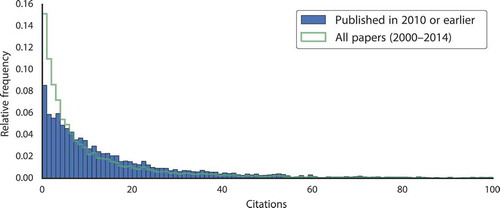
In order to differentiate between old and new papers (age bias), the histogram shows the distribution of mature papers (published in or before 2010) separately from all papers. Results indicate that 8.3% of such papers have not yet been cited. As a comparison, 24.7% new papers (published after 2010) are uncited.
While it is possible that there are GIScience sleeping beauties awaiting a delayed recognition, papers not cited in 15 years after publication are unlikely to ever receive a citation (Glänzel et al. Citation2003, van Raan Citation2004). The absence of citations differs substantially between disciplines (Ghosh Citation1975, Stern Citation1990, Schwartz Citation1997, Larivière et al. Citation2009, Egghe et al. Citation2011), and GIScience publications have a favourable result over most disciplines; for example, demographics where 24% papers are uncited after 10 years (Dalen and Henkens Citation2004). A closer look has been taken on uncited and seldom cited papers. Keywords of such papers have been analysed, and no pattern has been found, indicating that the uncitedness may not be topic related.
On a related note, the rate of self-citation for the sampled publications is 14.1% (cf. to general medicine at 6%, a cross-disciplinary average of 40%, and mathematics at 44% (Glänzel and Thijs Citation2004b, Kulkarni et al. Citation2011)).
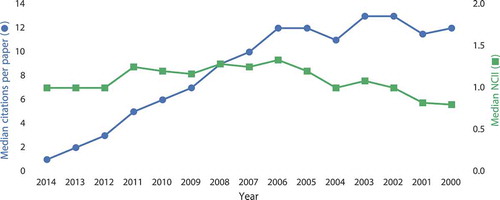
The citations have then been analysed by the year of publication. illustrates the average citedness per year of publication and reinforces the decision of using the NCII metric. Older papers are generally in a better position to accumulate more citations, and NCII attempts to remove the bias. Furthermore, the figure suggests that after 10 years, papers start to fall into disuse. Such obsolescence is a usual occurrence in other disciplines (Egghe and Ravichandra Rao Citation1992).
Figure 3. Mean number of Scopus citations for papers published in a year. Note that the x-axis is inverted to indicate ageing.
While most of the findings have been related with other disciplines, the citedness of GIScience papers is avoided to be compared to other disciplines, since the comparison between disciplines has been criticised and it is subject to significant bias (Abramo et al. Citation2012, Dorta-González and Dorta-González Citation2013).
Finally, outlines the most cited papers in the observed sample, ordered by NCII. Most of these papers have been featured in journals publishing remote sensing papers (i.e. PE&RS and P&RS), possibly manifesting a wider audience that such topics attain.
Table 3. Top 10 papers published in the covered journals in the observed period, ranked by the normalised received citations.
4.4. Origin of publications and national aspect
For each publication, the affiliation(s) of authors were recorded and allocated a publication score and citation. This section analyses the output by affiliation: city and country. The reason why cities rather than institutions (e.g. universities) have been used is that the affiliations are not consistent in the data set (e.g. universities may have multiple designations), and the most granular classification that is reliable is the level of a city. Such analysis is important for a number of reasons; for instance, the share of papers and citations of an affiliation (e.g. country) may indicate its contribution to GIScience, and their longitudinal development may give insights on the rate of the development of GIScience in a country.
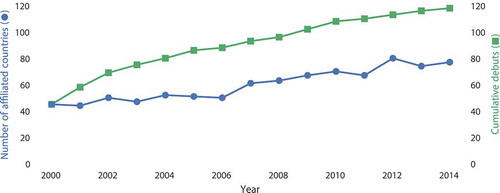
gives an overview of the international aspect: the number of countries behind publications per year. It shows that each year new countries debut, and also the number of participating countries is continuously increasing, suggesting the growth of internationalisation of GIScience.
Figure 4. Affiliated countries per year, and the appearance of new participants.
4.4.1. Total output and distribution
illustrates the output by country and city, and shows the temporal trend of the share of output by country and year. It is important to note that the ranking of cities does not represent the ranking of co-located universities because of the potential multiplicity. For instance, Beijing ranked first, but it hosts multiple universities, agencies, and state laboratories that are active in GIScience. However, such analysis may help identifying global GIScience centres.
Table 4. Top 15 countries and cities ranked by the number of published GIScience papers in the sample (fractional distribution), and a comparison with the share of received citations.
Figure 5. Longitudinal share of the output of the top 10 countries and the rest of the world.
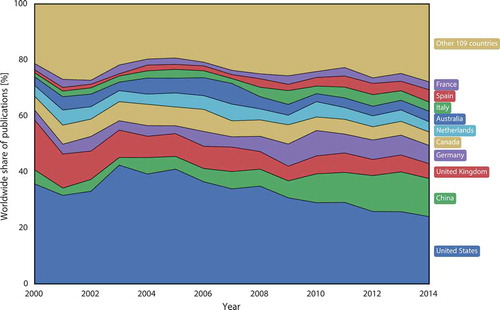
The data show that 10 countries dominate GIScience: they produce more than three quarters of the volume. This is in accordance with other disciplines (Chiu and Ho Citation2005). Furthermore, it shows some longitudinal differences between countries. The decreasing output share of the US (highest ranked) seems to be gradually compensated by China (2nd ranked).
However, note that while the share of some countries has dropped in the analysed period, this does not necessarily mean that the number of papers decreased in such cases, considering that the volume of papers is rising (cf. and , and see the trend in ); for instance, consider the example of the United States (since 2000–2014, drop in share from 36 to 24%, but rise in the number of publications by 69%). On the other hand, China’s output is rising substantially both absolutely and relatively (in the same period from 25.5 to 174 papers; i.e. 582%). The only major player that has experienced a decline in the output, and especially in the share, is the United Kingdom. These findings appertain to the trends in other disciplines and they have been a topic of several papers (Hayashino et al. Citation2003, Leydesdorff and Zhou Citation2005, Rahman et al. Citation2005, Shelton Citation2008, Basu Citation2014, Zhou and Pan Citation2015).
Table 5. Trends in the output of the top 10 players. The sparklines indicate the longitudinal trend of the sampled output for each country. The trend of the relative share is illustrated in .
The results presented in this section also show that there are 76 countriesFootnote5 without a single paper in the observed sample.
4.4.2. Normalising the output: efficiency of nations
The so far presented results show the absolute output, but it might not be fair to compare the output of countries such as China and the United States with smaller and/or poorer countries which might be considered productive when certain circumstances are taken into account.
Measuring the efficiency of a country in the output of scientific papers with respect to econometric and demographic indicators such as the gross domestic product (GDP), research and development (R&D) expenditure, and number of researchers has been a topic of a large number of research papers (Blickenstaff and Moravcsik Citation1982, Leydesdorff and Gauthier Citation1996, Amsden and Mourshed Citation1997, May Citation1997, Rousseau and Rousseau Citation1998, De Moya-Anegón and Herrero-Solana Citation1999, King Citation2004, Man et al. Citation2004, Falagas et al. Citation2006, Ugolini et al. Citation2007, Shelton Citation2008, Vinkler Citation2008, Leydesdorff and Wagner Citation2009, Basu Citation2014, Gul et al. Citation2015). Such analyses help to understand the relation between the economic indicators and the volume of the innovative output for estimating a nations’ scientific wealth, and for evaluating scientific policies (Crespi and Geuna Citation2008, Pouris Citation2012).
In this study, the approaches found in the cited studies were used and applied to GIScience. Further, as with the previous section, the received citations will be analysed. An optimal proxy to standardise the national output would be the national R&D expenditure in GIScience or the number of GIScientists, however, no such data exist. Therefore, this analysis relies on the GDP, as most other scientometric studies do.
For this analysis, countries with less than five publications were filtered out to remove statistically insignificant and not representative cases.
reveals the relation between the GIScience output with respect to the population and GDP. Most of the top productive countries () are in the band of a GDP of approx. US$40–50k per capita, yet the plot shows that their efficiency considerably varies in comparison to their size. Notable deviations are the modest cases of France and Japan, which might be explained by the fact that their scientists might be more inclined to publish in local (non-English-speaking) journals not covered in this study. This topic has been a subject of several research papers (Van Leeuwen et al. Citation2000, Citation2001, Man et al. Citation2004).
Figure 6. Relation between a nation’s economic and GIScience wealth. The green line represents the average performance (0.2 papers/US$B of GDP). Pronounced countries are labelled according to ISO 3166. The GDP and population represent the mean of the period 2000–2014. Source of the economic and demographic data: World Development Indicators, World Bank (Citation2015).
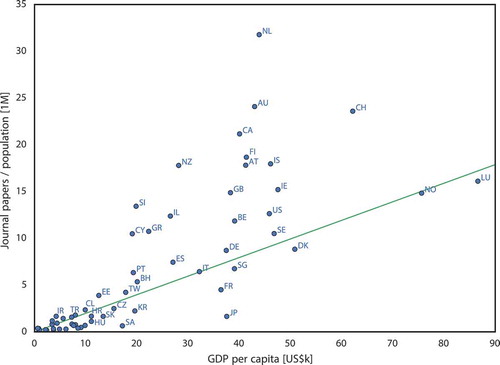
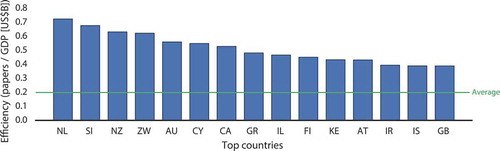
and present the rank of top countries by the number of publications per GDP. The world average performance is 0.199 journal papers per US$B of GDP. This rank gives a more realistic view on the performance of countries given their economic power. The Netherlands ranks first in GIScience efficiency, similarly as in other disciplines (Rousseau and Rousseau Citation1998). A strong correlation is observed between the national output and the national GDP (0.94), which is higher than in other related studies: 0.69 (De Moya-Anegón and Herrero-Solana Citation1999) and 0.45 (Vinkler Citation2008).
Table 6. Top countries by output efficiencya. The values in parentheses indicate the rank in relative impact based on the RCIb.
Figure 7. Most efficient countries based on the number of journal papers divided by GDP.
4.4.3. Worldwide distribution of citations
A question that follows is: Are countries productive in GIScience also comparatively successful in attaining citations? Therefore, the citation share and the output share have been compared. shows that there is a difference between the two, which also affects the rank, for example, France comes ahead of Spain when accumulation of citations is considered.
Some countries produce papers that on average have a higher impact than others; however, these discrepancies could also be (at least partially) explained by the fact that topic-wise the composition of papers might not be equal among countries: some topics, more popular than in other countries, tend to gain more attention than others. A notable difference exists in the case of China. As seen in , China’s historical output is not homogenous; therefore, its increased publication rate possibly did not yet start to accumulate citations, as that normally follows with a delay.
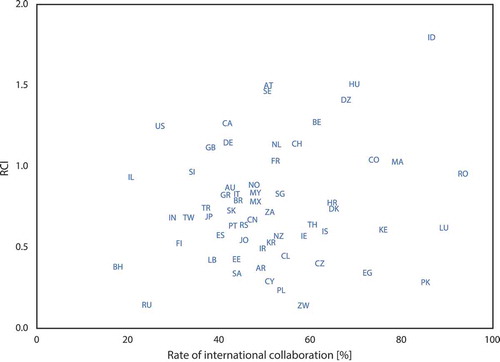
In relative terms, the impact of a country can be assessed with the relative citation impact (RCI), the ratio between the share of citations and share of publications (May Citation1997). A different view on the performance has been obtained, and additionally shows the RCI ranking of the most output-efficient countries. However, ranking countries by RCI is avoided, since the results suggest that in small samples a co-authorship in just one highly cited paper may substantially boost a country’s rank.
Are countries efficient in output also efficient in citedness? No, there is a zero correlation (0.016), and as visible from the , there is a discrepancy between the efficiency and RCI rankings (although there are cases whose rank is consistent).
4.5. Collaboration
Measuring the international scientific collaboration is important to understand the international network of science and collaborative centres (Luukkonen et al. Citation1993, Katz and Martin Citation1997). A paper is considered international if more than one country is indicated in the affiliation (Schubert and Braun Citation1990).
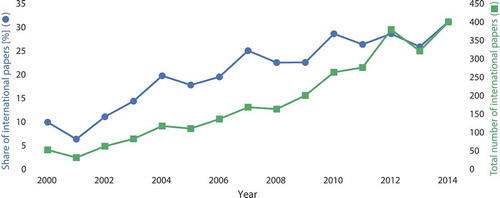
The affiliations stated in the surveyed publications have been analysed: 22.7% publications in the sample are a result of an international collaboration (recently this increased to almost a third; see ). shows that the share of international papers is growing, which is consistent with other disciplines. However, the share of international collaboration in 2000 (10.0%) was significantly lower than the worldwide share in a cross-disciplinary study (15.6%; Wagner and Leydesdorff Citation2005).
Figure 8. Temporal trend of the international collaboration in GIScience.
provides the data on the most frequent pairs collaborating in GIScience, both on national and city level. Most collaborations belong to the pair of China and the US, which is also the case in many other disciplines (He Citation2009).
Table 7. Top 15 country-to-country and city-to-city collaborations, ranked by the number of papers published together.
The quantity of collaboration by country roughly corresponds to the content of . However, in relative terms, another ranking is exposed: Romania is the most collaborative country (92%; i.e. 12 out of 13 papers are international). It is followed by Luxembourg (88%), Indonesia (85%), Pakistan (84%), Morocco (78%), Kenya (75%), Colombia (73%), Egypt (71%), Hungary (68%), Algeria (67%), Denmark (64%), Croatia (64%), Iceland (63%), Czech Republic (61%), and Belgium (60%).
While international collaboration in GIScience is frequent, papers originating from more than a few countries are uncommon. The record is set by the paper of Hjelmager et al. (Citation2008) with authors from 13 countries.
Studies have been carried out to find the relation between collaborative papers and citation impact, however, only at a publication level (van Raan Citation1998, Leimu and Koricheva Citation2005b, Figg et al. Citation2006). Relating these findings to the previous section, shows the relation between the RCI and collaborativeness. A modest correlation of 0.166 has been found, indicating that countries open to collaboration do not have significantly more impact. At a publication level, a zero correlation (0.036) was found between the number of participating countries and the attained citations, demonstrating that in general having more collaborating countries in a paper does not result in a higher impact.
Figure 9. Relation between the rate of international collaboration and the nation’s GIScience relative impact.
4.6. Authorship
Using the metadata of authors of publications, an analysis of authorship was made. Results indicate a high fragmentation between the authors of papers in the observed sample: there are 22,252 authors, with an average of 1.6 papers per author. Furthermore, 75.5% authors have published one paper in the sample and 1.2% authors have published 10 or more papers.
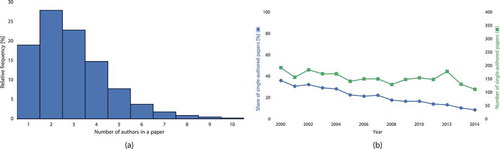
indicates the distribution of authors per paper (the average number of authors per paper is 2.96), and the single-authored papers are falling out of fashion: in the observed period, the rate of papers authored by one person dropped significantly (from 36.2 to 8.7%). This trend is consistent with other disciplines (Huang Citation2015).
Figure 10. Dissecting the authorships: (a) distribution of the number of authors of a paper; and (b) the relative and absolute number of papers signed by a single author.
The data on the authorship were coupled with the data of citations. Researchers suggest that the quantity of citations received per author might not be consistent with the number of published papers (Waltman et al. Citation2013); hence, in order to investigate the GIScience trend, it was studied whether papers of seasoned GIScientists have a higher relative impact. The results suggest no, as there is zero correlation between the number of papers published by an author and the citedness of her/his papers. This goes together with the interesting observation that some of the authors of the most cited papers () have not published any other paper in the observed journals in the considered time period. In fact, these results are consistent with other disciplines such as chemical engineering (Peters and van Raan Citation1994).
Another aspect that was investigated is the relation between the number of authors in a paper and the received citations. It has been suggested by some researchers that the number of authors increase the number of citations (Glänzel and Thijs Citation2004a, Leimu and Koricheva Citation2005a, Vieira and Gomes Citation2010). However, the correlation between the number of authors and the NCII was found to be very weak (0.069).
Finally, unlike in some other disciplines, there are not many papers with more than a few authors (see ). The paper with most authors (26) in the sample is the one of Albertz et al. (Citation2005).
4.7. Page count
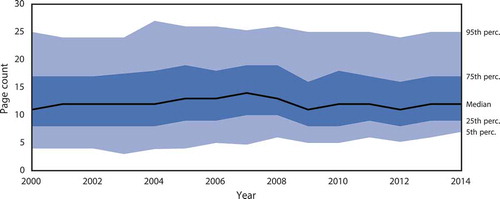
Since the metadata of papers contain their number of pages, the length of papers was analysed as well. It was found that the average length of a paper in the analysed sample is 13.4, and it seems to have been stable during the past 15 years (). The plot also suggests that papers longer than 25 pages are not frequent.
Figure 11. Length of papers through time, with the indicated dispersion (percentiles).
It has been suggested by scientometric researchers that lengthier papers attract more citations (Peters and van Raan Citation1994, Vieira and Gomes Citation2010, Falagas et al. Citation2013). However, it turns out that in GIScience, there is almost no correlation between the page count and NCII (r = 0.053, n = 12217; and r = 0.070 when using the unadjusted citation count). It is interesting to note that this is not the case in many other disciplines, e.g. 0.70 – medicine (Falagas et al. Citation2013).
5. Altmetrics
Altmetrics (short for alternative metrics) are being increasingly used as an alternative to traditional indicators such as the IF or citation count (Piwowar Citation2013, Haustein et al. Citation2014b). They include different measures of an impact of a publication, mostly related to social media activity around a scholarly article. Examples are mentions on Twitter and citations in Wikipedia articles. Considering that they indicate the societal impact, altmetrics can complement citations when assessing the impact of a publication (Haustein et al. Citation2015b).
Herein it is investigated how GIScience stands with respect to altmetrics, and whether there is a relationship between traditional metrics and altmetrics. Furthermore, this is interesting to investigate since there are differences between disciplines when taking social media into account (Holmberg and Thelwall Citation2014, Ortega Citation2015). Social media has already been a topic of papers published in this journal, and it is rapidly gaining importance in GIScience research (Sui and Goodchild Citation2011, Bakillah et al. Citation2015, De Albuquerque et al. Citation2015, Huang and Wong Citation2015, Huang and Xiao Citation2015, Jongman et al. Citation2015, Longley and Adnan Citation2016, Steiger et al. Citation2015a, Citation2015b, Yin and Shaw Citation2015).
In the continuation, two sources of altmetrics are analysed: Altmetric and Mendeley.
5.1. Altmetric
Altmetric captures mentions of publications in nonacademic sources, such as news, policy documents, mentions on Twitter, blog posts, Wikipedia, Facebook posts, Google+ posts, and LinkedIn (Adie and Roe Citation2013). It assigns a single numerical score to each paper, an indication of attention surrounding a research paper. The score is assigned according to a weighted algorithm based on three factors: (i) volume of the mentions (how many?), (ii) source of the mentions (i.e. it differs between high-profile news stories, retweets, and Wikipedia references), and (iii) author of the mentions (e.g. a journal publisher, or an influential academic) (Davies Citation2015). While the Altmetric score considers tweets, Twitter is gaining more and more importance as a medium of academic communication (Shuai et al. Citation2012), hence it is considered separately in this section.
Altmetric started to operate in 2010, hence only papers published as of 2011 are taken into account. According to the analysis, 20.7% of analysed GIScience papers have been mentioned on Twitter at least once. This value puts GIScience slightly below the average of 21.5% (Haustein et al. Citation2015a, Citation2015b).
Furthermore, the analysis has shown that there is a trivial correlation between the citations and mentions on social media (i.e. Altmetric score 0.145, and Twitter – 0.144), similar to the conclusions found in related work (Haustein et al. Citation2014a). This indicates that mentions do not guarantee increased citedness, but it also reinforces the idea that altmetrics should be considered as complement and perpendicular indicator to the traditional metrics.
As of writing this manuscript, the publication with the highest Altmetric score is the one of Yoshimura et al. (Citation2014): ‘An Analysis of Visitors’ Behavior in The Louvre Museum: A Study Using Bluetooth Data’ published in EPB (25.85 score and 9 tweets). The publication most mentioned on Twitter is the paper of Steiniger and Hunter (Citation2013): ‘The 2012 Free and Open Source GIS Software Map – A Guide to Facilitate Research, Development, and Adoption’ published in CEUS (Altmetric score of 22.45, and tweeted 28 times). These values are not particularly high in comparison to other disciplines; for instance, the recent paper of Blake et al. (Citation2015), one of the highest scoring papers in psychology, currently has a score of 346. This indicates that GIScience papers are not popular in sources covered by Altmetric and they might have a limited reach to the public comparing to larger disciplines.
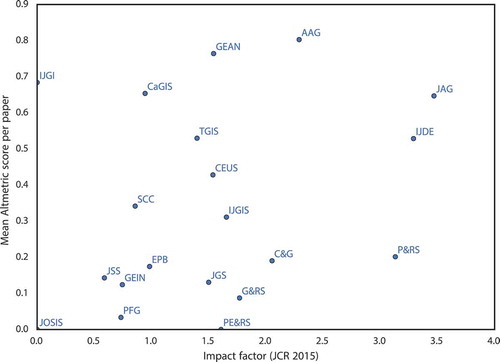
Although such metrics are positioned at an article level, it is interesting to analyse the altmetric impact of journals, and whether a high traditional impact of a journal implies a high impact in social media. shows the relation between the IF of a journal and the mean Altmetric score assigned to a paper in that journal in the period 2011–2014. The scatter plot illustrates a weak relationship (r = 0.274), and there is a substantial difference between journals when taking into account the presence in social media.
Figure 12. Relationship between the Altmetric score and the traditional impact of a journal. IF source: 2015 Journal Citation Reports (Thomson Reuters Citation2015).
5.2. Mendeley
Mendeley is the Elsevier’s software for managing and sharing research papers. It is valuable for scientometric analyses since their API provides statistics such as the count of people that have a paper in their library. Mendeley data have been used in a number of research papers for various analyses (Zaugg et al. Citation2011, Bar-Ilan et al. Citation2012, Li and Thelwall Citation2012, Mohammadi and Thelwall Citation2014, Haustein et al. Citation2014a, Bornmann and Haunschild Citation2015, Fairclough and Thelwall Citation2015, Thelwall and Maflahi Citation2015, Mohammadi et al. Citation2015b).
For each paper in the sample that has a DOI, information about the number of readers has been retrieved in order to understand the prevalence of GIScience papers and trends among researchers with respect to some of the previously investigated metrics.
It was found that 97.2% of GIScience papers covered by this study have been bookmarked by at least one reader in Mendeley, and that there are 21.8 readers per paper. This rate of attention is significantly better than any other discipline (with an average of 66.2%) (Haustein et al. Citation2014a, Citation2014b, Mohammadi et al. Citation2015a). In the research of Haustein et al. (Citation2014a), psychology ranks as the first discipline with 81.0% papers being included in Mendeley libraries, and GIScience ranks substantially better than that.
When setting a threshold to 10 readers, to highlight papers that have a wider audience, the analysis shows that 64.4% papers have at least 10 readers. The list of top bookmarked papers mostly corresponds to the list of top cited papers (). The most bookmarked publication is also the most cited one, currently with 962 readers.
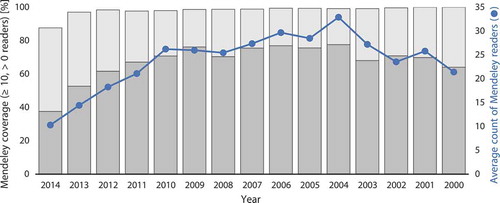
depicts these indicators by the year of publication. It shows that papers are imported into Mendeley libraries with a delay, and that older papers virtually reach a perfect coverage. This might indicate that readers do not become aware of papers immediately and/or papers need time to generate interest. The plot also illustrates the average readership per paper published in a year. It shows a drop in interest in papers older than 10 years. This is congruent with the obsolescence of citations ().
Figure 13. Mendeley readership statistics by year of publication. Note that the x-axis is inverted to indicate ageing.
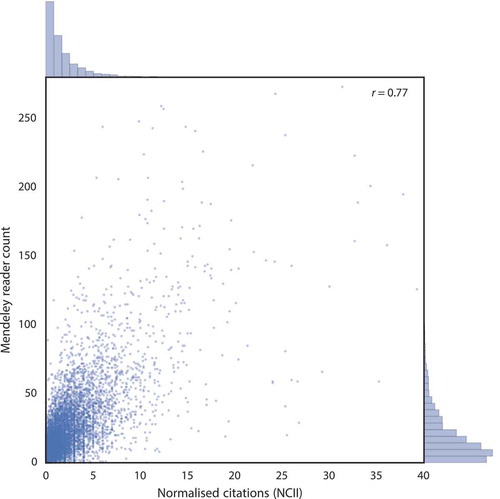
Another important aspect is the relationship between citations and the readership population, which is shown in . The correlation between NCII and reader count is 0.772 (the correlation between citations and readership is 0.719). This is a stronger relation than most disciplines (0.677) (Haustein et al. Citation2014a, Citation2014b), especially when considering humanities (0.428) (Mohammadi and Thelwall Citation2014), and it is similar with genomics and genetics (0.778) (Li and Thelwall Citation2012).
Figure 14. Mendeley readership volume correlates with citations.
6. Conclusions
This scientometric work analysed 12,436 papers published in several GIScience journals in the past 15 years. Thanks to the availability of data and their retrieval through APIs, it was possible to analyse several aspects to understand a number of trends in GIScience.
For instance, besides the discussed results, it was found that top 20% cited papers account for 73% citations, there is a weak correlation between a nation’s output and its population (0.329), 14.9% papers published in 2000–2014 are yet to be cited, and there are large differences in the citations of the papers of the same researcher.
Some of the indicators presented in this paper have not been previously used, for example, the Mendeley relation to the NCII, potentially presenting a contribution in the contemporary field of altmetrics. In most cases, GIScience exhibits behaviour consistent with other disciplines; however, it should be noted that GIScience stands out as a leading discipline in regard to the presence among Mendeley users.
This work, as it is the case with similar analyses, is not without limitations. First, the presented delineation of selected outlets does not capture the whole GIScience literature, hence it cannot be considered to study the complete GIScience landscape and the global GIScience output. Second, the selection of relevant GIScience journals is subject to some bias and subjectivity, and a different selection of outlets would likely to an extent influence the outcome of some aspects of this analysis. However, this is inevitable, and the large sample of journals and papers used in this study is sufficiently diverse to capture the trends and alleviate the bias. Third, the analysed sample contains a number of not exactly GIScience papers. For instance, this is reflected in the domination of remote sensing topics (see the top papers in ). As much as GIScientists publish in other venues, the considered set of journals includes non-GIScience papers. A strict filtering would not be possible without substantial additional work and/or involving advanced text mining techniques, and also without a clear definition of what is exactly a GIScience paper. I am afraid that considerable additional work is required to carry out an analysis that would efficiently delineate GIScience literature in a more precise manner and without compromises due to fuzzy boundaries of the discipline and mixed scopes of outlets, and also due to the lack of a firm consensus among GIScientists on these topics. However, all these limitations are consistent with scientometric studies that focus on disciplines.
For future work, it would be interesting to revisit this topic in 5 or 10 years, and analyse what has changed since this study has been carried out. With the increasing availability of publication metadata, and the rising prominence of altmetrics, possibilities for future work are ceaseless.
Most importantly, it would be interesting to work into two specific directions. First, it would be beneficial to investigate trends of particular topics in GIScience. While it was not feasible to automatically classify papers according to finely defined subdisciplines (e.g. data structures, geovisualisation), lately some topics in GIScience seem to be gaining more interest than others, such as volunteered geoinformation (Arsanjani et al. Citation2015, Ballatore and Mooney Citation2015, Kunze and Hecht Citation2015) and 3D geoinformation (Arroyo Ohori et al. Citation2015, Donkers et al. Citation2015). Furthermore, a relation between more traditional and relatively new topics appears to emerge; for instance, spatial data quality and uncertainty analyses applied to volunteered geoinformation and 3D geoinformation (Fan et al. Citation2014, Biljecki et al. Citation2015, Camboim et al. Citation2015). Second, continuing the analysis of the national aspect provides fertile ground for further research opportunities. This paper has shown that there are substantial differences between countries in consideration of their output and received citations. For instance, US accounts for 31.3% of the analysed GIScience output, approximately as much as 111 countries (if we also consider the remaining 76 countries with 0 papers, which amounts to 187 countries). After adjusting the data according to a nation’s wealth to derive the efficiency, another ranking is exposed where the US ranks 22nd. Such analysis benchmarks a nation’s output and efficiency, thus its extension would be valuable as an input in scientific policies that would help to improve GIScience output and could be related to the research on the economic value of geoinformation (Castelein et al. Citation2010, Bernknopf and Shapiro Citation2015, Trapp et al. Citation2015).
Acknowledgements
I gratefully acknowledge the excellent comments and valuable suggestions of the three anonymous reviewers and editor Prof Robert Weibel, which have improved the quality of the manuscript. This analysis would not be possible without data from Scopus, Altmetric, Mendeley, and the World Bank. These sources are much appreciated. In addition, I am thankful to Meshna Koren from Elsevier for promptly answering my queries about Scopus.
Disclosure statement
No potential conflict of interest was reported by the author.
Notes
1. https://3d.bk.tudelft.nl/journals/; last accessed on 29 November 2015.
2. Another example is the list maintained by the Cartography and Geovisualization Group at Oregon State University, available at http://cartography.oregonstate.edu/journals.html; last accessed on 29 November 2015.
3. Formerly (before 2004), GIScience & Remote Sensing had been known as Mapping Sciences and Remote Sensing. The old name has been taken into account when retrieving the data of papers.
4. In this particular computation, the mean value has been used as an exception, due to the nature of the IF, which is calculated as the sum of citations divided by the number of papers.
5. There are 195 United Nations (UN) member states (193) and nonmember permanent observer states (2) as of the submission of this paper (July 2015). This figure is taken as the authoritative number of sovereign states.
References
- Abramo, G., Cicero, T., and D’Angelo, C.A., 2012. Revisiting the scaling of citations for research assessment. Journal of Informetrics, 6 (4), 470–479. doi:10.1016/j.joi.2012.03.005
- Adie, E. and Roe, W., 2013. Altmetric: enriching scholarly content with article-level discussion and metrics. Learned Publishing, 26 (1), 11–17. doi:10.1087/20130103
- Aksnes, D.W., 2003. A macro study of self-citation. Scientometrics, 56 (2), 235–246. doi:10.1023/A:1021919228368
- Albertz, J., et al., 2005. HRSC on Mars Express – photogrammetric and cartographic research. Photogrammetric Engineering & Remote Sensing, 71 (10), 1153–1166. doi:10.14358/PERS.71.10.1153
- Amat, C.B., 2008. Editorial and publication delay of papers submitted to 14 selected Food Research journals. Influence of online posting. Scientometrics, 74 (3), 379–389. doi:10.1007/s11192-007-1823-8
- Amsden, A.H., and Mourshed, M., 1997. Scientific publications, patents and technological capabilities in late-industrializing countries. Technology Analysis & Strategic Management, 9 (3), 343–360. doi:10.1080/09537329708524289
- Anselin, L., Syabri, I., and Kho, Y., 2006. GeoDa: an introduction to spatial data analysis. Geographical Analysis, 38 (1), 5–22. doi:10.1111/gean.2006.38.issue-1
- Arroyo Ohori, K., et al., 2015. Modeling a 3D city model and its levels of detail as a true 4D model. ISPRS International Journal of Geo-Information, 4 (3), 1055–1075. doi:10.3390/ijgi4031055
- Arsanjani, J.J., et al., 2015. An exploration of future patterns of the contributions to OpenStreetMap and development of a contribution index. Transactions in GIS. doi:10.1111/tgis.12139
- Bakillah, M., Li, R.Y., and Liang, S.H.L., 2015. Geo-located community detection in Twitter with enhanced fast-greedy optimization of modularity: the case study of typhoon Haiyan. International Journal of Geographical Information Science, 29 (2), 258–279. doi:10.1080/13658816.2014.964247
- Ballatore, A. and Mooney, P., 2015. Conceptualising the geographic world: the dimensions of negotiation in crowdsourced cartography. International Journal of Geographical Information Science, 1–18. doi:10.1080/13658816.2015.1076825
- Bar-Ilan, J., et al., 2012. Beyond citations: scholars’ visibility on the social Web. In: Proceedings of the 17th international conference on science and technology indicators, 5–8 September Montréal, 98–109.
- Basu, A., 2014. The Albuquerque model and efficiency indicators in national scientific productivity with respect to manpower and funding in science. Scientometrics, 100 (2), 531–539. doi:10.1007/s11192-014-1254-2
- Benz, U.C., et al., 2004. Multi-resolution, object-oriented fuzzy analysis of remote sensing data for GIS-ready information. ISPRS Journal of Photogrammetry and Remote Sensing, 58 (3–4), 239–258. doi:10.1016/j.isprsjprs.2003.10.002
- Bernknopf, R. and Shapiro, C., 2015. Economic assessment of the use value of geospatial information. ISPRS International Journal of Geo-Information, 4 (3), 1142–1165. doi:10.3390/ijgi4031142
- Biljecki, F., et al., 2015. Propagation of positional error in 3D GIS: estimation of the solar irradiation of building roofs. International Journal of Geographical Information Science, 29 (12), 2269–2294.
- Blake, A.B., Nazarian, M., and Castel, A.D., 2015. The Apple of the mind’s eye: everyday attention, metamemory, and reconstructive memory for the Apple logo. The Quarterly Journal of Experimental Psychology, 68 (5), 858–865. doi:10.1080/17470218.2014.1002798
- Blaschke, T., 2010. Object based image analysis for remote sensing. ISPRS Journal of Photogrammetry and Remote Sensing, 65 (1), 2–16. doi:10.1016/j.isprsjprs.2009.06.004
- Blaschke, T., et al., 2014. Geographic object-based image analysis – towards a new paradigm. ISPRS Journal of Photogrammetry and Remote Sensing, 87, 180–191. doi:10.1016/j.isprsjprs.2013.09.014
- Blaschke, T. and Eisank, C., 2012. How influential is geographic information science? In: 17th international conference on science and technology indicators (STI), September Columbus, OH.
- Blickenstaff, J. and Moravcsik, M.J., 1982. Scientific output in the third world. Scientometrics, 4 (2), 135–169. doi:10.1007/BF02018451
- Boguslawski, P., Gold, C.M., and Ledoux, H., 2011. Modelling and analysing 3D buildings with a primal/dual data structure. ISPRS Journal of Photogrammetry and Remote Sensing, 66 (2), 188–197. doi:10.1016/j.isprsjprs.2010.11.003
- Bornmann, L. and Haunschild, R., 2015. Which people use which scientific papers? An evaluation of data from F1000 and Mendeley. Journal of Informetrics, 9 (3), 477–487. doi:10.1016/j.joi.2015.04.001
- Calver, M.C. and Bradley, J.S., 2009. Should we use the mean citations per paper to summarise a journal’s impact or to rank journals in the same field? Scientometrics, 81 (3), 611–615. doi:10.1007/s11192-008-2229-y
- Camboim, S., Bravo, J., and Sluter, C., 2015. An investigation into the completeness of, and the updates to, OpenStreetMap data in a heterogeneous area in Brazil. ISPRS International Journal of Geo-Information, 4 (3), 1366–1388. doi:10.3390/ijgi4031366
- Caron, C., et al., 2008. GIScience journals ranking and evaluation: an international delphi study. Transactions in GIS, 12 (3), 293–321. doi:10.1111/j.1467-9671.2008.01106.x
- Castelein, W.T., Bregt, A., and Pluijmers, Y., 2010. The economic value of the Dutch geoinformation sector. International Journal of Spatial Data Infrastructures Research, 5 (5), 58–76.
- Chiu, W.T. and Ho, Y.S., 2005. Bibliometric analysis of homeopathy research during the period of 1991 to 2003. Scientometrics, 63 (1), 3–23. doi:10.1007/s11192-005-0201-7
- Cole, J.R., and Cole, S., 1981. Social stratification in science. Chicago, IL: University of Chicago Press.
- Crespi, G.A. and Geuna, A., 2008. An empirical study of scientific production: a cross country analysis, 1981–2002. Research Policy, 37 (4), 565–579. doi:10.1016/j.respol.2007.12.007
- Dalen, H.P. and Henkens, K., 2004. Demographers and their journals: who remains uncited after ten years? Population and Development Review, 30 (3), 489–506. doi:10.1111/padr.2004.30.issue-3
- Dannenberg, A.L., 1985. Use of epidemiology in medical specialties – an examination by citation analysis. American Journal of Epidemiology, 121 (1), 140–151.
- Davies, F., 2015. Numbers behind numbers: the altmetric score and sources explained [online]. Available from: http://www.altmetric.com/blog/scoreanddonut/
- de Albuquerque, J.P., et al., 2015. A geographic approach for combining social media and authoritative data towards identifying useful information for disaster management. International Journal of Geographical Information Science, 29 (4), 667–689. doi:10.1080/13658816.2014.996567
- De Bakker, F.G.A., Groenewegen, P., and Den Hond, F., 2005. A bibliometric analysis of 30 years of research and theory on corporate social responsibility and corporate social performance. Business & Society, 44 (3), 283–317. doi:10.1177/0007650305278086
- De Moya-Anegón, F. and Herrero-Solana, V., 1999. Science in america latina: a comparison of bibliometric and scientific-technical indicators. Scientometrics, 46 (2), 299–320. doi:10.1007/BF02464780
- Dong, P., Loh, M., and Mondry, A., 2006. Publication lag in biomedical journals varies due to the periodical’s publishing model. Scientometrics, 69 (2), 271–286. doi:10.1007/s11192-006-0148-3
- Donkers, S., et al., 2015. Automatic conversion of IFC datasets to geometrically and semantically correct CityGML LOD3 buildings. Transactions in GIS. doi:10.1111/tgis.12162
- Dorta-González, P. and Dorta-González, M.I., 2013. Impact maturity times and citation time windows: the 2-year maximum journal impact factor. Journal of Informetrics, 7 (3), 593–602. doi:10.1016/j.joi.2013.03.005
- Duckham, M., 2015. GI expertise. Transactions in GIS, 19 (4), 499–515. doi:10.1111/tgis.12166
- Egghe, L., Guns, R., and Rousseau, R., 2011. Thoughts on uncitedness: nobel laureates and Fields medalists as case studies. Journal of the American Society for Information Science and Technology, 62 (8), 1637–1644. doi:10.1002/asi.v62.8
- Egghe, L. and Ravichandra Rao, I.K., 1992. Citation age data and the obsolescence function: fits and explanations. Information Processing & Management, 28 (2), 201–217. doi:10.1016/0306-4573(92)90046-3
- Egghe, L., Rousseau, R., and Van Hooydonk, G., 2000. Methods for accrediting publications to authors or countries: consequences for evaluation studies. Journal of the American Society for Information Science, 51 (2), 145–157. doi:10.1002/(ISSN)1097-4571
- Estabrooks, C.A., Winther, C., and Derksen, L., 2004. Mapping the field: a bibliometric analysis of the research utilization literature in nursing. Nursing Research, 53 (5), 293–303. doi:10.1097/00006199-200409000-00003
- Fairclough, R. and Thelwall, M., 2015. National research impact indicators from Mendeley readers. Journal of Informetrics, 9 (4), 845–859. doi:10.1016/j.joi.2015.08.003
- Falagas, M.E., et al., 2006. A bibliometric analysis by geographic area of published research in several biomedical fields, 1995–2003. Canadian Medical Association Journal, 175 (11), 1389–1390. doi:10.1503/cmaj.060361
- Falagas, M.E., et al., 2013. The impact of article length on the number of future citations: a bibliometric analysis of general medicine journals. Plos One, 8 (2), e49476. doi:10.1371/journal.pone.0049476
- Fan, H., et al., 2014. Quality assessment for building footprints data on OpenStreetMap. International Journal of Geographical Information Science, 28 (4), 700–719. doi:10.1080/13658816.2013.867495
- Figg, W.D., et al., 2006. Scientific collaboration results in higher citation rates of published articles. Pharmacotherapy: the Journal of Human Pharmacology and Drug Therapy, 26 (6), 759–767. doi:10.1592/phco.26.6.759
- Frančula, N., Lapaine, M., and Stojanovski, J., 2013a. Selection of non mapping sciences journals suitable for publishing mapping sciences topics [Izbor negeodetskih časopisa prikladnih za geodetske sadržaje]. Geodetski List, 67 (4), 271–280.
- Frančula, N., Stojanovski, J., and Lapaine, M., 2013b. Defining the corpus of mapping sciences journals. Kartografija i Geoinformacije, 12 (19), 4–28.
- Fry, J.A., et al., 2011. Completion of the 2006 national land cover database for the conterminous united states. Photogrammetric Engineering and Remote Sensing, 77 (9), 858–864.
- Garfield, E., 1972. Citation analysis as a tool in journal evaluation: journals can be ranked by frequency and impact of citations for science policy studies. Science, 178 (4060), 471–479. doi:10.1126/science.178.4060.471
- Garnett, A., Lee, G., and Illes, J., 2013. Publication trends in neuroimaging of minimally conscious states. Peer J, 1 (4), e155. doi:10.7717/peerj.155
- Germs, R., et al., 1999. A multi-view VR interface for 3D GIS. Computers & Graphics, 23 (4), 497–506. doi:10.1016/S0097-8493(99)00069-2
- Ghosh, J.S., 1975. Uncitedness of articles in nature, a multidisciplinary scientific journal. Information Processing & Management, 11 (5–7), 165–169. doi:10.1016/0306-4573(75)90005-9
- Glänzel, W., Schlemmer, B., and Thijs, B., 2003. Better late than never? On the chance to become highly cited only beyond the standard bibliometric time horizon. Scientometrics, 58 (3), 571–586. doi:10.1023/B:SCIE.0000006881.30700.ea
- Glänzel, W., and Thijs, B., 2004a. Does co-authorship inflate the share of self-citations? Scientometrics, 61 (3), 395–404. doi:10.1023/B:SCIE.0000045117.13348.b1
- Glänzel, W., and Thijs, B., 2004b. The influence of author self-citations on bibliometric macro indicators. Scientometrics, 59 (3), 281–310. doi:10.1023/B:SCIE.0000018535.99885.e9
- Goodchild, M.F., 1992. Geographical information science. International Journal of Geographical Information Systems, 6 (1), 31–45. doi:10.1080/02693799208901893
- Goodchild, M.F., 2009. Geographic information systems and science: today and tomorrow. Annals of GIS, 15 (1), 3–9. doi:10.1080/19475680903250715
- Gröger, G. and Plümer, L., 2012. CityGML – interoperable semantic 3D city models. ISPRS Journal of Photogrammetry and Remote Sensing, 71, 12–33. doi:10.1016/j.isprsjprs.2012.04.004
- Gu, Y., 2004. Global knowledge management research: a bibliometric analysis. Scientometrics, 61 (2), 171–190. doi:10.1023/B:SCIE.0000041647.01086.f4
- Gul, S., et al., 2015. Middle East: research productivity and performance across nations. Scientometrics, 105 (2), 1157–1166. doi:10.1007/s11192-015-1722-3
- Gupta, R., Gupta, B.M., and Mueen, M., 2014. Limbic encephalitis: a scientometric analysis of global publications during 2004–13. Journal of Scientometric Research, 3 (3), 125.
- Gutiérrez, J. and López-Nieva, P., 2001. Are international journals of human geography really international? Progress in Human Geography, 25 (1), 53–69. doi:10.1191/030913201666823316
- Haustein, S., et al., 2014a. Tweets vs. Mendeley readers: how do these two social media metrics differ? IT – Information Technology, 56 (5), 207–215. doi:10.1515/itit-2014-1048
- Haustein, S., et al., 2014b. Coverage and adoption of altmetrics sources in the bibliometric community. Scientometrics, 101 (2), 1145–1163. doi:10.1007/s11192-013-1221-3
- Haustein, S., Bowman, T.D., and Costas, R., 2015a. When is an article actually published? An analysis of online availability, publication, and indexation dates. In: 15th international conference on scientometrics and informetrics ISSI, 29 June–4 July Istanbul.
- Haustein, S., Costas, R., and Larivière, V., 2015b. Characterizing social media metrics of scholarly papers: the effect of document properties and collaboration patterns. Plos One, 10 (3), e0120495–21. doi:10.1371/journal.pone.0120495
- Hayashino, Y., Rahman, M., and Fukui, T., 2003. Japan’s contribution to research in rheumatology. Modern Rheumatology, 13 (2), 168–172. doi:10.3109/s10165-002-0217-2
- He, T., 2009. International scientific collaboration of China with the G7 countries. Scientometrics, 80 (3), 571–582. doi:10.1007/s11192-007-2043-y
- Heilig, L. and Voß, S., 2014. A scientometric analysis of cloud computing literature. IEEE Transactions on Cloud Computing, 2 (3), 266–278. doi:10.1109/TCC.2014.2321168
- Hjelmager, J., et al., 2008. An initial formal model for spatial data infrastructures. International Journal of Geographical Information Science, 22 (11–12), 1295–1309. doi:10.1080/13658810801909623
- Holmberg, K. and Thelwall, M., 2014. Disciplinary differences in Twitter scholarly communication. Scientometrics, 101 (2), 1027–1042. doi:10.1007/s11192-014-1229-3
- Homer, C., et al., 2004. Development of a 2001 national land-cover database for the United States. Photogrammetric Engineering & Remote Sensing, 70 (7), 829–840. doi:10.14358/PERS.70.7.829
- Hood, W.W. and Wilson, C.S., 2001. The literature of bibliometrics, scientometrics, and informetrics. Scientometrics, 52 (2), 291–314. doi:10.1023/A:1017919924342
- Huang, D.-W., 2015. Temporal evolution of multi-author papers in basic sciences from 1960 to 2010. Scientometrics, 105 (3), 2137–2147. doi:10.1007/s11192-015-1760-x
- Huang, Q. and Wong, D.W.S., 2015. Modeling and visualizing regular human mobility patterns with uncertainty: an example using Twitter data. Annals of the Association of American Geographers, 105 (6), 1179–1197. doi:10.1080/00045608.2015.1081120
- Huang, Q. and Xiao, Y., 2015. Geographic situational awareness: mining tweets for disaster preparedness, emergency response, impact, and recovery. ISPRS International Journal of Geo-Information, 4 (3), 1549–1568. doi:10.3390/ijgi4031549
- Hyland, K., 2003. Self-citation and self-reference: credibility and promotion in academic publication. Journal of the American Society for Information Science and Technology, 54 (3), 251–259. doi:10.1002/(ISSN)1532-2890
- Jongman, B., et al., 2015. Early flood detection for rapid humanitarian response: harnessing near real-time satellite and Twitter signals. ISPRS International Journal of Geo-Information, 4 (4), 2246–2266. doi:10.3390/ijgi4042246
- Kang, M., Wang, M., and Du, Q., 2015. A method of DTM construction based on quadrangular irregular networks and related error analysis. Plos One, 10 (5), e0127592. doi:10.1371/journal.pone.0127592
- Katz, J.S. and Martin, B.R., 1997. What is research collaboration? Research Policy, 26 (1), 1–18. doi:10.1016/S0048-7333(96)00917-1
- Kemp, K., Kuhn, W., and Brox, C., 2013. Results of a survey to rate GIScience publication outlets. Technical report.
- Kim, J. and Kim, J., 2015. Rethinking the comparison of coauthorship credit allocation schemes. Journal of Informetrics, 9 (3), 667–673. doi:10.1016/j.joi.2015.07.005
- King, D.A., 2004. The scientific impact of nations. Nature, 430 (6997), 311–316. doi:10.1038/430311a
- Kuhn, W. and Brox, C., 2011. Establishing a publication outlet rating for GIScience. In: 14th AGILE international conference on geographic information science, April Utrecht, The Netherlands.
- Kulkarni, A.V., et al., 2011. Author self-citation in the general medicine literature. Plos One, 6 (6), e20885. doi:10.1371/journal.pone.0020885
- Kunze, C. and Hecht, R., 2015. Semantic enrichment of building data with volunteered geographic information to improve mappings of dwelling units and population. Computers, Environment and Urban Systems, 53, 4–18. doi:10.1016/j.compenvurbsys.2015.04.002
- Larivière, V., Gingras, Y., and Archambault, É., 2009. The decline in the concentration of citations, 1900–2007. Journal of the American Society for Information Science and Technology, 60 (4), 858–862. doi:10.1002/asi.v60:4
- Leimu, R. and Koricheva, J., 2005a. What determines the citation frequency of ecological papers? Trends in Ecology & Evolution, 20 (1), 28–32. doi:10.1016/j.tree.2004.10.010
- Leimu, R. and Koricheva, J., 2005b. Does scientific collaboration increase the impact of ecological articles? BioScience, 55 (5), 438–443. doi:10.1641/0006-3568(2005)055[0438:DSCITI]2.0.CO;2
- Leydesdorff, L. and Gauthier, É., 1996. The evaluation of national performance in selected priority areas using scientometric methods. Research Policy, 25 (3), 431–450. doi:10.1016/0048-7333(95)00841-1
- Leydesdorff, L. and Wagner, C., 2009. Macro-level indicators of the relations between research funding and research output. Journal of Informetrics, 3 (4), 353–362. doi:10.1016/j.joi.2009.05.005
- Leydesdorff, L. and Zhou, P., 2005. Are the contributions of China and Korea upsetting the world system of science? Scientometrics, 63 (3), 617–630. doi:10.1007/s11192-005-0231-1
- Li, X., and Thelwall, M., 2012. F1000, Mendeley and traditional bibliometric indicators. In: 17th international conference on science and technology indicators (STI), September Montréal, 451–551.
- Lichti, D., 2013. The U.V. Helava Award – best paper volumes 67–74 (2012). ISPRS Journal of Photogrammetry and Remote Sensing, 82, I.
- Longley, P.A., and Adnan, M., 2016. Geo-temporal Twitter demographics. International Journal of Geographical Information Science, 30 (2), 369–389. doi:10.1080/13658816.2015.1089441
- Lozano, G.A., Larivière, V., and Gingras, Y., 2012. The weakening relationship between the impact factor and papers’ citations in the digital age. Journal of the American Society for Information Science and Technology, 63 (11), 2140–2145. doi:10.1002/asi.22731
- Luukkonen, T., et al., 1993. The measurement of international scientific collaboration. Scientometrics, 28 (1), 15–36. doi:10.1007/BF02016282
- MacRoberts, M.H. and MacRoberts, B.R., 1989. Problems of citation analysis: a critical review. Journal of the American Society for Information Science, 40 (5), 342–349. doi:10.1002/(ISSN)1097-4571
- Man, J.P., et al., 2004. Why do some countries publish more than others? An international comparison of research funding, english proficiency and publication output in highly ranked general medical journals. European Journal of Epidemiology, 19 (8), 811–817. doi:10.1023/B:EJEP.0000036571.00320.b8
- Mark, D.M., 2003. Geographic information science: defining the field. In: M. Duckham, M.F. Goodchild, and M.F. Worboys, eds. Foundations of geographic information science. New York, NY: Taylor & Francis, 1–15.
- May, R.M., 1997. The scientific wealth of nations. Science, 275 (5301), 793–796. doi:10.1126/science.275.5301.793
- Michael Hall, C., 2011. Publish and perish? Bibliometric analysis, journal ranking and the assessment of research quality in tourism. Tourism Management, 32 (1), 16–27. doi:10.1016/j.tourman.2010.07.001
- Mohammadi, E., et al., 2015a. Who reads research articles? An altmetrics analysis of Mendeley user categories. Journal of the Association for Information Science and Technology. doi:10.1002/asi.23477
- Mohammadi, E. and Thelwall, M., 2014. Mendeley readership altmetrics for the social sciences and humanities: research evaluation and knowledge flows. Journal of the Association for Information Science and Technology, 65 (8), 1627–1638. doi:10.1002/asi.23071
- Mohammadi, E., Thelwall, M., and Kousha, K., 2015b. Can Mendeley bookmarks reflect readership? A survey of user motivations. Journal of the Association for Information Science and Technology. doi:10.1002/asi.23477
- Mountrakis, G., Im, J., and Ogole, C., 2011. Support vector machines in remote sensing: a review. ISPRS Journal of Photogrammetry and Remote Sensing, 66 (3), 247–259. doi:10.1016/j.isprsjprs.2010.11.001
- Nederhof, A.J. and Moed, H.F., 1993. Modeling multinational publication: development of an on-line fractionation approach to measure national scientific output. Scientometrics, 27 (1), 39–52. doi:10.1007/BF02017754
- Nederhof, A.J. and van Raan, A.F.J., 1993. A bibliometric analysis of six economics research groups: a comparison with peer review. Research Policy, 22 (4), 353–368. doi:10.1016/0048-7333(93)90005-3
- Old, L.J., 2001. Utilizing spatial information systems for non-spatial-data analysis. Scientometrics, 51 (3), 563–571. doi:10.1023/A:1019603321216
- Ortega, J.L., 2015. Disciplinary differences in the use of academic social networking sites. Online Information Review, 39 (4), 520–536. doi:10.1108/OIR-03-2015-0093
- Parker, D.C., et al., 2003. Multi-agent systems for the simulation of land-use and land-cover change: a review. Annals of the Association of American Geographers, 93 (2), 314–337. doi:10.1111/1467-8306.9302004
- Parr, D.A. and Lu, Y., 2010. The landscape of GIScience publications 1997–2007: an empirical investigation with latent semantic analysis. Transactions in GIS, 14 (5), 689–708. doi:10.1111/tgis.2010.14.issue-5
- Pawlowicz, R., Beardsley, B., and Lentz, S., 2002. Classical tidal harmonic analysis including error estimates in MATLAB using T_TIDE. Computers & Geosciences, 28 (8), 929–937. doi:10.1016/S0098-3004(02)00013-4
- Peng, Y., et al., 2015. Global trends in DEM-related research from 1994 to 2013: a bibliometric analysis. Scientometrics, 105 (1), 347–366. doi:10.1007/s11192-015-1666-7
- Peters, H.P.F. and van Raan, A.F.J., 1994. On determinants of citation scores: a case study in chemical engineering. Journal of the American Society for Information Science, 45 (1), 39–49. doi:10.1002/(ISSN)1097-4571
- Peters, M.P., et al., 2014. Delineating generalized species boundaries from species distribution data and a species distribution model. International Journal of Geographical Information Science, 28 (8), 1547–1560. doi:10.1080/13658816.2013.840381
- Piwowar, H., 2013. Altmetrics: value all research products. Nature, 493 (7431), 159.
- Pouris, A., 2012. Scientometric research in South Africa and successful policy instruments. Scientometrics, 91 (2), 317–325. doi:10.1007/s11192-011-0581-9
- Rabus, B., et al., 2003. The shuttle radar topography mission—a new class of digital elevation models acquired by spaceborne radar. ISPRS Journal of Photogrammetry and Remote Sensing, 57 (4), 241–262. doi:10.1016/S0924-2716(02)00124-7
- Rahman, M., Haque, T.L., and Fukui, T., 2005. Research articles published in clinical radiology journals: trend of contribution from different countries. Academic Radiology, 12 (7), 825–829. doi:10.1016/j.acra.2005.03.061
- Reitsma, F., 2013. Revisiting the ‘Is GIScience a science?’ debate (or quite possibly scientific gerrymandering). International Journal of Geographical Information Science, 27 (2), 211–221. doi:10.1080/13658816.2012.674529
- Robinson, A.C., 2015. Cartography and geographic information science at Penn State. Cartography and Geographic Information Science, 42 (sup1), 91–92. doi:10.1080/15230406.2015.1059256
- Rousseau, S. and Rousseau, R., 1998. The scientific wealth of European nations: taking effectiveness into account. Scientometrics, 42 (1), 75–87. doi:10.1007/BF02465013
- Salichtchev, K.A., 1979. Periodical and serial publications on cartography. Cartographica: The International Journal for Geographic Information and Geovisualization, 16 (2), 109–132. doi:10.3138/N775-W824-U873-8832
- Sangam, S.L., et al., 2013. Scientometrics analysis of Genetics Literature. Collnet Journal of Scientometrics and Information Management, 7 (2), 173–190. doi:10.1080/09737766.2013.832901
- Schubert, A. and Braun, T., 1990. International collaboration in the sciences 1981–1985. Scientometrics, 19 (1–2), 3–10. doi:10.1007/BF02130461
- Schwartz, C.A., 1997. The rise and fall of uncitedness. College & Research Libraries, 58 (1), 19–29. doi:10.5860/crl.58.1.19
- Serenko, A. and Bontis, N., 2004. Meta-review of knowledge management and intellectual capital literature: citation impact and research productivity rankings. Knowledge and Process Management, 11 (3), 185–198. doi:10.1002/(ISSN)1099-1441
- Shelton, R.D., 2008. Relations between national research investment and publication output: application to an American Paradox. Scientometrics, 74 (2), 191–205. doi:10.1007/s11192-008-0212-2
- Shuai, X., Pepe, A., and Bollen, J., 2012. How the scientific community reacts to newly submitted preprints: article downloads, twitter mentions, and citations. Plos One, 7 (11), e47523. doi:10.1371/journal.pone.0047523
- Skupin, A., 2014. Making a Mark: a computational and visual analysis of one researcher’s intellectual domain. International Journal of Geographical Information Science, 28 (6), 1209–1232. doi:10.1080/13658816.2014.906040
- Steiger, E., Resch, B., and Zipf, A., 2015a. Exploration of spatiotemporal and semantic clusters of Twitter data using unsupervised neural networks. International Journal of Geographical Information Science, 1–23. doi:10.1080/13658816.2015.1099658
- Steiger, E., et al., 2015b. Twitter as an indicator for whereabouts of people? Correlating Twitter with UK census data. Computers, Environment and Urban Systems, 54, 255–265. doi:10.1016/j.compenvurbsys.2015.09.007
- Steiniger, S. and Hunter, A.J.S., 2013. The 2012 free and open source GIS software map – a guide to facilitate research, development, and adoption. Computers, Environment and Urban Systems, 39, 136–150. doi:10.1016/j.compenvurbsys.2012.10.003
- Stern, R.E., 1990. Uncitedness in the biomedical literature. Journal of the American Society for Information Science, 41 (3), 193–196. doi:10.1002/(ISSN)1097-4571
- Stojanovski, J., Frančula, N., and Lapaine, M., 2015. Indexing of mapping science journals. Geography Environment Sustainability, 8 (1), 27–52. doi:10.15356/2071-9388
- Sugimoto, C.R., et al., 2013. Journal acceptance rates: a cross-disciplinary analysis of variability and relationships with journal measures. Journal of Informetrics, 7 (4), 897–906. doi:10.1016/j.joi.2013.08.007
- Sui, D. and Goodchild, M., 2011. The convergence of GIS and social media: challenges for GIScience. International Journal of Geographical Information Science, 25 (11), 1737–1748. doi:10.1080/13658816.2011.604636
- Sun, S., and Manson, S.M., 2011. Social network analysis of the academic GIScience community. The Professional Geographer, 63 (1), 18–33. doi:10.1080/00330124.2010.533560
- Tashakkori, H., Rajabifard, A., and Kalantari, M., 2015. A new 3D indoor/outdoor spatial model for indoor emergency response facilitation. Building and Environment, 89, 170–182. doi:10.1016/j.buildenv.2015.02.036
- Thelwall, M. and Maflahi, N., 2015. Are scholarly articles disproportionately read in their own country? An analysis of mendeley readers. Journal of the Association for Information Science and Technology, 66 (6), 1124–1135. doi:10.1002/asi.2015.66.issue-6
- Thomson Reuters, 2015. 2015 Journal citation reports®. New York: Thomson Reuters.
- Tian, Y., Wen, C., and Hong, S., 2008. Global scientific production on GIS research by bibliometric analysis from 1997 to 2006. Journal of Informetrics, 2 (1), 65–74. doi:10.1016/j.joi.2007.10.001
- Trapp, N., et al., 2015. A meta-analysis on the return on investment of geospatial data and systems: a multi-country perspective. Transactions in GIS, 19 (2), 169–187. doi:10.1111/tgis.12091
- Ugolini, D., et al., 2007. A bibliometric analysis of scientific production in cancer molecular epidemiology. Carcinogenesis, 28 (8), 1774–1779. doi:10.1093/carcin/bgm129
- Van Hooydonk, G., 1997. Fractional counting of multiauthored publications: consequences for the impact of authors. Journal of the American Society for Information Science, 48 (10), 944–945. doi:10.1002/(ISSN)1097-4571
- van Leeuwen, T.N., et al., 2000. First evidence of serious language-bias in the use of citation analysis for the evaluation of national science systems. Research Evaluation, 9 (2), 155–156. doi:10.3152/147154400781777359
- Van Leeuwen, T.N., et al., 2001. Language biases in the coverage of the Science Citation Index and its consequences for international comparisons of national research performance. Scientometrics, 51 (1), 335–346. doi:10.1023/A:1010549719484
- van Raan, A.F.J., 1998. The influence of international collaboration on the impact of research results. Scientometrics, 42 (3), 423–428. doi:10.1007/BF02458380
- van Raan, A.F.J., 2004. Sleeping Beauties in science. Scientometrics, 59 (3), 467–472. doi:10.1023/B:SCIE.0000018543.82441.f1
- Vaughan, L. and Shaw, D., 2008. A new look at evidence of scholarly citation in citation indexes and from web sources. Scientometrics, 74 (2), 317–330. doi:10.1007/s11192-008-0220-2
- Vieira, E.S. and Gomes, J.A.N.F., 2010. Citations to scientific articles: its distribution and dependence on the article features. Journal of Informetrics, 4 (1), 1–13. doi:10.1016/j.joi.2009.06.002
- Vinkler, P., 2008. Correlation between the structure of scientific research, scientometric indicators and GDP in EU and non-EU countries. Scientometrics, 74 (2), 237–254. doi:10.1007/s11192-008-0215-z
- Vosselman, G., 2012. U.V. Helava Award – best paper volume 66 (2011). ISPRS Journal of Photogrammetry and Remote Sensing, 71, iv.
- Wagner, C.S. and Leydesdorff, L., 2005. Network structure, self-organization, and the growth of international collaboration in science. Research Policy, 34 (10), 1608–1618. doi:10.1016/j.respol.2005.08.002
- Waltman, L., van Eck, N.J., and Wouters, P., 2013. Counting publications and citations: is more always better? Journal of Informetrics, 7 (3), 635–641. doi:10.1016/j.joi.2013.04.001
- Wang, J. and Liu, Z., 2014. A bibliometric analysis on rural studies in human geography and related disciplines. Scientometrics, 101 (1), 39–59. doi:10.1007/s11192-014-1388-2
- Wei, F., Grubesic, T.H., and Bishop, B.W., 2015. Exploring the GIS knowledge domain using CiteSpace. The Professional Geographer, 67 (3), 374–384. doi:10.1080/00330124.2014.983588
- World Bank, 2015. World development indicators 2015. Technical report. Washington, DC: The World Bank.
- Wright, D.J., Goodchild, M.F., and Proctor, J.D., 1997. Demystifying the persistent ambiguity of GIS as ‘tool’ versus ‘science’. Annals of the Association of American Geographers, 87 (2), 346–362. doi:10.1111/0004-5608.872057
- Xiang, H., Zhang, J., and Zhu, Q., 2015. Worldwide earthworm research: a scientometric analysis, 2000–2015. Scientometrics, 105 (2), 1195–1207. doi:10.1007/s11192-015-1725-0
- Yang, S., Needleman, H., and Niederman, R., 2001. A bibliometric analysis of the pediatric dental literature in MEDLINE. Pediatric Dentistry, 23 (5), 415–418.
- Yin, L. and Shaw, S.L., 2015. Exploring space–time paths in physical and social closeness spaces: a space–time GIS approach. International Journal of Geographical Information Science, 29 (5), 742–761. doi:10.1080/13658816.2014.978869
- Yoshimura, Y., et al., 2014. An analysis of visitors’ behavior in The Louvre Museum: a study using Bluetooth data. Environment and Planning B: Planning and Design, 41 (6), 1113–1131. doi:10.1068/b130047p
- Yu, G., Guo, R., and Yu, D.-R., 2006. The influence of the publication delay on journal rankings according to the impact factor. Scientometrics, 67 (2), 201–211. doi:10.1007/s11192-006-0094-0
- Zaugg, H., et al., 2011. Mendeley: creating communities of scholarly inquiry through research collaboration. Tech Trends, 55 (1), 32–36. doi:10.1007/s11528-011-0467-y
- Zhan, F.B., Gong, X., and Liu, X., 2014. Mark on the globe: a quest for scientific bases of geographic information and its international influence. International Journal of Geographical Information Science, 28 (6), 1233–1245. doi:10.1080/13658816.2013.847186
- Zheng, T., et al., 2015. A bibliometric analysis of industrial wastewater research: current trends and future prospects. Scientometrics, 105, 863–882. doi:10.1007/s11192-015-1736-x
- Zhou, P. and Pan, Y., 2015. A comparative analysis of publication portfolios of selected economies. Scientometrics, 105 (2), 825–842. doi:10.1007/s11192-015-1707-2
- Zhuang, Y., et al., 2013. Global remote sensing research trends during 1991–2010: a bibliometric analysis. Scientometrics, 96 (1), 203–219. doi:10.1007/s11192-012-0918-z