
ABSTRACT
Although mixed use is an emerging strategy that has been widely accepted in urban planning for promoting neighbourhood vibrancy, there is no consensus on how to quantitatively measure the mix and the effects of mixed use on neighbourhood vibrancy. Shannon entropy, the most commonly used diversity measurement in assessing mixed use, has been found to be inadequate in measuring the multifaceted, multidimensional characteristics of mixed use. And lack of data also makes it difficult to find the relationship between mixed use and neighbourhood vibrancy. However, the recent availability of new sources including mobile phone data and Point of Interest (POI) data have made it possible to develop new indices of mixed use and neighbourhood vibrancy to analyse their relationships. Taking advantage of these emerging new data sources, this study used the numbers of mobile phone users in a 24-hour period as a proxy of neighbourhood vibrancy and used POIs from a navigation database to develop a series of mixed-use indicators that can better reflect the multifaceted, multidimensional characteristics of mixed-use neighbourhoods. The Hill numbers, a unified form of diversity measurement used in ecological literature that includes richness, entropy, and the Simpson index, are used to measure the degrees of mixed use. Using such fine-grained data sets and the Hill numbers allowed us to obtain better insights into the relationship between mixed use and neighbourhood vibrancy. Four models varying in POI measurements that reflect different dimensions of mixed use were presented. The results showed that either POI density or entropy can explain approximately 1% of neighbourhood vibrancy, while POI richness contributes significantly in improving neighbourhood vibrancy. The results also revealed that the entropy has limitations as a measure for representing mixed use and demonstrated the necessity of adopting a set of more appropriate measurements for mixed use. Increasing the number of POIs has limited power to improve neighbourhood vibrancy compared with encouraging the mixing of complementary POIs. These exploratory findings may be useful for adjusting mixed-use assessments and to help guide urban planning and neighbourhood design.
1. Introduction
Mixed and multifunctional land uses have been identified as being able to promote urban vibrancy and yields socio-economic benefits (Jacobs Citation1961, Koster and Rouwendal Citation2012), therefore, mixed use has become a key strategy in New Urbanism and Smart Growth to promote urban vibrancy and sustainability (Song and Knaap Citation2004, Van Eck and Koomen Citation2008). By physically and functionally integrating diverse functions and providing pedestrian connections, mixed use also contributes greatly to urban design (Katz et al. Citation1994; Berghauser Pont and Haupt Citation2010).
Mixed use usually refers to a combination of residential, commercial, cultural, institutional, or industrial uses and has been summarized into three conceptual levels: (1) increasing the intensity of land uses, (2) increasing the diversity of uses, and (3) integrating segregated uses; however, ‘it is rarely defined’ in the literature (Grant Citation2002, p. 71, 73). As a result, some neighbourhoods planned with ‘mixed use’ in mind still lack vibrancy, while some other places might appear more disordered, but they are vibrant and attractive. The question of what is mixed use, how to mix its various contributing factors, or to what degree mixed use can promote neighbourhood vibrancy is worthy of further investigation.
Many approaches have been developed to measure mixed use quantitatively. Shannon entropy, in which high values indicate more mixed use and low values indicate the opposite, is the most widely used measure. However, it has been realized that entropy measures uncertainty rather than diversity (Jost Citation2006). Thus, Shannon entropy cannot comprehensively describe mixed use, and the concept and measurement of mixed use remains elusive and intangible (Manaugh and Kreider Citation2013). Furthermore, there are also difficulties in defining and measuring neighbourhood vibrancy because of the lack of an effective means to do so. Consequently, the question concerning the degree to which mixed use can promote neighbourhood vibrancy could still not be answered articulately.
Recent advances in sensor and positioning technologies may make it possible to measure neighbourhood vibrancy from an emerging data perspective. This study attempts to quantify and assess the relationship between mixed use using POIs from a navigation database and neighbourhood vibrancy from mobile phone data. In contrast to conventional land use data, POIs from navigation databases represent a much finer grained picture of land use at the building level and are good proxies for not only mixed but also multiple land uses (Louw and Bruinsma Citation2006). As for neighbourhood vibrancy, Jacobs (Citation1961) described it as a dense concentration of people because well-organized dense functional spaces generate adequate interactions and activities for creating vibrancy. Therefore, this study used the total number of people in a neighbourhood recorded by mobile phone cell towers as a proxy of for neighbourhood vibrancy. This study focuses on how to measure mixed use using POIs and the magnitude of the association between the POI-measured mixed use and cellular tower-measured neighbourhood vibrancy.
This study contributes to the existing literature in three aspects. First, we quantified the concepts of ‘mixed use’ and ‘neighbourhood vibrancy’ by taking advantage of emerging mobile phone and POI data sets. The POI data and mobile phone positioning data, to a great extent, make the two intangible concepts of mixed use and neighbourhood vibrancy measurable (Section 3). Second, we extended the commonly used Shannon entropy index to a unified diversity framework that can measure mixed use more comprehensively, overcoming the limitations of using only Shannon entropy to reflect mixed use (Section 4). Third, we obtained a more generalizable relationship between POI-based mixed use and neighbourhood vibrancy by employing the finer-grained data sets. We have quantitatively examined what mixed use is and to what extent it can contribute to neighbourhood vibrancy (Section 5).
2. Related work
A neighbourhood, by definition, is a shared space for space interaction (Chhetri et al. Citation2006). Neighbourhood vibrancy is reflected by urban activities and their interactions with spatial entities. A descriptive definition of urban vibrancy can be considered as the intensity of people’s concentration (Jacobs Citation1961). Montgomery (Citation1998, p. 6) noted that ‘successful urban places are based predominantly on street life, and the various ways in which activity occurs in and through buildings and spaces’, and summarized that density and mixed use are the top two conditions among the 12 essential physical conditions for creating a good urban place. A high or low level of activity intensity can be used as the essential and accurate proxy for urban vibrancy, and a mix of residential, recreation, commercial, and employment facilities is beneficial for the quality of neighbourhood vibrancy.
However, how to measure vibrancy or activity intensity has been problematic. Existing studies have tried to decompose this question into some measurable problems. For instance, accessibility to retail, transportation, and jobs (Bowes and Ihlanfeldt Citation2001, Merlino Citation2011), natural environment (Colwell et al. Citation2002; Smith and Miller Citation2013), socio-economic environment (Dubin and Sung Citation1990, Van Lenthe et al. Citation2005), and aesthetic concerns, amenities, and social interactions (Chhetri et al. Citation2006) are the major factors that have been examined. To our knowledge, although there is considerable literature on neighbourhood vibrancy, its association with mixed use has not been fully answered because of the lack of good quantitative measurements for both neighbourhood vibrancy and mixed use.
Recently, some advanced technologies have been employed to measure activity intensity and movements, as an alternative to travel surveys that inherently have low sampling rates and self-reporting biases. Shoval (Citation2008) used GPS traces to analyse the visitor impact on cities, which highlighted the possibility of using emerging new data sources in urban studies. However, GPS data are usually available only at relatively small scales. As the popularity of mobile phones – which can record people’s movements accurately – and the ability to examine high resolution data in both spatial and temporal dimensions, mobile phone data analysis has become a rapidly developing research field (Tranos and Nijkamp Citation2015). Some pioneer works have used mobile phone data to predict human mobility (Song et al. Citation2010), community, and geographical boundary detection (Calabrese et al. Citation2011). These studies improve the understanding of cities using extensive large-scale and fine-grained data. Recent studies on urban analysis (Ratti et al. Citation2006, Reades et al. Citation2009, Louail et al. Citation2014) and land use (Toole et al. Citation2012; Jacobs-Crisioni et al. Citation2014; Pei et al. Citation2014) have shown that mobile phone data are a good proxy not only for the space-time dynamics of human activity but also for land use classification. This study utilized mobile phone positioning data to measure neighbourhood vibrancy.
There is also an extensive body of literature devoted to the measurements of mixed use. Different indices of mixed use such as entropy, job ratio, accessibility, density, centricity, and network connectivity have been examined (Litman and Steele Citation2014). Among these, entropy is the most commonly used index and has been employed at various geographical scales (Cervero Citation1989, Frank and Pivo Citation1994). Recently, however, it has been realized that entropy reflects uncertainty rather than diversity because of limitations on how it is calculated (Jost Citation2006, Christian et al. Citation2011). Further study is needed to perfect existing measurements of mixed use. Furthermore, many land use studies have relied on official or self-reported data that has limited sampling rates and spatio-temporal resolutions. For instance, consider small businesses that open in residential buildings: parcel-level land use data cannot capture that diversity. Therefore, parcel-level land use maps may mask large variations within zones (Handy Citation1996).
Batty (Citation2010) noted that only quite recently, Information and Communication Technology (ICT) provides opportunities to access growing new data sources that enable us to observe and examine cities at the finest scales and gain a better understanding of the pulse of the city. Given this background, utilizing POI data to estimate land use is increasingly used – especially with the emerging public availability of POI data within map applications and social network check-ins. Because POI categories follow land use codes, studies have attempted to link POIs with land use classifications. Liu and Long (Citation2015) demonstrated the possibility of inferring parcel-level land use from Volunteered Geographic Information (VGI)-based POIs. Jiang et al. (Citation2015) utilized POIs to estimate employment density and concluded that, at a disaggregated level, land use estimation using POIs is more accurate than reliance on parcel-level land use maps. Both studies were validated against conventional land use data and found that some of the mismatches were caused by either outdated or too-coarse spatial resolution of conventional land use data. This result suggests the feasibility of using POIs as an alternative to land use data. However, both studies noted the limitations of using VGI-based POIs, which include data completeness, accuracy, and taxonomy issues. In contrast, because a complete POI data set from a navigation database was available, this study used that official POI data set instead of VGI-based POIs.
It is often believed that mixed use is also relevant to land use intensity, balance, diversity/mix/integration, and accessibility (Kockelman Citation1997). In this sense, other terms have also been used to investigate the mixed-use problem, for instance, built environment, new urbanism, and urban form. The effects of mixed use on travel demand, public health, and urban economics have been extensively examined under the framework of mixed use or sustainability. The primary methods used to conduct the analyses were linear regression and logistic regression. Details can be found in Ewing and Cervero (Citation2010). Although the overall literature reveals some insights that favour of dense and mixed land use, there is little consensus concerning how to gauge the effects of mixed use (Handy Citation2008, Ewing and Cervero Citation2010, Manaugh and Kreider Citation2013). Therefore, a consistent and more generalizable measure of mixed use is of great importance.
3. Study area and data
The area of this study is Shenzhen, China, which is situated immediately north of Hong Kong and is one of most developed cities in southern China. According to a recent census, Shenzhen has a population of approximately 15 million residents in an area of approximately 2000 km2.
Because the number of people in a place across different time is regarded as one of the most prominent features of urban vibrancy (Jacobs Citation1961, Montgomery Citation1998), this study used the accumulated number of mobile phone users in a working day as a proxy for neighbourhood vibrancy. We are aware that neighbourhood vibrancy is a general concept that can be defined in both physical and intangible dimensions, and we are not trying to argue that the number of people attracted to an area comprehensively represents neighbourhood vibrancy. However, compared with traditional travel survey data or GPS data, mobile phone records have higher sample rates; thus, they constitute an accurate form of measurement to represent neighbourhood vibrancy.
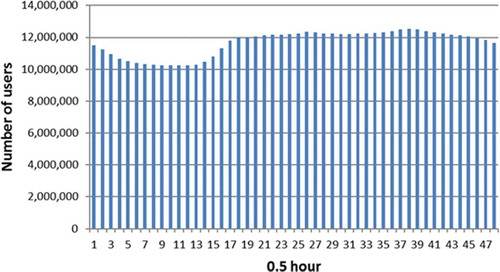
The mobile phone data used in this study is the total number of mobile phone users actively recorded by cell towers over half-hour intervals. These records differ from the commonly used call detail records (CDR) that passively collect user numbers via records of calls and text messages (Isaacman et al. Citation2011; Toole et al. Citation2012; Pei et al. Citation2014); the data set used in this study does not require actual mobile phone usage (e.g., calls or texts), thus, it has a much finer spatial–temporal granularity than that of CDRs. Although the time span of the data set is only one working day (a Friday) in 2012, it was provided by one of the major mobile phone operators and recorded the space-time locations of approximately 12 million users – approximately 80% population of the study area. shows the number of people recorded by cell towers every half an hour over the entire day. It can be observed that the data only have a relatively moderate drop rate at night, and does not have a significant temporal variation relating to human activity and mobile phone usage patterns comparing to that of CDRs. In addition, as most people in Shenzhen have mobile phones and this data set is from the major mobile phone operator in the area, this data set is more objective, reliable, and extensive than travel diary or travel survey data. It has the advantage of overcoming the limitations of conventional data, which are constrained by both sample size and self-reporting bias. Thus, this mobile phone data set can represent the spatial–temporal rhythm of the city to a great extent.
Figure 1. Number of people recorded by cell towers every half an hour.
The spatial coverage of this mobile phone data set is determined by approximately 6000 cell towers. Earlier studies have noted that the actual serving areas of cell towers are created by the mobile phone service provider and could not be disclosed to the public (Jacobs-Crisioni et al. Citation2014). Consequently, in most mobile phone data related studies, cell tower coverage areas were defined by Voronoi tessellations, where each Voronoi polygon corresponded to the estimated service area of one cell tower. However, before we used the data set, we conducted a field investigation at some major residential areas and office buildings to estimate the number of people in those areas to evaluate the accuracy of counting mobile phone users by Voronoi partitions. This preliminary field investigation proved that the error rate of the Voronoi partition method was much larger than expected. For example, one area has several tall office buildings containing thousands of people; however, according to the Voronoi partition, the population was less than 100 even during working hours. Moreover, we found that this was not an exceptional situation. Therefore, defining cell tower coverage maps using Voronoi partitions is not a feasible approach.
Because existing studies do not have a better solution for identifying cell tower coverage areas, and the focus of this study is neighbourhoods, we adopted the officially defined Traffic Analysis Zones (TAZs) as the spatial units to define the neighbourhoods and calculate their 24-hour accumulated population. Spatial definitions of neighbourhoods are flexible among different domains. Although some TAZs may not equal a neighbourhood, they are a type of basic geographic unit that is especially useful for travel survey and transportation planning. Another reason for using the TAZ data set is that TAZs have demographic attributes such as population and employment figures that are essential for the study of neighbourhoods. This study first identified the cell towers located in each TAZ and then totalled the records from these cell towers as the TAZ 24-hour accumulated population. We understand that the numbers may not be perfectly accurate, but they can represent general usage patterns in the TAZs – at the very least, they are no worse than travel survey data.
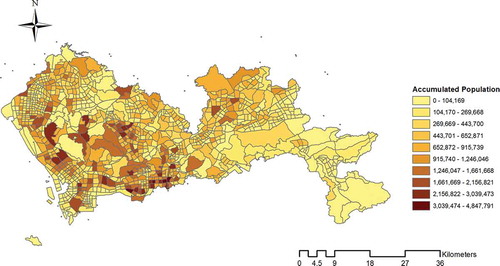
The study area includes 1112 TAZs with an average size of approximately 1.8 km2; however, only the 935 TAZs with cell tower data were used in this study because some TAZs consist of green space or reserved areas that contain no cell towers. By adding the mobile phone data, the TAZ data set shifted from static to dynamic, including not only the census data but also the population residing in or entering each TAZ every half hour. Even aggregated, these TAZ-based records of people’s locations and movement still have a high degree of accuracy and representativeness. shows the geographic variation of the 24-hour accumulated population collected by cell towers, using TAZs as the basic spatial unit.
Figure 2. Geographic variation in 24-hour accumulated population in the study area (TAZ-based).
As Jacobs (Citation1961) commented, fine-grained mixing of diverse uses creates vibrant and successful neighbourhoods. Consequently, this study examined mixed use using POI data that represents the most fine-grained land use rather than conventional parcel-level land use data. Unlike existing POI-based studies, which have mainly used POIs from check-ins or geo-tagged photos, this study used a set of POIs collected for navigational purposes, which include all the officially registered POIs in a map database. This data can overcome the incompleteness or sampling bias issues in VGI-based POI data sets. Moreover, compared with conventional land use data, POI data can help us understand mixed use not only within neighbourhoods but also within building blocks – both horizontally and vertically.
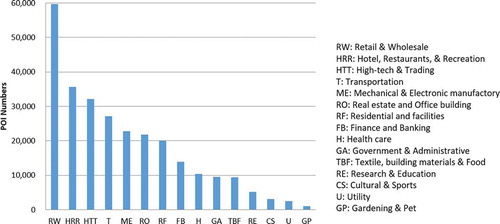
The POI database used in this study has 274,022 POIs that belong to 64 subcategories of 15 primary categories. shows the corresponding numbers of POIs in the 15 categories. Although the POI categories are not the same as conventional land use types, they follow the land use codes and can reflect land use types. Moreover, it is POIs that create neighbourhood interaction, not the land use maps. As a result, POI data has the possibility to describe land use at disaggregated level. It has a finer grain than conventional land use map.
Figure 3. Number of POIs at each category.
In general, the fine-grained and extensive data sets used in this study provide an opportunity to explore the association between mixed use and neighbourhood vibrancy more accurately and provide better insights. The next section discusses the indices for measuring mixed use or POI diversity in this study context.
4. Indices for measuring mixed use
To reveal the association between mixed use and neighbourhood vibrancy, the first step is to measure and quantify mixed use. Related literature suggests a wide range of variables that are correlated with mixed use. In addition to density such as population density or employment density, Shannon entropy is the most widely used diversity index to measure the extent of mix/evenness in the distribution of land use types (Christian et al. Citation2011, Manaugh and Kreider Citation2013). However, entropy yields uncertainty rather than diversity (Jost Citation2006). Jost (Citation2006) used an ecological example to illustrate this problem; the Shannon entropy (log 2(x)) of an area having 16 equally common species is 4.0, while the Shannon entropy of another area having 8 equally common species is 3.0. Thus, what it measures is the uncertainty in identifying a sample, while the ‘diversity’ it measures is not proportional to the number of species. Therefore, ‘Entropies are reasonable indices of diversity, but this is no reason to claim that entropy is diversity’ (Jost Citation2006, p. 363). In addition to entropy, concentration or the Herfindahl index (also known as the Herfindahl–Hirschfield index, HHI), is another commonly used economic measure for marketplace and industry concentration or competition (Adelman Citation1969). This index is equivalent to the Simpson diversity index used in ecology and to the inverse participation ratio (IPR) in physics. They both measure the probability that two entities taken at random from the data set of interest represent the same type.
Other indices have also been used in various scenarios, and each has its own strengths for describing a certain aspect of diversity, but they are not adequate for describing diversity independently. Researchers in various disciplines have increasingly recognized that diversity cannot be completely characterized by a single measure and attempting to do so may be misleading (Li and Wu Citation2004, Chao et al. Citation2015). Song et al. (Citation2013) conducted a review of some land use mix measures and found that most of the common measures they reviewed have strong correlations; in fact, some can be used interchangeably. They hypothesized that a mathematical relationship likely underpins these measures.
Meanwhile, diversity is one of the most discussed topics in ecology and biogeography. An extensive body of literature addresses the measure of diversity in this field. Ecologists have unified diversity indices into a form called Hill numbers (MacArthur Citation1965, Hill Citation1973, Jost Citation2006, Chao et al. Citation2014). Hill numbers provide a unifying quantitative framework for completely characterizing species abundance distributions in ecological assemblages. The details of the proof can be found in Jost (Citation2006). This study considered Hill numbers as a better measurement of POI diversity for reflecting multifaceted, multidimensional mixed use. Hill numbers achieve multifaceted diversity measurements by order q, which determines the measures’ emphasis on rare or common species:
Here, D is the diversity, s is the number of species, and the ith species has a relative abundance of pi. The parameter q is the ‘order’ of the diversity, which indicates its sensitivity to the relative abundances.
When q = 0, it is the richness index:
In the land use and POI context, it reports the number of different land use or POI categories present in a particular area. The presence of a greater number of POI categories indicates a ‘richer’ area. The measure is completely insensitive to the number of POIs within a certain category.
When q = 1, it changes to the exponential of the Shannon entropy that is characterized by its ability to weigh elements by their frequency, without disproportionately favouring any element:
As a POI diversity measurement, it reflects the amount of order in both POI categories and in the number of POIs. A higher entropy value corresponds to reduced orderliness or randomness, while a lower entropy value corresponds to greater orderliness.
Finally, q = 2 is the inverse of Simpson index:
The Simpson index measures the probability that two individuals randomly selected from a sample will belong to the same categories; therefore, it takes into account POI richness, as well as the relative abundances of different types of POIs, that is, evenness. As mentioned earlier, it is usually used to represent concentration. It should be noted that the evenness or concentration does not have spatial context.
In summary, Hill numbers is a mathematically unified form of diversity indices and does not depend on the functional form of the index. Because q = 0, 1, and 2 are the most commonly used orders, this study adopted Richness(POI), Entropy(POI), and Simpson(POI) under the Hill numbers framework to portray a more complete picture of mixed land use among neighbourhoods by measuring POI diversity. The series of maps shown in present a general image of the levels of POI diversity as measured the by three indices, which reflect POI richness, orderliness, and concentration, respectively. It can be observed that the three indices represent the mixed use from different perspectives. In general, the urban centre areas have relatively higher richness and entropy indices ,), while the suburban areas have a relatively higher Simpson index ) because most of the suburbs in the study area are characterized by manufacturing facilities. Land uses are not as mixed as they are in the urban centres.
Figure 4. Variation in the mixed use in the study area. (a) Geographic variation in Richness(POI) (Hill numbers,). (b) Geographic variation in Entropy(POI) (Hill numbers,
). (c) Geographic variation in Simpson(POI) (Hill numbers,
).
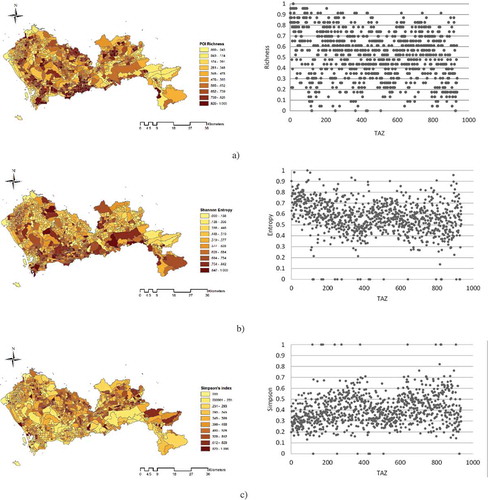
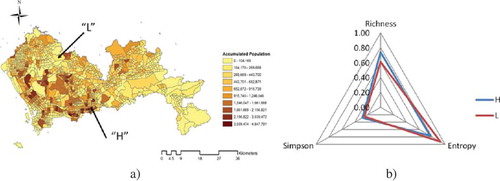
Figure 5. POI-based mixed-use indices of two TAZs with different neighbourhood vibrancy. (a) The locations of the two TAZs; (b) POI diversity indices of the two TAZs.
In summary, Richness(POI), Entropy(POI), and Simpson(POI) indices that measured POIs richness, orderliness, and concentration, respectively were used in this study to measure mixed use, under the framework of the Hill numbers. All the indices were aggregated at the TAZ level.
lists the descriptive statistics of the three diversity dimensions of mixed use with POIs, together with their respective TAZ demographic data (population, employment, area) and density (population density, employment density, POI density) measured by per square kilometre.
Table 1. Descriptive statistics of independent variables.
The average population and employment density were approximately 15,000 persons/km2 and 5700 persons/km2, respectively, with an average employment–population ratio of 0.88/km2. This study normalized the Richness(POI), Entropy(POI), and Simpson(POI) indices. While the Richness(POI) and the Entropy(POI) have similar mean values, Entropy(POI) and Simpson(POI) have similar standard deviations and variances. Based on the POI diversity indices, the next section explores the relationship between the POI-based mixed use and neighbourhood vibrancy.
5. POI-based mixed use and neighbourhood vibrancy
5.1. Model specification
To assess the association of the above POI-based mixed-use indices with neighbourhood vibrancy, a series of linear regressions was conducted. The dependent variable is the total accumulated population over 24 hours as recorded by cell towers in the TAZs. The independent variables include a group of basic demographic variables in addition to the POI-based mixed-use indices. The basic variables are the demographic data associated with TAZ population density, employment density, employment–population ratio, and area, as introduced in the data section. Four models were used to examine the effects of the POI-based mixed-use indices on neighbourhood vibrancy as outlined in . The first model served as the base model which included only the TAZ demographic data described above (population density, employment density, employment–population ratio, and area) as the independent variables without the POI-based mixed-use indices. The POI-based mixed-use indices were added incrementally to examine their respective effects on neighbourhood vibrancy. For comparison purposes, Model 2 included POI density as an additional independent variable. Model 3 added the entropy index based on Model 1, and Model 4 extended Model 3 by adding the Richness(POI) and Simpson(POI) indices. This study does not consider POI spatial concentration or dispersal which may need further examination.
Table 2. Summary of independent variables used in the five models.
5.2. Results
Because areas with larger populations tend to attract more people, partial correlations between the attracted population and the POI-based mixed-use indices were computed to adjust for TAZ area size, population, and employment to avoid the inherent bias of population size. The results are presented in . The total attracted population is significantly correlated with the Richness(POI) (r = 0.230, p < 0.001) and the Entropy(POI) (r = 0.103, p < 0.001) when controlling for the impact of TAZ size, population, and employment. In other words, the relationships among the attracted population, Richness(POI), and Entropy(POI) are not due to the three control variables.
Table 3. Partial correlations among variables, adjusting for area, population, and employment.
Based on the preliminary tests, the four models were run to examine the relationship between POI-based mixed use and neighbourhood vibrancy, and the results are reported in .
Table 4. Regression results on the relationship between POI-based mixed use and neighbourhood vibrancy (n = 935).
As expected, population density, employment density, and employment–population ratio are strongly correlated with neighbourhood vibrancy. The result of Model 1 shows that demographic variables account for approximately 60% of the variance. Then, we investigated what happens as the number of POIs increases.
Intuitively, increasing the POI density could contribute to neighbourhood vibrancy. Model 2 added POI density as an additional variable to the basic demographic model in Model 1. However, unexpectedly, POI density has little effect (the adjusted R2 is 0.625 compared with 0.624 in Model 1). This result implies that the density of POIs might not account for neighbourhood vibrancy and is consistent with a previous urbanity study argument that ‘density in itself will not necessarily produce urbanity: density is a necessary rather than a sufficient condition for urbanity’. (Montgomery Citation1998, p. 103).
In Model 3, when the POI entropy index was added based on Model 1, the total amount of variance explained is same as that of Model 2 (R2 = 0.625). So does the squared semipartial correlations sr2, the R-square change value (0.036 vs. 0.034). In this case, the degree of mixed use represented by Entropy(POI) could not contribute to neighbourhood vibrancy. This result agrees with that of Manaugh and Kreider (Citation2013) in which the ability of entropy to represent land use diversity in explaining land use mix was very slight.
In Model 4, both the Richness(POI) and Simpson(POI) were included to represent POI-based mixed use together with the Entropy(POI), which yielded significant results (adjusted R2 = 0.734). The confidence of the Richness(POI) is strengthened by its R-square change value sr2. This provides evidence that POI richness together with employment density has the strongest association with neighbourhood vibrancy in this study. Intuitively, this seems to be correct, as POI richness, to a certain extent, represents complementary or heterogeneity, or the ‘mixture’ of POIs. Vibrant urban places tend to be sufficiently complex to be self-sustaining and to stimulate public contact, transactions, and street life. Assuming that this study had adopted entropy as the measurement of mixed use, a negative result would have been reported. Moreover, this study would have provided the misleading result that mixed use cannot promote neighbourhood vibrancy. Therefore, adopting the appropriate indices is necessary to better capture the multifaceted diversity or the degree of mixed use. The negative coefficient of Simpson(POI) conforms to economies of agglomeration, or clustering effect, because for a given Richness(POI), the Simpson(POI) increases as evenness increases. This suggests that neighbourhood vibrancy might benefit from agglomeration of POIs.
The results show that neighbourhood vibrancy – as measured by the number of people attracted to it – is primarily a function of the socio-economic characteristics of the neighbourhood and secondarily a function of the POI richness. There is no strong association between POI density, POI entropy, and neighbourhood vibrancy in this study. The usefulness of adopting the Hill numbers as the mixed use measurement has been proven by significantly improving the explained variance in comparison to the commonly used entropy index.
To look closer, ) shows two TAZs with relatively lower neighbourhood vibrancy (marked by ‘L’) and relatively higher neighbourhood vibrancy (marked by ‘H’) to illustrate the variance of their POI diversity indices. The cell towers in ‘L’ recorded a total population of 130,895 over 24 hours, while ‘H’ recorded a population of 1,177,677. shows their corresponding POI diversity indices. As shown, the ‘L’ TAZ with relatively lower neighbour vibrancy had higher Entropy(POI) than that of the ‘H’ TAZ. Therefore, using entropy as the only index to measure POI diversity or mixed use would yield a misleading result. Because both had similar Simpson(POI) values, the TAZ with relatively high neighbourhood vibrancy had a higher Richness(POI).
The results might be better explained by dividing the data for the entire day into time periods such as daytime, evening, and night-time periods to examine their corresponding travel patterns. Considering specific land use types or POI categories might also help to improve the explanation. In addition to TAZ, other approaches for defining neighbourhoods could be adopted according to specific scenarios.
6. Discussion and conclusions
Mixed use first gained public attention greatly owing to Jacobs (Citation1961) who advocated a balanced mix of working, service, and living activities for a lively, stimulating, and secure public realm in the city. Since the 1980s, encouraged by theories such as sustainable development and New Urbanism, mixed use has regained favour because it holds the promise of restoring economic vitality, social equity, and environmental quality and has now become a re-emerging focus of urban planning and design (Grant Citation2002). However, ‘What is mixed use?’, ‘How can we measure mixed use?’, and ‘To what degree can mixed use contribute to neighbourhood vibrancy?’ have not been fully answer due to the lack of appropriate data and measurement approaches. Taking advantage of emerging new data sources, this study first quantified the concepts of ‘mixed use’ and ‘neighbourhood vibrancy’ using mobile phone and POI data sets, respectively, which make the two intangible concepts measurable with finer spatio-temporal granularity, and avoid the biases caused by limited sampling rate, or some relatively subjective measurements in questionnaires. This could improve our understanding on urban and mixed-use analysis. Recognizing the limitation of entropy in measuring diversity, this study adopted the Hills number, a unified diversity framework, to develop POI-based mixed-use indices that include not only entropy but also richness and the Simpson index. These measures better reflect the multifaceted mixed-use dimensions of richness, orderliness (as measured by Entropy(POI)), and concentration (as measured by Simpson(POI)). Then, we quantitatively examined to what extent mixed use can contribute to neighbourhood vibrancy. The results confirmed some empirical evidences for the effects of mixed use on neighbourhood vibrancy. However, if entropy was the only mixed-use diversity index as in previous studies, the relationship between mixed use and neighbourhood vibrancy would not be able to be unveiled.
It should also be noted that, one of the findings of the study makes us reconsider the influence of density on neighbourhood vibrancy. The analyses showed that, increasing POI density has very limited effect in improving neighbourhood vibrancy as compared with that of encouraging mixing of complementary POI provisions. The findings may have implications for developing compact cities. Moreover, since neighbourhood vibrancy and attractiveness could be estimated based on its POI configuration, it will be possible for the related planning and project management process to become quantitatively assessed.
In summary, the exploratory results of this study bring insights to the relationship between mixed use and neighbourhood vibrancy by using available mobile phone data and POIs. The use of the Hills numbers can represent the multifaceted multidimensional characteristics of mixed use better than traditional entropy measurement. Although some of the variance in neighbourhood vibrancy remains unexplained, a number of insights about neighbourhood vibrancy emerged such as the mixing of complementary POIs and the limited effect of POI density. The findings can provide insights for adjusting mixed-use assessment and guiding urban planning and neighbourhood design, and also could be combined into modelling location choice, or evaluating property prices.
Disclosure statement
No potential conflict of interest was reported by the authors.
Additional information
Funding
Related Research Data
References
- Adelman, M.A., 1969. Comment on the ”H” concentration measure as a numbers-equivalent. The Review of Economics and Statistics, 51 (1), 99–101. doi:10.2307/1926955
- Batty, M., 2010. The pulse of the city. Environment and Planning B: Planning and Design, 37 (4), 575–577. doi:10.1068/b3704ed
- Berghauser Pont, M. and Haupt, P., 2010. Spacematrix: space, density and urban form. Rotterdam: Nai Publishers.
- Bowes, D.R. and Ihlanfeldt, K.R., 2001. Identifying the impacts of rail transit stations on residential property values. Journal of Urban Economics, 50 (1), 1–25. doi:10.1006/juec.2001.2214
- Calabrese, F., et al., 2011. The connected states of America: quantifying social radii of influence. In: Proceeding of privacy, security, risk and trust and 2011 IEEE third international conference on social computing, 9–11 October, Boston, MA. IEEE, 223–230.
- Cervero, R., 1989. America’s suburban centers: the land use-transportation link. London: Routledge.
- Chao, A., Chiu, C.-H., and Jost, L., 2014. Unifying species diversity, phylogenetic diversity, functional diversity, and related similarity and differentiation measures through hill numbers. Annual Review of Ecology, Evolution, and Systematics, 45, 297–324. doi:10.1146/annurev-ecolsys-120213-091540
- Chao, A., et al., 2015. Expected Shannon entropy and Shannon differentiation between subpopulations for neutral genes under the finite island model. PloS One, 10 (6), e0125471. doi:10.1371/journal.pone.0125471
- Chhetri, P., Stimson, R.J., and Western, J.S., 2006. Modelling the factors of neighbourhood attractiveness reflected in residential location decision choices. Studies in Regional Science, 36 (2), 393–417. doi:10.2457/srs.36.393
- Christian, H.E., et al., 2011. How important is the land use mix measure in understanding walking behaviour? Results from the RESIDE study. International Journal of Behavioral Nutrition and Physical Activity, 8 (55), 10–1186. doi:10.1186/1479-5868-8-55
- Colwell, P.F., Dehring, C.A., and Turnbull, G.K., 2002. Recreation demand and residential location. Journal of Urban Economics, 51 (3), 418–428. doi:10.1006/juec.2001.2251
- Dubin, R.A. and Sung, C.-H., 1990. Specification of hedonic regressions: non-nested tests on measures of neighborhood quality. Journal of Urban Economics, 27 (1), 97–110. doi:10.1016/0094-1190(90)90027-K
- Ewing, R. and Cervero, R., 2010. Travel and the built environment: a meta-analysis. Journal of the American Planning Association, 76 (3), 265–294. doi:10.1080/01944361003766766
- Frank, L. and Pivo, G., 1994. Impact of mixed use and density utilization of three modes of travel: single-occupant vehicle, transit, and walking. Transportation Research Record: Journal of the Transportation Research Board, 1466, 44–52.
- Grant, J., 2002. Mixed use in theory and practice: Canadian experience with implementing a planning principle. Journal of the American Planning Association, 68 (1), 71–84. doi:10.1080/01944360208977192
- Handy, S., 1996. Methodologies for exploring the link between urban form and travel behavior. Transportation Research Part D: Transport and Environment, 1 (2), 151–165. doi:10.1016/S1361-9209(96)00010-7
- Handy, S., 2008. Regional transportation planning in the US: an examination of changes in technical aspects of the planning process in response to changing goals. Transport Policy, 15 (2), 113–126. doi:10.1016/j.tranpol.2007.10.006
- Hill, M., 1973. Diversity and evenness: a unifying notation and its consequences. Ecology, 54, 427–432. doi:10.2307/1934352
- Isaacman, S., et al., 2011. Identifying important places in people’s lives from cellular network data. In: ACM, ed. 9th international conference on pervasive computing, 12–15 June 2011. San Francisco: Springer Berlin Heidelberg, 133–151.
- Jacobs, J., 1961. The death and life of Great American cities. New York: Random House.
- Jacobs-Crisioni, C., et al., 2014. Evaluating the impact of land-use density and mix on spatiotemporal urban activity patterns: an exploratory study using mobile phone data. Environment and Planning A, 46 (11), 2769–2785. doi:10.1068/a130309p
- Jiang, S., et al., 2015. Mining point-of-interest data from social networks for urban land use classification and disaggregation. Computers Environment and Urban Systems, 53, 36–46. doi:10.1016/j.compenvurbsys.2014.12.001
- Jost, L., 2006. Entropy and diversity. Oikos, 113 (2), 363–375. doi:10.1111/oik.2006.113.issue-2
- Katz, P., Scully, V.J., and Bressi, T.W., 1994. The new urbanism: toward an architecture of community (Vol. 10). New York: McGraw-Hill.
- Kockelman, K.M., 1997. Travel behavior as function of accessibility, land use mixing, and land use balance: evidence from San Francisco Bay Area. Transportation Research Record: Journal of the Transportation Research Board, 1607 (1), 116–125. doi:10.3141/1607-16
- Koster, H.R. and Rouwendal, J., 2012. The impact of mixed land use on residential property values. Journal of Regional Science, 52 (5), 733–761. doi:10.1111/j.1467-9787.2012.00776.x
- Li, H. and Wu, J., 2004. Use and misuse of landscape indices. Landscape Ecology, 19 (4), 389–399. doi:10.1023/B:LAND.0000030441.15628.d6
- Litman, T. and Steele, R., 2014. Land use impacts on transport—how land use factors affect travel behavior. Victoria, BC: Victoria Transport Policy Institute.
- Liu, X. and Long, Y., 2015. Automated identification and characterization of parcels with OpenStreetMap and points of interest. Environment & Planning B Planning & Design. doi:10.1177/0265813515604767
- Louail, T., et al., 2014. From mobile phone data to the spatial structure of cities. Scientific Reports, 4 (2973), 61–61. doi:10.1038/srep05276
- Louw, E. and Bruinsma, F., 2006. From mixed to multiple land use. Journal of Housing & the Built Environment, 21 (1), 1–13. doi:10.1007/s10901-005-9029-y
- MacArthur, R.H., 1965. Patterns of species diversity. Biological Reviews, 40, 510–533. doi:10.1111/brv.1965.40.issue-4
- Manaugh, K. and Kreider, T., 2013. What is mixed use? Presenting an interaction method for measuring land use mix. Journal of Transport and Land Use, 6 (1), 63–72.
- Merlino, K.R., 2011. Urban grain and the vibrancy of older neighborhoods: metrics and measures. In: Proceedings of the ARC spring research conference considering research: reflecting upon current themes in architectural research, 20–24 April, Lawrence Technological University, Southfield, MI, 477–489.
- Montgomery, J., 1998. Making a city: urbanity, vitality and urban design. Journal of Urban Design, 3 (1), 93–116. doi:10.1080/13574809808724418
- Pei, T., et al., 2014. A new insight into land use classification based on aggregated mobile phone data. International Journal of Geographical Information Science, 28 (9), 1988–2007. doi:10.1080/13658816.2014.913794
- Ratti, C., et al., 2006. Mobile landscapes: using location data from cell phones for urban analysis. Environment and Planning B: Planning and Design, 33 (5), 727–748. doi:10.1068/b32047
- Reades, J., Calabrese, F., and Ratti, C., 2009. Eigenplaces: analysing cities using the space-time structure of the mobile phone network. Environment and Planning B: Planning and Design, 36 (5), 824–836. doi:10.1068/b34133t
- Shoval, N., 2008. Tracking technologies and urban analysis. Cities, 25 (1), 21–28. doi:10.1016/j.cities.2007.07.005
- Smith, R. and Miller, K., 2013. Ecocity mapping using GIS: introducing a planning method for assessing and improving neighborhood vitality. Progress in Community Health Partnerships: Research, Education, and Action, 7 (1), 95–106. doi:10.1353/cpr.2013.0000
- Song, C., et al., 2010. Limits of predictability in human mobility. Science, 327 (5968), 1018–1021. doi:10.1126/science.1177170
- Song, Y. and Knaap, G.J., 2004. Measuring the effects of mixed land uses on housing values. Regional Science and Urban Economics, 34 (6), 663–680. doi:10.1016/j.regsciurbeco.2004.02.003
- Song, Y., Merlin, L., and Rodriguez, D., 2013. Comparing measures of urban land use mix. Computers, Environment and Urban Systems, 42, 1–13. doi:10.1016/j.compenvurbsys.2013.08.001
- Toole, J.L., et al., 2012. Inferring land use from mobile phone activity. In: ACM, ed. Proceedings of the ACM SIGKDD international workshop on urban computing, 12–16 August. Beijing: ACM, 1–8.
- Tranos, E. and Nijkamp, P., 2015. Mobile phone usage in complex urban systems: a space–time, aggregated human activity study. Journal of Geographical Systems, 17 (2), 157–185. doi:10.1007/s10109-015-0211-9
- Van Eck, J.R. and Koomen, E., 2008. Characterising urban concentration and land-use diversity in simulations of future land use. The Annals of Regional Science, 42 (1), 123–140. doi:10.1007/s00168-007-0141-7
- Van Lenthe, F.J., Brug, J., and Mackenbach, J.P., 2005. Neighbourhood inequalities in physical inactivity: the role of neighbourhood attractiveness, proximity to local facilities and safety in the Netherlands. Social Science & Medicine, 60 (4), 763–775. doi:10.1016/j.socscimed.2004.06.013