
ABSTRACT
This paper aims to contribute to the area of geodemographic research through the development of a new and novel flow-based classification of commuting for England and Wales. In doing so, it applies an approach to the analysis of commuting in which origin-destination flow-data, collected as part of the 2011 census of England and Wales, are segmented into groups based on shared similarities across multiple demographic and socioeconomic attributes. k-Means clustering was applied to 49 flow-based commuter variables for 513,892 interactions that captured 18.4 million of the 26.5 million workers recorded as part of the 2011 census of England and Wales. The final classification resulted in an upper-tier of nine ‘Supergroups’ which were subsequently partitioned to derive a lower-tier of 40 ‘Groups’. A nomenclature was developed and associated pen portraits derived to provide basic signposting to the dominant characteristics of each cluster. Analysis of a selection of patterns underlying the ninefold Supergroup configuration revealed a highly variegated structure of commuting in England and Wales. The classification has potentially wide-ranging descriptive and analytical applications within research and policy domains and the approach would be equally transferable to other countries and contexts where origin-destination data are disaggregated based on commuter characteristics.
Introduction
This paper reports on the development of a new and novel geodemographic classification of commuting flows for England and Wales. Conventional modelling frameworks have often struggled to explain complex commuting behaviour because of their assumptions of the existence of a ‘normal’ commuter population; their focus on idealised spatial structures; or their focus on aggregate flow dynamics (van der Laan et al. Citation1998, Sohn Citation2005). Through the extension or re-specification of conventional approaches, recent research has demonstrated the continued utility of commuting-based modelling approaches (LeSage and Pace Citation2008, Masucci et al. Citation2013, LeSage and Thomas-Agnan Citation2015). However, we support the contention that whilst conventional models of commuting have potential to inform decision-making processes, ‘… new approaches are needed to advance knowledge about the social and geographical factors that relate to the diversity of commuter patterns, if policies targeted to specific individuals or places are to be effective’ (Lovelace et al. Citation2014: 282).
This reasoning demands approaches that are capable of differentiating between the types of places, individuals or groups that would benefit from further targeting of mobility-related intervention (Ponti et al. Citation2013). In this vein, Lovelace et al. (Citation2014) suggest that spatial microsimulation approaches might be used to better understand the social and geographical factors that affect the diversity of commuting patterns. We contend that there is also potential for wider use of geodemographic approaches in the analysis of commuting (Longley and Adnan Citation2016). As part of the 2011 census of England and Wales, data were collected on commuting between usual residence and place of work for people aged 16 and over who were in employment in the week before the census. These origin-destination data are referred to as Special Workplace Statistics (SWS) and have been previously used to examine commuting flows and to visualise place-based interactions (Rae Citation2016). However, to our knowledge, the SWS data have yet to be used in the development of a geodemographic classification of commuting in which flows, measured from an origin to a destination, are simplified into groups based on shared similarities across multiple demographic and socioeconomic attributes.
In light of this gap, the aim of this paper is to contribute to the area of geodemographic research through the development of a new flow-based classification of commuting that has the potential to inform transport investment decision-making and policy evaluation. The remainder of the paper is structured as follows. The next section provides a background to the development of the flow-based classification drawing on existing research in the areas of geodemographics and commuting. The third section outlines the methodology that was used to develop the commuting flow classification for England and Wales. In the fourth section, the application of the classification is explored through select examples of commuting structures and patterns. The final section draws the paper together by reflecting on the utility of the classification for understanding commuting and considers areas for further development.
Background: geodemographics and commuting
Geodemographic systems are created when large volumes of georeferenced data are subjected to classification methods to identify homogenous groups based on multiple demographic and socioeconomic characteristics (Vickers and Rees Citation2011). In the UK, census data have formed the backbone of many small area residential classifications since the early 1970s (Longley Citation2005, Singleton and Spielman Citation2014). Following the 2001 census of England and Wales, a small area residential classification was developed for the then newly introduced geography of Output Areas. In England and Wales, Output Areas were constructed from clusters of adjacent unit postcodes and were developed to be as socially homogenous as possible. In developing the 2001 Output Area Classification, 41 variables were subjected to clustering. An innovation introduced here was the use of k-means clustering to generate a nested classification of broad Supergroups and more detailed Groups (Vickers and Rees Citation2007). The approach used to create the 2001 Output Area Classification has since been used in the development of the equivalent 2011 classification – albeit with some modification (Gale et al. Citation2016). It has also been modified and used in the development of a geodemographic classification of workplace zones using 2011 census data for England and Wales. Workplace zones were introduced in England and Wales to overcome long-standing problems associated with representing workplace population through residential-based census units (Debenham et al. Citation2003, Martin et al. Citation2013). As such, the 2011 workplace zone classification is based on the characteristics of the population working in the area rather than those living there (Cockings et al. Citation2015).
The research reported in this paper is intended to contribute to the UK tradition of geodemographic research through the development of a novel classification of commuting flows in which origin-destination flow-data are segmented based on a combination of demographic and socioeconomic characteristics. The potential for applying geodemographic principles to commuting flow-data is considerable particularly since demographic and socioeconomic characteristics are known to influence commuting patterns and behaviours (Green et al. Citation1999, Hincks Citation2012, Lovelace et al. Citation2014). It is recognised that women tend to have shorter and more concentrated trips than men (McQuaid and Chen Citation2012). Green (Citation1997) found that in dual career households, significant care is taken to balance the needs of both workers resulting in a complex trade-off in the length of the commute and in the choice of residential locations. McQuaid (Citation2003) also contends that the relationship between commuting and age might be bimodal. He suggests that younger and older age groups have the lowest propensity to commute over longer distances and time frames. The effect of ethnicity on commuting has long been a point of debate in the UK with evidence as to the effects being mixed. Thomas (Citation1998) found that workers of ethnic minority groups were less willing to commute over 10 miles to work. More recently, McQuaid and Chen (Citation2012) found that ethnicity affected the time spent commuting only for men employed full-time.
The effect of socioeconomic status on commuting more generally has been exacerbated by major structural economic changes over recent decades which are understood to have intensified patterns of cross-commuting between urban centres, suburbs and surrounding hinterlands (Hincks and Wong Citation2010, Hincks Citation2012). In this context, full-time workers have been shown to have longer commutes and a higher propensity to commute than part-time workers (Green et al. Citation1999). As educational achievement and income increases so too does the propensity for workers to commute over longer distances and times (McQuaid Citation2003). This is particularly notable for professional and managerial workers when compared to lower status workers, routine and semi-routine workers (Dargay and Clark Citation2012). Although access to a car is thought to have contributed to an extension of commuting patterns and more diverse commuting behaviour (Lovelace et al. Citation2014), it has also been suggested that longer distance commutes are differentially affected by access to public transport networks (McQuaid and Chen Citation2012).
The research outlined here suggests that commuter trends and behaviours are likely to be influenced by differences in the demographic and socioeconomic characteristics of the commuter. In light of this context, the next section outlines a methodology that was applied to segment commuters into groups based on their demographic and socioeconomic attributes, leading to the development of a new geodemographic classification of commuting flows for England and Wales.
Methodology
The methodology consists of four stages and was developed using conventions that ensure consistency with established geodemographic principles.
Stage 1: data collection and preparation
The classification was developed using origin-destination SWS, collected as part of the 2011 census of England and Wales and released through the UK Data Service (https://wicid.ukdataservice.ac.uk/). The data consisted of 89 variables covering 11 categories of commuters and were released initially at Middle Layer Super Output Area (MSOA) level for England and Wales. In 2011, there were 7201 MSOAs in England and Wales, which form part of a nested geography of census units. At the finest scale are Output Areas. These are nested within Lower Layer Super Output Areas (LSOAs), which in turn are nested within MSOAs. LSOAs and MSOAs have minimum and maximum residential population and household thresholds that help define their geographies ().
Table 1. Population and household thresholds used to define LSOA and MSOA geographies.
The raw origin-destination count data were processed so that all variables were integrated into a single file. The total number of commuters within each MSOA interaction (e.g. E02000001 → E02000119) formed the numerator and each characteristic variable (e.g. male, age 16–24) formed denominators. Any flow of five people or less on the numerator variable was removed from the data set. The reason for this was twofold. First, the effects of small cell adjustment methodology are known to be most acute for interactions with very small numbers (Stillwell and Duke-Williams Citation2007). Second, the sheer number of small cells in the data set with counts between one and five greatly increased the length of the tails of the distributions for many of the candidate variables under consideration. Testing revealed that the distributions of many of the variables were improved – once they had been subjected to normalisation and standardisation – by excluding interactions of five people or less.
This preparation exercise generated a data set of 513,892 commuting interactions. This captured 18.4 million of the 26.5 million workers (70%) that were recorded as part of 2011 census of England and Wales. At this stage, the values of each of the variables were still in count form. The final step of data preparation involved converting each of the commuter characteristic variables from counts to rates.
Stage 2: transformation, standardisation and variable selection
All 89 variables from the 11 categories of commuters were initially identified as potential candidate variables for inclusion in the classification ( and supplementary online material for further details). The Shapiro–Wilk test and measures of skewness and kurtosis were used to test for non-normal distributions. Visual outlier detection was also undertaken at this stage. The initial analysis revealed that all the variables suffered from skewness and/or kurtosisFootnote1 in a way that necessitated the use of transformation and standardisation procedures.
Table 2. Commuter categories and variables.
The 2011 Output Area Classification methodology was the starting point in deciding which transformation and standardisation techniques to use (Gale et al. Citation2016). All of the variables were transformed in stages using Log, Box–Cox and Inverse Hyperbolic Sine to create three new data sets. An additional transformation approach was also tested which involved fractionally ranking each variable (Conover and Iman Citation1981) before an inverse distribution function was calculated. Each of the transformed data sets were then standardised using z-scores, range standardisation and inter-decile range procedures which generated three additional data sets.
Combinations of the four transformation and three standardisation approaches were tested through examination of outliers, skewness and kurtosis values, and pilot clustering runs. These pilot runs were used to examine how different combinations of transformation and standardisation techniques conditioned the cluster outcomes, including whether certain combinations produced small or indistinguishable cluster solutions (Gale et al. Citation2016). This exercise revealed the utility of adopting a transformation procedure in which all variables were fractionally ranked before being subject to an inverse distribution function followed by range standardisation.
For the variables that lay within a normal distribution, Pearson correlation was used to evaluate candidate variables and to minimise data redundancy within the final classification. Although there is no standard rule for determining excessive correlation between candidate variables (Vickers and Rees Citation2007), in this study pairs of variables with correlations of ±0.70 were evaluated. The threshold of ±0.70 is stricter than the ±0.90 suggested by Mooi and Sarstedt (Citation2011) but more lenient than ±0.60 threshold used in the development of the 2011 Output Area Classification (Gale et al. Citation2016). Of the 89 variables that were originally subjected to the transformation and standardisation procedures, 51 candidate variables from across the 10 categories were identified for inclusion in the next stage of analysis. The decision as to which variables should be excluded was taken on a case-by-case basis determined by a combination of measures including outliers, skewness, kurtosis and correlation (Vickers and Rees Citation2007).
Stage 3: k-means clustering to create a two-tier commuting flow classification
k-Means clustering is commonly used in the development of geodemographic systems (Singleton and Longley Citation2009). It is a process for partitioning objects into k centroids that are fixed a priori (MacQueen Citation1967). In this study, objects (flows) are iteratively reassigned to clusters in an attempt to derive a series of centroids that minimise
where V is the sum of squared distances of all variables from cluster means for all clusters, is the standardised variable for flow i, variable x and cluster y,
is the mean for variable x in cluster y, k is the number of clusters, v is the number of variables and
is the number of flows in cluster.
Using IBM SPSS v.22, the 51 candidate variables were included in the pilot runs. One of the limitations of k-means clustering is that case order can affect the outcome of the cluster solution. In an effort to minimise these effects, cluster solutions were rerun using randomly ordered cases (flows). The cluster method was set to ‘iterate and classify’ and different combinations of variables were tested through the systematic inclusion and exclusion of variables. This process was intended to improve the quality of the solutions that were generated. Stability was reached once the iteration of centroids between clusters had ceased.
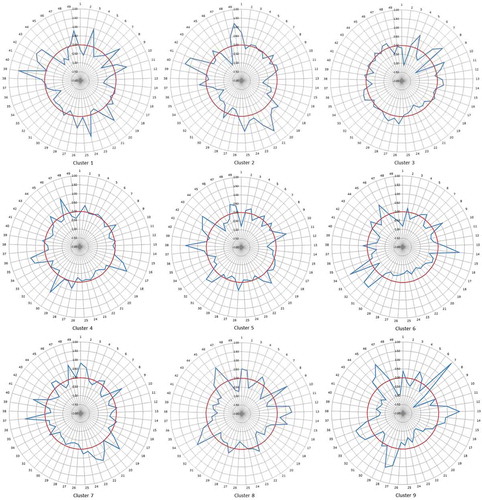
Following Vickers and Rees (Citation2007), sensitivity tests were undertaken on each variable to examine how the removal of variables affected clustering. This was an extended process that involved iterative pilot clustering of variables and an assessment of the effects of variables on cluster distances. ANOVA, cluster membership and the evaluation of cluster solutions were used to assess sensitivity, operationalised using the procedure outlined in Stage 4 (see below). As different combinations of variables were included and excluded, it became clear that two variables – living in a couple family and living in a lone parent family – detracted from the quality of the cluster solutions. These two variables were excluded from the final clustering exercise leaving 49 variables for inclusion in the final cluster runs. These variables covered nine categories of commuter. The variables included in each category are summarised in . Each variable is also given a unique numeric identifier that corresponds to the same variable in the radial plots. The supplementary online material contains details of data sources, variables that were excluded, and comments on the trends and distributions of each variable.
The initial focus of the analysis was on deriving an upper-tier classification of commuting by deriving n clusters that would constitute the Supergroup layer. Once the Supergroup configuration had been defined, this upper-tier data set was subjected to partitioning into clusters which formed a second Group layer (Gale et al. Citation2016). Informed by previous research into UK-based geodemographic classifications, the Supergroup and Group solutions were constrained by an upper-limit of 10 and 5 clusters, respectively.
Stage 4: evaluating cluster solutions
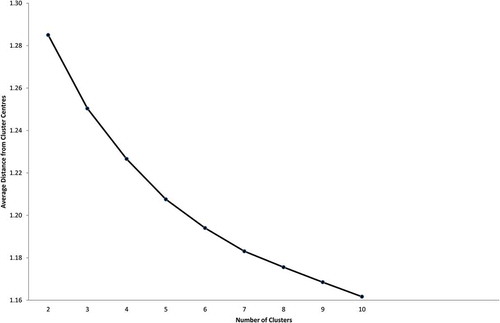
Another limitation of k-means clustering is that there are no set criteria for defining the optimum cluster solution (Brown Citation1991). However, there are procedures that can be used to inform decisions as to which solution is optimal. One approach is the elbow method, which can be used to examine variation in the distances between cluster centres. The smaller the average distance to the cluster centre the more compact the cluster solution. The most compact cluster solutions are those with the steepest increases in within-cluster distance minus the solution that creates one fewer cluster (Vickers and Rees Citation2007). As illustrates, there was no evidence visually of significant change in the gradient of average distance from the cluster centres.
Figure 1. Average distance from cluster centre by number of clusters (Supergroup level).
To identify the elbow, the Variance Ratio Criterion (VRC) was employed. The VRC was introduced by Calinski and Harabasz (Citation1974) as a way of identifying optimum cluster solutions in hierarchical and k-means procedures. For a solution with n objects and k segments, the VRC can be written as
where is the measure of between-segment variation and
is the measure of within-segment variation as determined in relation to all clustering variables. The algorithm involves calculating a ‘cumulative’ F-value for each solution which is then used to identify the number of segments (clusters) that minimise the measure of variance. This can be written as
The aim of this procedure is to identify a value for k which minimises the value of . In applying the VRC approach, it was necessary to identify a maximum number of clusters that were deemed acceptable (10 for the Supergroups and 5 for the Groups). It was also necessary to accept that the minimum number of clusters that could be identified through the approach was three due to the condition
(Calinski and Harabasz Citation1974).
Alongside the use of the VRC, cluster distances were evaluated using diagnostic statistics. Tukey post hoc tests were calculated to determine whether the distances between cluster centroids were statistically significant and warranting their retention as separate clusters. In conjunction, one-way ANOVAs were calculated at each step of the cluster-run. The subsequent F-values were used in the calculation of the VRC and . Where cluster distances were found to be statistically different and
minimised, the cluster solution was deemed to have been optimised. Having identified the optimum number of clusters, a radial graph for each cluster was created (). Here standardised scores were plotted in relation to the grand mean score for England and Wales. Once the optimum Supergroup configuration had been identified, the same approach was applied to the development of the lower-tier Group solution. Finally, the radial graphs were used to profile individual clusters and to develop the nomenclature of commuting flows for Supergroups and Groups.
Figure 2. Supergroup radial graphs.
A geodemographic flow-based classification of commuting for England and Wales
The two-tier classification of commuting took the form of a 9-cluster configuration at the Supergroup level and a 40-cluster configuration at the Group level. The optimum solution for both levels was defined using a combination of two measures. The first was the point at which the was minimised. The second was the performance of each solution using the Tukey HSD post hoc test (). The two-tier configuration and the nomenclature of the Supergroups and Groups are summarised in .
Table 3. Summary of diagnostic statistics for Supergroup solutions.
Table 4. Summary of diagnostic statistics for Group solutions.
The nomenclature was derived to provide a basic signpost to the dominant characteristics underpinning each cluster. Pen portraits were developed for the Supergroups and Groups. The pen portraits along with the underpinning methodology and nomenclature were opened up to scrutiny via three participatory workshops with policymakers and academics held in Manchester and Cardiff during 2016. The consultation exercises were undertaken with the aim of testing different uses of the classification in practice and for potential users to provide feedback on the nomenclature and functionality of the classification (Kingston et al. Citation2000, Vickers and Rees Citation2011).
The final Supergroup and Group classification structure is outlined in . The pen portraits of the nine Supergroups, detailing the dominant variables in each cluster, are summarised belowFootnote2:
Consumer Services: has a higher-than-average distribution of part-time employees in sales and customer service or elementary occupations in semi-routine roles. The main associated industries include wholesale and retail trade and repair of motor vehicles, and accommodation and food services. There are above-average levels of multicultural female workers aged 16–24 and above-average commuting by bus, bike or on foot. There is an above-average level of workers in the lowest social grade category.
Typical Blue Collar Traits: has a higher-than-average distribution of commuters employed full-time in elementary, skilled trades, and process, plant and machine operation occupations in routine or semi-routine, lower technical or lower supervisory roles. The main associated industries include wholesale and retail trade and repair of motor vehicles, transport and storage, manufacturing and construction. There is a slightly higher-than-average propensity to travel to work on foot, by bike or bus and above-average levels of male workers distributed across the range of age and ethnic groups. There is an above-average level of workers in the lowest social grade category.
Sustainable Sorts: has a slightly higher-than-average distribution of commuters in full-time administrative and secretarial, associate professional and technical and professional occupations. Their roles tend to be defined as higher or lower professionals and technical occupations with a slightly higher-than-average distribution of intermediate occupations. The main associated industries include accommodation and food services, finance, professional, scientific and technical human health, and social work. There is a higher-than-average propensity to travel to work by bus, train, bike and on foot and a lower propensity to commute by car. There are slightly higher-than-average levels of female workers in the 16–24 and 25–34 age bands and a significantly higher-than-average multicultural composition. There is an above-average level of workers represented in the upper-middle and highest social grade categories.
Supporting Society: has a higher-than-average distribution of commuters employed full-time in administrative and secretarial and associate professional and technical occupations. Their roles tend to be defined as intermediate and higher supervisory. The main associated industries include public administration, defence, compulsory social security and, to a lesser extent, finance. There is a higher-than-average propensity to travel to work by car. The Supergroup has an above-average level of white commuters, a balanced distribution of males and females, and an even distribution across all age groups. There is an above-average level of workers in the upper-middle social grade category.
Friendly Faces: has a higher-than-average distribution of commuters employed part-time in caring, leisure and other service occupations. Their roles tend to be defined as semi-routine, routine, lower supervisor and intermediate. The main associated industries include human health and social work, education, and accommodation and food services. There is a higher-than-average propensity to travel to work on foot, by bike and bus. The Supergroup has an above-average level of female commuters and above-average levels of white commuters represented across the 16–24 and 50–64 age bands. There is an above-average level of workers in the lower-middle and lowest social grade categories.
Nurturers: has a higher-than-average distribution of commuters employed part-time in professional and some caring, leisure and other service occupations. Their roles tend to be defined as lower professional and higher technical or higher professional. The main associated industries include human health, social work and education. There is a higher-than-average propensity to travel to work by car. The Supergroup has an above-average level of female commuters and slightly above-average level of white commuters represented across the 35–49 and 50–64 age bands. There is an above-average level of workers in the highest social grade category.
Traders, Movers and Makers: has a higher-than-average distribution of commuters employed full-time in process, plant and machine operations, and skilled trade occupations. Their roles tend to be defined as lower technical, lower supervisory or routine with a slightly above-average distribution in lower managerial and administrate roles. The main associated industries include manufacturing, construction, transport and storage, wholesale and retail trade, and repair of motor vehicles. There is a slightly higher-than-average propensity to travel to work by car and an above-average level of white, male workers, in the 35–49 and 50–64 age bands. There is an above-average level of workers in the lower-middle social grade category.
High Flyers: has a higher-than-average distribution of commuters employed full-time in manager, director and senior official, professional and associate professional and technical occupations. Their roles are largely defined as higher-managerial and administrative, higher professional, lower professional, and higher technical and lower managerial and administrative. The main associated industries include manufacturing and professional and scientific and technical. Construction and retail wholesale and retail trade and repair of motor vehicles featuring at levels slightly above or at the national average. There is an above-average propensity to travel to work by car and above-average levels of white and male commuters in the 35–49 and 50–64 age bands. There is an above-average level of workers in the highest social grade category.
Techs and the City Types: has a higher-than-average distribution of commuters employed full-time in manager, director and senior official, professional and associate professional and technical occupations. Their roles are predominately defined as higher-managerial and administrative, higher professional, lower professional and higher technical, and lower managerial and administrative. The main associated industries include professional, scientific and technical, and finance. This Supergroup has an above-average propensity to travel to work by train and above-average levels of male commuters in the 25–34 and 35–49 age bands. There is an above-average level of workers represented in the highest social grade category.
Table 5. Two-tier classification of commuting flows.
What does the geodemographic classification reveal about the structure and patterning of commuting in England and Wales?
This section provides a brief analysis of the structure and patterning of commuting in England and Wales. It draws on a selection of trends in the ninefold Supergroup configuration to illustrate the potential utility of the classification. summarises the structure of the Supergroup classification with regard to the geography of connections and the concentration of the workforce within each cluster. The analysis reveals that three clusters – Friendly Faces; Traders, Movers and Makers; and Supporting Society – have levels of connections that exceeded the national average of 11.1%. Similarly, three clusters recorded a level of workforce concentration that exceeds the national average of 11.1%. Friendly Faces was the top-ranked cluster on this measure accounting for 21.7% of the total workforce. The Consumer Services cluster was ranked second with 20.4% of the total workforce, and Typical Blue Collar Traits were ranked third with a workforce concentration of 11.6%. This is in contrast to High Flyers (4.0%) and Techs and the City types (6.5%), which have the lowest concentrations of workers of any of the Supergroups. By design, the clustering procedure will have conditioned the underlying structure of the interactions. However, the extent of the variation in the distribution of the workforce between the different Supergroups is indicative of the way in which demographic and socioeconomic characteristics shape commuting behaviours and the geography of interactions (Dargay and Clark Citation2012, Hincks Citation2012, McQuaid and Chen Citation2012).
Table 6. Measures of the structure of commuting by Supergroup.
This is illustrated by the variation in the composition of flows based on the origin and destination of commuters. This can be examined from the perspective of the volume of connections ( and ) and the concentration of the workforce within each Supergroup ( and ). In this context, the connections and workforce data have been aggregated to the Standard Regions of England and the national boundary of Wales. In and , Sustainable Sorts is shown to be predominantly a London-centric set of connections at both the residential and workplace-end of the commute. Likewise, there is a notable concentration of Techs and the City Types in London at the residential-end of the commute. However, the concentration of these flows is significantly elevated when considering workplace patterns to the extent that Techs and the City Types outstrips Sustainable Sorts as the dominant feature of commuting into workplaces in London.
Figure 3. Commuting by Supergroup – connections aggregated to Standard Regions and Wales for residential-end of the commute.
Total flows in each Supergroup as percentage of 513,892.
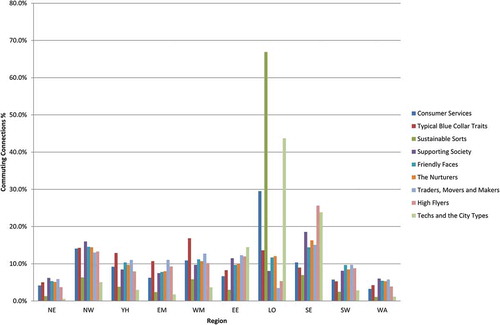
Figure 4. Commuting by Supergroup – connections aggregated to Standard Regions and Wales by workplace-end of the commute.
Total flows in each Supergroup as percentage of 513,892.
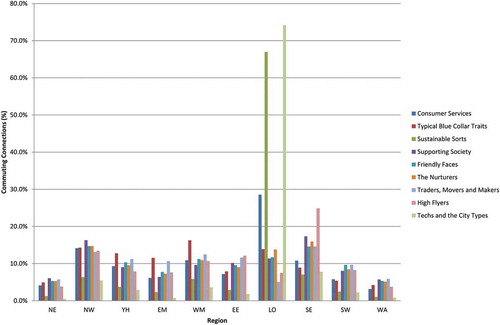
Figure 5. Commuting by Supergroup – workforce aggregated to Standard Regions and Wales by residential-end of the commute.
Total workers in each Supergroup as percentage of 18,401,833.

Figure 6. Commuting by Supergroup – workforce aggregated to Standard Regions and Wales by workplace-end of the commute.
Total workers in each Supergroup as percentage of 18,401,833.
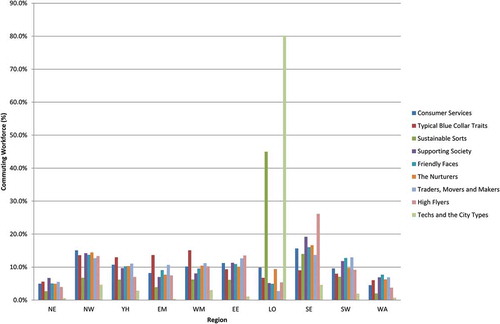
Much of this inflation is seemingly a result of cross-commuting between London, the South-East and the East of England. Other patterns are equally apparent: the concentration of Typical Blue Collar Traits in the West Midlands and the concentration of High Flyers in South East England are notable. However, it is also apparent that much of the commuting across the regions outside of London and the South East leads to marginal changes in the commuting profile between the residential and workplace-ends of the commute. The concentration of the workforce within different Supergroups reveals a similar storyline to the analysis of connections ( and ). Perhaps the most significant difference in this regard is that the concentration of workers in the Techs and the City Types cluster in London outstrips that of Sustainable Sorts at both the residential and workplace-end of the commute and therefore provides an alternative understanding of commuting when compared to an analysis that only focuses on the volume of connections.
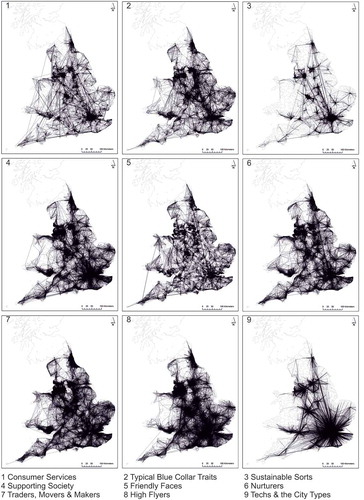
The geography of inter-zonal interactions for each of the nine Supergroups highlights the extent of the variegation in the patterning of commuting in England and Wales ().Footnote3 The Sustainable Sorts cluster, for instance, has a patterning of commuting that is predominantly concentrated within and around core urban areas. This reflects the dominance of the likes of cycling and walking as modes of transport which constrain the distances that people can travel on a daily basis (Hincks Citation2012, Rae Citation2016). The Traders, Movers and Makers cluster exhibits, in contrast, greater spatial dispersion than that of Sustainable Sorts. For this cluster, commuting extends along key motorway networks and is prevalent in areas that are traditional industrial heartlands. These include East London, South Wales, North East England, the urban centres of the West Midlands and the M62 corridor in North West England. At the other extreme, the Techs and the City Types cluster exhibits a largely London-centric pattern of commuting with flows extending far beyond the Greater London metropolitan region. To a more limited extent, this cluster also features in areas outside of London, concentrated notably on the core urban areas where employment in finance and technology is a feature of the local economy. These include the likes of Birmingham, Bristol, Manchester and Leeds.
Figure 7. The geography of inter-zonal interactions for Supergroups.
The final component of our analysis considered the relationship between commuting distance and the composition of the Supergroups ().
Table 7. Measures of commuting distance by Supergroup composition.
Conclusion
This paper applies a geodemographic approach to the development of a new and novel flow-based classification of commuting for England and Wales. The classification was derived using origin-destination SWS collected as part of the 2011 census of England and Wales. Initially, 51 candidate variables were subjected to transformation procedures, each of which was tested previously in UK-based geodemographic research: Log, Box–Cox and Inverse Hyperbolic Sine (Cockings et al. Citation2015, Gale et al. Citation2016). An additional transformation approach was also tested which involved fractionally ranking each variable (Conover and Iman Citation1981) before an inverse distribution function was calculated. Each of the transformed data sets were then standardised using z-scores, range standardisation and inter-decile range procedures which generated three additional data sets. It was found that fractionally ranking each variable before subjecting them to an inverse distribution function followed by the use of range standardisation was an effective combination of transformation and standardisation for interaction variables that were non-normally distributed. Following testing, 49 variables were retained and subjected to k-means clustering. This produced an upper-tier classification of nine Supergroups. These Supergroups were subsequently partitioned to derive a lower-tier classification of 40 Groups. The classification was tested at three workshops with policymakers and academics held in Manchester and Cardiff during 2016 after which the preliminary nomenclature was refined in light of feedback from participants. The final classification incorporates 513,892 interactions capturing 18.4 million of the 26.5 million workers (70%) recorded as part of 2011 census of England and Wales.
The 2011 SWS are made available to users in the form of origin-destination matrices or pairwise listings of locations for individual or simple cross-tabulated (e.g. sex and age) attributes (Stillwell and Duke-Williams Citation2003). An important contribution of our research is in demonstrating a novel approach that simplifies these complex commuting flows by partitioning commuters based on shared similarities across multiple demographic and socioeconomic attributes.Footnote4 The brief analysis undertaken in this paper demonstrates the potential for the classification to be used to describe and analyse patterns and structures of commuting differentiated by types of commuter. This analysis could be extended by aligning the classification to area taxonomies in a modelling framework that integrates local spatial context and commuting behaviour (Longley Citation2012, Singleton et al. Citation2012). This could enable the identification of different places and groups of commuters that could conceivably benefit from the targeting of discrete mobility-related interventions (Ponti et al. Citation2013, Lovelace et al. Citation2014).
In the future, there are possibilities to extend the classification to include international commuting using the SWS or real-time data (Longley and Adnan Citation2016). As stated in the ‘Introduction’ section, we focused on developing a classification of commuting flows that might be used within policy-related research to inform transport investment decision-making and policy evaluation. Our classification excludes homeworking because, in our view, the unique nature of homeworking – as a part or whole day activity – and the demands it places on alternative forms on infrastructure necessitates discrete analytical attention (Haddad et al. Citation2009). A separate classification of homework ‘commuting’ would be a logical development as a complement to the classification outlined here. In addition, when this research was undertaken, cross-border flow-data between England/Wales and Scotland/Northern Ireland were not available but this data has since been released through the UK Data Service. Further research could extend the focus to derive a UK-wide classification drawing on the principles outlined in this paper. Likewise, the approach developed here would be equally transferable to other countries and contexts where origin-destination data are disaggregated by commuter characteristics.
Supplementary_Materials.zip
Download Zip (7.8 MB)Acknowledgements
The authors would like to thank the Economic and Social Research Council for funding the research on which this paper draws. The commuting flow-data were accessed through the UK Data Service WICID portal through the Open Government License for Public Sector Information. They also thank Andreas Schultz-Baing, Vasilios Vlastaras, Moozhan Shakeri and Anna Gilchrist for their inputs at various points in the research; and Peter Brown for his comments on an earlier draft of this paper. Finally, they thank the two anonymous referees and the Editor for their constructive comments which have improved significantly the quality of the paper. This work was supported by the ESRC grant number [ES/L014459/1]
Disclosure statement
No potential conflict of interest was reported by the authors.
Supplemental data
Supplemental data for this article can be accessed here.
Additional information
Funding
Notes
1. Skewness and kurtosis were judged to be excessive when values on either measure exceeded 1.
2. High resolution radial graphs and flow maps are available as supplementary online material. Detailed descriptions of the Supergroups and Groups and interactive flow maps are also available at www.commute-flow.net.
3. The full set of commute flow maps is available at www.commute-flow.net or via the supplementary online material.
4. Different combinations of Supergroups or Groups can be visualised and extracted through Commuteflow, an accessible online system supporting the dissemination of the classification (http://www.commute-flow.net/).
Related Research Data
References
- Brown, P.J.B., 1991. Exploring geodemographics. In: I. Masser and M. Blakemore, eds. Geographic information management: methodology and applications. London: Longman, 221–258.
- Calinski, T. and Harabasz, J., 1974. A dendrite method for cluster analysis. Communications in Statistics, 3 (1), 1–27.
- Cockings, S., Martin, D., and Harfoot, A., 2015. Creating a classification of workplace zones (COWZ). In: Presentation at the UKDS census conference, July Manchester. Available from: https://www.ukdataservice.ac.uk/media/455470/cockings.pdf [Accessed 21 February 2016].
- Conover, W.J. and Iman, R.L., 1981. Rank transformations as a bridge between parametric and nonparametric statistics. The American Statistician, 35 (3), 124–129.
- Dargay, J.M. and Clark, S., 2012. The determinants of long distance travel in Great Britain. Transportation Research Part A, 46, 576–587.
- Debenham, J., Clarke, G., and Stillwell, J., 2003. Extending geodemographic classification: a new regional prototype. Environment and Planning A, 35, 1025–1050. doi:10.1068/a35178
- Gale, C.G., et al., 2016. Creating the 2011 area classification for output areas (2011 OAC). Journal of Spatial Information Science, 12, 1–27.
- Green, A.E., 1997. A question of compromise? Case study evidence on the location and mobility strategies of dual career households. Regional Studies, 31, 641–657. doi:10.1080/00343409750130731
- Green, A.E., Hogarth, T., and Shackleton, R.E., 1999. Longer distance commuting as a substitute for migration in Britain: a review of trends issues and implications. International Journal of Population Geography, 5, 49–67. doi:10.1002/(ISSN)1099-1220
- Haddad, H., Lyons, G., and Chatterjee, K., 2009. An examination of determinants influencing the desire for and frequency of part-day and whole-day homeworking. Journal of Transport Geography, 17 (2), 124–133. doi:10.1016/j.jtrangeo.2008.11.008
- Hincks, S., 2012. Daily interaction of housing and labour markets in North West England. Regional Studies, 46 (1), 83–104. doi:10.1080/00343404.2010.486782
- Hincks, S. and Wong, C., 2010. The spatial interaction of housing and labour markets: commuting flow analysis of North West England. Urban Studies, 47 (3), 620–649. doi:10.1177/0042098009349777
- Kingston, R., et al., 2000. Web-based public participation geographical information systems: an aid to local environmental decision-making. Computers, Environment and Urban Systems, 24 (2), 109–125. doi:10.1016/S0198-9715(99)00049-6
- LeSage, J.P. and Pace, R.K., 2008. Spatial econometric modelling of origin-destination flows. Journal of Regional Science, 48 (5), 941–967. doi:10.1111/j.1467-9787.2008.00573.x
- LeSage, J.P. and Thomas-Agnan, C., 2015. Interpreting spatial econometric origin-destination flow models. Journal of Regional Science, 55 (2), 188–208. doi:10.1111/jors.2015.55.issue-2
- Longley, P., 2005. Geographical information systems: a renaissance of geodemographics for public service delivery. Progress in Human Geography, 29 (1), 57–63. doi:10.1191/0309132505ph528pr
- Longley, P.A., 2012. Geodemographics and the practices of geographic information science. International Journal of Geographical Information Science, 26 (12), 2227–2237. doi:10.1080/13658816.2012.719623
- Longley, P.A. and Adnan, M., 2016. Geo-temporal Twitter demographics. International Journal of Geographical Information Science, 30 (2), 369–389. doi:10.1080/13658816.2015.1089441
- Lovelace, R., Ballas, D., and Watson, M., 2014. A spatial microsimulation approach for the analysis of commuter patterns: from individual to regional levels. Journal of Transport Geography, 34, 282–296. doi:10.1016/j.jtrangeo.2013.07.008
- MacQueen, J.B., 1967. Some methods for classification and analysis of multivariate observations. Proceedings of the 5th Berkeley Symposium on Mathematical Statistics and Probability, 1, 281–297.
- Martin, D., Cockings, S., and Harfoot, A., 2013. Development of a geographical framework for census workplace data. Journal of the Royal Statistical Society: Series A (Statistics in Society), 176, 585–602. doi:10.1111/rssa.2013.176.issue-2
- Masucci, A.P., et al., 2013. Gravity versus radiation models: on the importance of scale and heterogeneity in commuting flows. Physical Review E, 88 (2), 022812. doi:10.1103/PhysRevE.88.022812
- McQuaid, R.W. and Chen, T., 2012. Commuting times – the role of gender, children and part-time work. Research in Transportation Economics, 34, 66–73. doi:10.1016/j.retrec.2011.12.001
- McQuaid, R.W., 2003. The changing nature of work and transport. In: J. Hine and J. Preston, eds. Integrated futures and transport choices. Aldershot: Ashgate Publishing, 55–67.
- Mooi, E. and Sarstedt, M., 2011. A concise guide to market research. Berlin Heidelberg: Springer.
- Office for National Statistics (ONS), 2012. Changes to output areas and super output areas in England and Wales, 2001 to 2011. London: ONS.
- Ponti, M., Boitani, A., and Ramella, F., 2013. The European transport policy: its main issues. Case Studies on Transport Policy, 1, 53–62. doi:10.1016/j.cstp.2013.07.002
- Rae, A., 2016. The geography of travel to work in England and Wales: extracts from the 2011 census. Applied Spatial Analysis and Policy, 10, 1–17.
- Singleton, A.D. and Longley, P.A., 2009. Geodemographics, visualisation and social networks in applied geography. Applied Geography, 29, 289–298. doi:10.1016/j.apgeog.2008.10.006
- Singleton, A.D. and Spielman, S.E., 2014. The past, present and future of geodemographic research in the United States and United Kingdom. The Professional Geographer, 66 (4), 558–567. doi:10.1080/00330124.2013.848764
- Singleton, A.D., Wilson, A.G., and O’Brien, O., 2012. Geodemographics and spatial interaction: an integrated model for higher education. Journal of Geographical Systems, 14, 223–241. doi:10.1007/s10109-010-0141-5
- Sohn, J., 2005. Are commuting patterns a good indicator of urban spatial structure? Journal of Transport Geography, 13, 306–317. doi:10.1016/j.jtrangeo.2004.07.005
- Stillwell, J. and Duke-Williams, O., 2007. Understanding the 2001 UK census migration and commuting data: the effect of small cell adjustment and problems of comparison with 1991. Journal of the Royal Statistical Society: Series A (Statistics in Society), 170, 425–445. doi:10.1111/rssa.2007.170.issue-2
- Stillwell, J.C.H, and Duke-Williams, O.W., 2003. A new web-based interface to british census of population origin-destination statistics. Environment and Planning A, 35, 113–132. doi:10.1068/a35155
- Thomas, J.M., 1998. Ethnic variation in commuting propensity and unemployment spells: some UK evidence. Journal of Urban Economics, 43, 385–400. doi:10.1006/juec.1997.2050
- Van der Laan, L., Vogelzang, J., and Schalke, R., 1998. Commuting in multi-nodal urban systems: an empirical comparison of three alternative models. Tijdschrift Voor Economische En Sociale Geografie, 89, 384–400. doi:10.1111/1467-9663.00037
- Vickers, D. and Rees, P., 2007. Creating the UK National Statistics 2001 output area classification. Journal of the Royal Statistical Society: Series A (Statistics in Society), 170, 379–403. doi:10.1111/rssa.2007.170.issue-2
- Vickers, D. and Rees, P., 2011. Ground-truthing geodemographics. Applied Spatial Analysis and Policy, 4 (1), 3–21. doi:10.1007/s12061-009-9037-5