
 ?Mathematical formulae have been encoded as MathML and are displayed in this HTML version using MathJax in order to improve their display. Uncheck the box to turn MathJax off. This feature requires Javascript. Click on a formula to zoom.
ABSTRACT
Earth observation images are a powerful source of data about changes in our planet. Given the magnitude of global environmental changes taking place, it is important that Earth Science researchers have access to spatiotemporal reasoning tools. One area of particular interest is land-use change. Using data obtained from images, researchers would like to express abstractions such as ‘land abandonment’, ‘forest regrowth’, and ‘agricultural intensification’. These abstractions are specific types of land-use trajectories, defined as multi-year paths from one land cover into another. Given this need, this paper introduces a spatiotemporal calculus for reasoning about land-use trajectories. Using Allen’s interval logic as a basis, we introduce new predicates that express cases of recurrence, conversion and evolution in land-use change. The proposed predicates are sufficient and necessary to express different kinds of land-use trajectories. Users can build expressions that describe how humans modify Earth’s terrestrial surface. In this way, scientists can better understand the environmental and economic effects of land-use change.
1. Introduction
Humanity is changing rural and urban landscapes at an unprecedented pace. Our growing demand for natural resources has caused major environmental impacts. From 1980 to 2000, 55% of the new agricultural land in the tropics came from intact forests, and another 28% came from disturbed forests (Gibbs et al. Citation2010). To better understand and assess these changes, researchers use geospatial data, building land-use change models and running spatial analysis methods. GIScience theories and tools provide important support for working with these data sets.
The main sources of data on land-use change are remote sensing satellites. Their sensors observe the same places many times, producing a continuous stream of data. Recently, public space agencies opened their archives, providing access to large Earth observation data sets. To use these data sets, researchers are building new data analysis methods (Câmara et al. Citation2016).
When applied to land classification, these methods allow increased discrimination between land cover classes. Using these maps, land-use change researchers would like to express abstractions such as ‘land abandonment’, ‘forest regrowth’, and ‘agricultural intensification’. These abstractions are specific types of land-use trajectories, defined as multi-year paths from one land cover into another (Geist et al. Citation2006, Verburg et al. Citation2010). The aim of the land-use calculus proposed in this paper is to formally express the abstractions associated with land-use trajectories.
Land-use trajectories are derived from multi-year land transitions. For example, when studying the impact of agriculture in deforestation, it is not enough to identify direct transitions from forest to cropland. One should also examine transitions from forest into pasture, and then from pasture to cropland. These multi-year land changes can, in principle, be expressed as a set of higher-order transition matrices. However, as the number of classes and time instances increase, extracting information from transition matrices becomes difficult. As an alternative, this paper presents a spatiotemporal calculus that expresses both short-term and long-term land-use changes.
The input to our calculus is a set of classified images of different dates. Since remote sensing data use raster data structures, each spatial location is associated with an individual pixel. The expressions in the land-use calculus describe how the land cover class of each pixel changes. Researchers can use the proposed formalism to model and capture multi-year changes and to reason about land-use trajectories.
Although there is a large GIScience literature on analysis of raster data structures, we consider that existing methods are not ideally fit to work with land-use trajectories. Most of the current raster analysis methods are derived from Map Algebra (Tomlin Citation1990). Further work has extended Map Algebra to spatiotemporal data (Frank Citation2005, Mennis et al. Citation2005, Mennis Citation2010). Multidimensional Map Algebra (MMA) (Mennis Citation2010) extends Map Algebra to space–time problems with ‘cubes’ replacing ‘maps’. It allows users to express local, focal and global operations on voxels, referred to as space–time cubes. This approach allows considerable flexibility on defining space–time operations. However, Map Algebra operations have limited semantic content, since time and space are dealt with as equal data dimensions. Without distinguishing space from time, reasoning about change is still possible but becomes complex to express. Explicit temporal concepts such as Allen’s predicates (Allen Citation1984), which are not present in Map Algebra and MMA, enable better structured queries. Although it would be possible to reproduce the land-use calculus proposed in this paper using tools such as Multidimensional Map Algebra, it would not be as straightforward. Expressions describing land-use transitions are arguably simpler to write and to understand using a logical formalism, as proposed in this paper.
This paper is organised as follows. Section 2 presents our conceptual vision. Section 3 presents our spatiotemporal calculus for reasoning about land-use change. Section 4 presents a case study in the Brazilian Amazonia as a proof of concept of our proposal. Section 5 presents implementation considerations. Finally, Section 6 concludes the paper.
2. Conceptual vision
Our conceptual vision to express the notion of ‘land-use trajectory’ draws partly on the GIScience research on ontologies (Hornsby and Egenhofer Citation2000, Yuan Citation2001, Bennett et al. Citation2002, Galton Citation2004, Grenon and Smith Citation2004, Worboys Citation2005, Kuhn Citation2012). These papers focus on the notions of ‘objects’, ‘events’ and ‘processes’. The nature of Earth observation data makes it hard for researchers to directly explore these concepts. Ideally, we would like to reason about changes in the surface of the Earth as ‘events’ that, put together, could be composed into a ‘process’. For example, it is usual to talk about ‘the process of deforestation’ as being composed of a set of events of forest cuts. However, it is unlikely that information about the actual moment when each event happened is available. Satellite data collection takes place at regular intervals, and it is rare that we can witness the actual event of change. The more common situation is to infer change by comparing different moments in time. Therefore, when choosing a conceptual basis for the propose, we model our concepts in a specific ontology that best matches the problem we face.
The approach presented in the paper tracks land-use evolution at the primitive pixel level and then uses logical operators to reason about land change. An alternative approach would be to perform a prior vectorisation of raster maps to generate some primitive regions (Mendonça-Santos and Claramunt Citation2001). In principle, converting pixels into vector regions would generate a data representation that is more suited for object-based change approaches. In practice, this data conversion would entail considerable additional work for object matching in different years. Land-use change is a dynamic process, and there is no guarantee of spatial coherence of objects in different years. For this reason, we chose a pixel-based approach rather than an object-based approach.
The perspective on geospatial modelling directly relevant to our work is the EXP/HIST ontology proposed by Galton (Citation2008), sketched in . The EXP (or experiential perspective) relates to the world as we experience it, which is constantly changing. The EXP entities represent the world as sequence of snapshots, which fits well with the data obtained by satellite observations. In our case, the main elements of the EXP ontology are classified images (‘snapshots’ of the world) and the individual pixels that represent the spatial partitions of world. For simplicity’s sake, we assume that the snapshots (classified images) cover the exact same regions and that snapshots are partitioned regularly in time. In this case, we can refer to each individual pixel as a spatial object and will be able to retrieve its properties in all snapshots. Our work also builds on models for capturing temporal change in raster data, such as ESTDM (Peuquet and Duan Citation1995) and Claramunt & Th´eriault (Claramunt and Thériault Citation1996).
Figure 1. Diagram of the EXP world as a sequence of snapshots, the whole sequence being generated by HIST world. Adapted from Galton (Citation2008).
To reason about change, the EXP ontology is not enough, since it only allows comparison between two different states of the world. For proper temporal reasoning, we need to identify objects in the world, and describe how they change. To this end, we need the HIST ontology. The HIST ontology (or historical perspective) relates to the historical record. It describes synoptic overviews that span a succession of EXP snapshots Galton:2008. The notion of ‘land-use trajectory’ is part of the HIST ontology. Concepts such as ‘land abandonment’, ‘deforestation’, ‘forest degradation’, and ‘agricultural intensification’ are specialisations of ‘land-use trajectory’. Each particular type of trajectory is a set of transitions from a initial state to a final one, possibly restricted to match some intermediate changes. Given a series of land cover maps (EXP entities), we get land-use trajectories (HIST entities) by building spatiotemporal queries. These queries are expressed as combinations of map values that satisfy the specific definition of a trajectory type.
Consider, as an example, the concept of ‘land abandonment’. To express this concepts as part of the HIST ontology, one has to consider cases where areas formerly used for crop production or cattle raising have ceased to be productive activities. However, an interruption of production during a single year is not enough to identify a situation of abandonment. This lack of productive activity needs to persist over many years. To single out a concept such as ‘land abandonment’, we need complex expressions that capture the possible situations associated with the concept.
To use the EXP/HIST ontology in practice, we take multiple satellite observations of an area, which are mapped into 3D arrays in space–time. A satellite image time series is obtained by taking measurements in the same pixel location in consecutive times
()). Classification methods break each image time series into a sequence of land cover values. We can then express specific land-use trajectories as those sequences of land cover values for each pixel that satisfy certain logical constraints. As an example, ) shows a sequence of land cover values for one pixel, extracted from a remote sensing time series, expressed in terms of the their intervals. From 2000 to 2001 the area was a forest that was deforested in 2002. From 2003 to 2005 the area it was used for pasture and from 2005 to 2008, it was transformed into cropland. This sequence of land cover values meets the constraints of a ‘forest-to-cropland’ land trajectory.
Figure 2. A. three-dimensional array of satellite data and events describing change at a particular location. Adapted from Maus et al. (Citation2016).
3. The land-use change calculus
This section describes our proposal for a calculus for reasoning about land-use trajectories. Our motivation is the large set of remote sensing satellites which currently provide consistent information about Earth’s land masses. These satellites observe the same area many times, producing a continuous stream of remote sensing data. Researchers would like to ask questions such as: Which forest areas suffer none degradation, over 2000 to 2017? What productive areas were abandoned and led to forest regrowth? Which period the agricultural practice called double cropping turned dominant in region?. The challenge we address is providing a formal support for expressing those queries in a straightforward way.
We propose a calculus for land-use trajectories, called LUC Calculus for short. Since land-use change transformations are not instantaneous, the calculus uses intervals as its primitive time units. Our choice follows the research tradition of associating land changes to intervals, as in ‘this year the pasture was replaced by soybeans’. These considerations led us to adopt Allen’s interval temporal logic as a basic component of our formalism (Allen Citation1984). We have extended Allen’s proposal with new predicates as part of a more general framework for reasoning about land-use change.
The main contribution of the LUC Calculus is the introduction of three predicates to describe land-use trajectories. Our work considers typical land-use changes that occur on a 10 to 50 year period, where we have continuous data on a regular basis. Our predicates cover three typical combinations: conversion (CONVERT), recurrence (RECUR), and evolution (EVOLVE). Conversion happens when one land-use is directly converted to another. This allows scientists to study direct changes, such as from forest to cropland or forest to pasture. Recurrence happens when the land cover of location is the same as an interval in the past, after a period when it has changed. For example, an area of mature forest may be cut for agriculture and later abandoned. Left to itself, the forest will regrow. In this case, the land class ‘forest’ is associated with two distinct, non-consecutive intervals, denoting a case of recurrence of forest cover. Evolution happens when a conversion from land-use A to B happens interspersed by other use. For instance, scientists want to know the areas that are currently used for agriculture, but that sometime in the past were forest and later were used as pasture
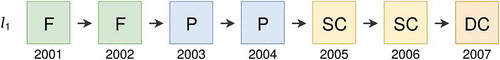
As an example of land-use change trajectories, shows one sequence of land-use classes for yearly intervals from 2001 to 2007. The letters stand for the land-use classes Forest (F), Pasture (P), Single Cropping (SC) and Double Cropping (DC). Single cropping and double cropping are crop production systems (Arvor et al. Citation2011). In the trajectory, location was a forest from 2001 to 2002, pasture from 2003 to 2004, single cropping agriculture from 2005 to 2006, only one crop is planted during the agricultural year, and double cropping agriculture in 2007. Double cropping systems feature two crops (typically maize and soybean) are cultivated in one agricultural year (first and second harvest).
Figure 3. Example of land-use trajectory.
The LUC Calculus is based on the following building blocks:
a non-overlapping set of spatial locations (
), where each location is a pixel in a study region.
a set of land-use and land cover classes (
a set of non-overlapping and sequential time intervals (
the set of temporal predicates defined by Allen (Citation1983), as shown in , where
Table 1. The interval comparison predicates.
the usual logical connectives, such as
the additional predicate
the predicate
the predicates
We use the predicate as originally proposed by Allen (Citation1984) to express the case where one interval is inside another interval. The LUC Calculus uses a spatial version of the Allen’s predicate
, expressed as
, to include the spatial location in the assertion. This predicate denotes a class
of a location
that is true over an entire time interval
. The statement ‘Maggie’s farm was used for soybean crops from 2000 to 2010’ would be expressed as
. From this definition, it follows that the current state of the farm holds in all of its subintervals. It also follows that two sequential subintervals with the same property can be combined. describes the properties of the
and
predicates.
Table 2. The predicates IN and HOLDS.
To reason about land-use trajectories, we use the predicates RECUR, CONVERT and EVOLVE, defined in In , we show three questions in natural language and how they are expressed in the LUC Calculus. In the first case, we want to know all locations where there has been a recurrence of forest cover. The second example will provide information on all places where forest has been directly converted to pasture. In the last example, we consider all transitions that led to the forest being replaced by double cropping, after some years of having a third type of land cover. These examples show the expressive power of the combined predicates.
Table 3. The predicates RECUR, CONVERT and EVOLVE.
Table 4. Examples of LUC Calculus with multiple transitions.
One relevant issue concerns the generality of the ,
,
and
predicates. Are these predicates general enough to represent different types of land-use trajectories? To address this question, consider that users are interested in short-term and long-term transitions. Describing short-term transitions requires comparing the class labels assigned to the pixel in two consecutive intervals. Long-term transitions involve comparing two labels in non-consecutive intervals. At any given interval
, each pixel will be assigned to one class
. Its is also known what are the classes associated with the pixel in all intervals
. For reasoning about short-term transitions (one interval to the next), either the class of the pixel remains the same or it changes. The
predicate covers the first case, and
the latter. Thus,
and
are sufficient for describing short-term transitions.
A second case is when users want to express long-term trajectories, and would like to express queries over non-adjacent intervals. Typically, one compares the class of a pixel in a date to its class at previous dates. In this case, there are four options:
The current class is the same as that of all previous intervals.
The current class is the same as that of a previous date, but there have been other classes assigned to the pixel in intermediate intervals.
The current class is different from that of a previous date, but there are no intermediate intervals with a different class.
The current class is different from that of the previous date, and there are intermediate intervals with a different class.
The predicate covers the first case, the
predicate covers the second, the
predicate covers the third, and
covers the last case. We can thus conclude that, in the case where each pixel is associated with a single class at each interval, the
,
,
and
are sufficient to cover all possible queries about land-use trajectories.
Given the formal definitions above, we can now better explain the main differences of the LUC Calculus from standard remote sensing analysis. LUC Calculus is based on an explicit separation of time and space and the capacity of making queries that span multiple years. Consider the use of standard raster analysis to express a condition such as ‘forest regrowth’ in a 20 year data set. Forest regrowth is a condition where the land-use cover ‘forest’ reappears after a period of at least one year where the land cover class is different. Without the LUC Calculus predicates, a standard raster analysis operation would have to consider all possible combinations of multi-year intervals (periods 1 and 3, periods 1 and 4, and so on). This would amount to 168 different cases to be considered. By contrast, this condition is expressed as a single LUC Calculus query.
4. Case study: detecting land-use change events in Amazonia
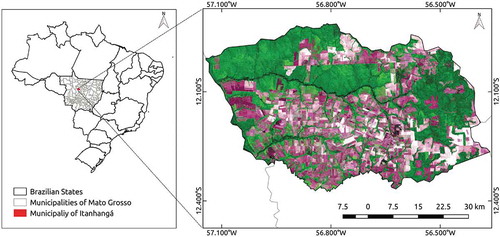
In this section, we present a case study using LUC Calculus for reasoning about land-use trajectories. Our study area is the Itanhangá municipality, located in the Mato Grosso (MT) state, Brazil (), during the period of 2001 to 2016. It has an area of 2,898 km and had a population of 5,276 inhabitants in 2010 IBGE:Citation2016. It is part of the Brazilian Amazonia biome that is covered by rainforest and has the richest biodiversity in the world. In recent years, the area has been subject to an extensive land-use change. Large forested areas have been cut and replaced by pasture areas and crops such as soybean and maize. In this study case, we intend to understand the intensity of different land-use trajectories. We have implemented the LUC Calculus it in R programming language R:2015 and used this implementation in the case study.
Figure 4. The study area: Itanhangá, Mato Grosso state, Brazil. Image from Landsat 8.
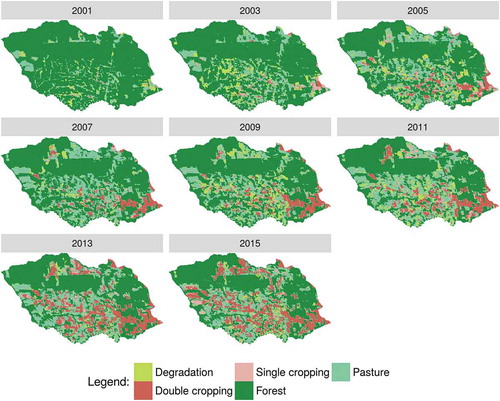
We classified a set of 16-year time series with 392 images of the MOD13Q1 product from the Moderate Resolution Imaging Spectroradiometer (MODIS) sensor for the area from 2001 to 2016 (Didan Citation2015). The MODIS sensor has a revisit cycle of 16 days and produces images with a spatial resolution of 250 m, resulting in 54,698 image time series for our study area. These time series were classified using the TWDTW method (Maus et al. Citation2016) to generate a set of events associated with the classes Forest, Pasture, Degraded Forest (Degradation), Single Cropping and Double Cropping. shows the classification results for each year from 2001 to 2016 (every two years since 2001). These results show a massive removal of the mature forest to be used for agriculture. Almost 1,500 km of mature forest, more than half of the municipality area, has been cut since the early 2000s. Given such a big change, the LUC calculus has been used to express land-use transitions that are associated with the process of deforestation.
Figure 5. Land-use in ItanhangáMT, Brazil, from 2001 to 2016.
4.1. Identifying cases of forest recurrence and land-use evolution
One of the potential uses of the LUC Calculus is to distinguish secondary vegetation from mature forest. Mature forests have high biomass and biodiversity and have not been affected by recent human actions. Secondary vegetation areas are places where the original forest was cut and the area was later abandoned or fallow land-use periods. After a few years, these areas will appear in remote sensing images as forests. However, their biodiversity and biomass is much smaller than that of a mature forest. Thus, it is important to identify areas of secondary vegetation, even though they appear to be mature forest. The LUC Calculus allows to express this reasoning in a simple and precise way.
To single out secondary vegetation, we use the entire history of the area considered as a set of land-use change trajectories. For example, an area which was forest from 2001 to 2005, then converted to pasture from 2006 to 2010, later abandoned and where forest regrew between 2010 and 2016, will be recognised as secondary vegetation from 2010 to 2016. For reasoning about this, we apply RECUR predicate to identify forest state that recur its natural cover and adopt the reference date 2001. shows the logical expression used to uncover areas of secondary vegetation.
However, the application of the RECUR predicate is not able to single out secondary vegetation completely. Some forest areas may have been removed before our starting data (in this case study, the year 2001). Thus, we have to consider agricultural areas in 2001 that have been abandoned and now are identified as forests. To detect these areas, we use the EVOLVE predicate. shows the logical expression used to uncover areas of secondary vegetation, that were used for agriculture in our reference year.
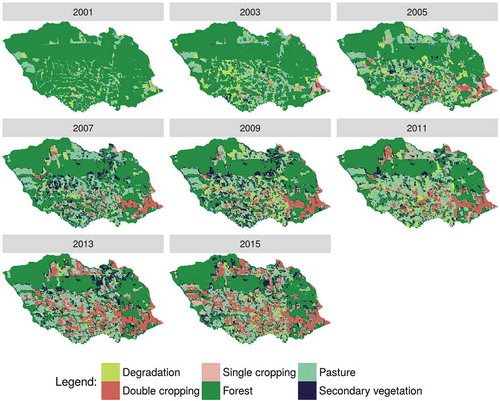
presents the total area of secondary vegetation since 2002, resulting both from forest recurrence (expressed in ) in and land-use evolution (expressed in ). Results show that a significant portion of the deforested area was abandoned and has regrown as secondary forest. The result enables us to include a new class called ‘secondary vegetation’ in our classification results from 2001 to 2016 (). This result points out to the predatory nature of deforestation in Amazon biome. Farmers sometimes cut mature forest and cannot sustain a profitable economic activity in these areas. Using the expressive power of the LUC Calculus, these transitions can be highlighted and better understood.
Table 5. LUC Calculus expression using the RECUR predicate.
Table 6. LUC Calculus expression using EVOLVE predicate.
Figure 6. Total area of forest recurrence and land-use evolution in Itanhangá from 2002 to 2016.
Figure 7. Land-use in Itanhangá, MT, Brazil, from 2001 to 2016, reclassified.
4.2. Understanding short-term land-use transitions in Itanhangá
Besides quantifying specific types of land-use change, it is also important to understand the influences of land-use change on different environment aspects such as climate variability, water resources and food production (Zhao et al. Citation2016). We can obtain this information from the sequence of land-use transitions. For example, we might be interested in discover transitions from one land cover to another from one year to the next. These transitions are called ‘direct transitions’’. In this case study, we selected the following direct transitions:
forest to pasture;
forest to degradation;
forest to single cropping;
forest to double cropping;
pasture to single cropping;
pasture to double cropping;
pasture to secondary vegetation;
single cropping to double cropping;
secondary vegetation to single cropping;
secondary vegetation to double cropping;
secondary vegetation to pasture.
To deal with these direct transitions, we use the CONVERT predicate. shows a part of the LUC Calculus expression used to highlight the direct land-use transitions listed above.
Table 7. LUC Calculus expression using CONVERT predicate to select land-use sequential transitions in Itanhangá, from 2001 to 2016.
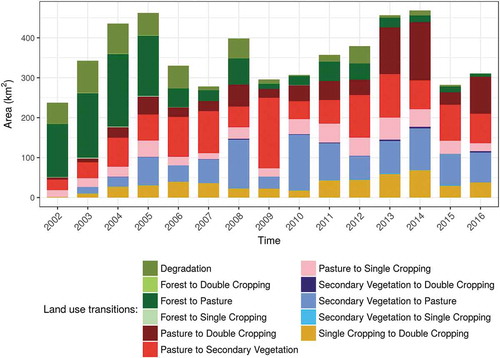
We show all the transitions in a single chart in . We can see that in initial years of the study period forest areas were converted in pasture. From 2008 to 2013, secondary vegetation areas were converted in pasture, and from 2013 onwards pasture areas were converted to double cropping. From 2008 onward, there is a decrease in forest areas being converted to pasture; this is a direct result of improved government actions to control deforestation (Arima et al. Citation2014). One can also see that, after 2009, there has been much direct transition of pasture areas to single cropping and double cropping. Arguably, this change can be attributed to increased public action to control deforestation. Since direct expansion of croplands over forest has been reduced, new agricultural areas tend to replace pasture lands. Also, there is a strong trend towards use of double cropping practices, which increase crop production without expanding cropland area. Thus, the use of LUC Calculus produces information that helps experts to better understand the causes and effects of Amazon deforestation.
Figure 8. Direct land-use transitions in Itanhangá.
5. Implementation considerations
The proposed calculus has been implemented in R, a programming language and statistical environment (R CORE TEAM Citation2015). We used R because it provides a wide variety of open source statistical and graphical packages and is largely accepted in the scientific community. The lucCalculus R package is available on the GitHub service.Footnote1 In its current version, the lucCalculus package works on a set of classified images stored as GeoTIFF files. The spatial predicates HOLDS, EVOLVE, CONVERT and RECUR and Allen’s interval predicates, such as BEFORE, AFTER, MEETS and others, are implemented; there are additional functions to visualise results in graphics or maps.
To demonstrate the implementation, we show in Listing 1 a minimum working example in R that uses the RECUR predicate. The code matches the example presented in . The inputs are a set of classified land cover maps. In the example, we search for all forest locations that have been replaced by pasture, degradation, single cropping or double cropping, were abandoned and were reconverted back to into forest areas again.
The input parameters are a raster file containing a set of classified maps, the timeline of the classified maps and the set of labels used in the classification. We apply the RECUR predicate using the function lucC_pred_recur. The result is a binary matrix whose positive values are the pixels that satisfy the predicate at each time instance. The result is combined with the original raster object to generate a new raster object, that corresponds the . A complete example is available in GitHub repository.
Listing 1: Minimum working example of RECUR predicate implemented in R language.
To evaluate the performance of the lucCalculus package, we processed 16 years of classified images of high resolution derived from more than 16,8 million long-term time series of the Moderate Resolution Imaging Spectroradiometer (MODIS) data, using a machine using 4 cores with 2.4 GHz and 16 GB memory. The full processing, including different queries for land-use trajectories, took approximately four hours of computation time.
6. Discussion and conclusions
This study proposes a spatiotemporal calculus for land-use trajectory (LUC Calculus). The calculus uses ideas from the EXP/HIST and extends Allen’s interval logic with additional predicates to express land-use change situations. It fits the needs of analysing land-use change using big Earth observation data sets, which provide a near-continuous record of observations. In the paper, we show how to use the LUC Calculus to describe land-use trajectories. In this way, scientists can better understand the environmental and economic effects of land-use change.
The LUC Calculus has constraints. It needs a near-continuous data set of remote sensing images, without data gaps, so that each temporal interval can be assigned to a land-use. Another restriction is the need for data analysis techniques capable of classifying big Earth observation data. The quality of the classification is essential for the calculus to produce good results. A further limitation of the LUC Calculus is its definition of land-use transition. It assumes that a land-use transition is defined by a single state (the label of the land-use). In the more general case, it would be useful to associate different properties to transitions. The properties could be numerical values, ranges of values, or probabilities. Another restriction is that the current version of the LUC Calculus does not consider the states associated with the spatial neighbours of a location. We intend to address these limitations in future versions of the LUC Calculus.
The proposed formalism is suitable for applications of yearly classified satellite imagery, where each trajectory is associated with a location and contains a set of classes over time. We applied the calculus to reason about land-use change, but this calculus could be applied to other scenarios. For instance, to reason about: the evolution of deforestation, direct changes considering expansion of agriculture areas, land-use conversion to an urban area, distinguish between degradation and deforestation, among others. In a particular domain, the spatiotemporal calculus could be used to reason about dengue cases, or other viruses, to show its recurrence in an area.
The three predicates (RECUR, CONVERT, EVOLVE) provide an expressive way to perform spatiotemporal queries for land-use change trajectories. However, their current definition only applies to pixels in raster data. One possible extension would be to consider values of the pixel neighbourhood. This would allow users to reason about spatial processes which are distance-related. It is well known that many land-use processes have a diffusive component, e.g. it is more likely to find a new deforested area close to previous forest cuts than in the middle of a dense forest.
Another possible extension of the current work would be to convert raster data to vector objects and consider their evolution. In this case, we would need to consider previous works on object evolution which consider how object boundaries change (Hornsby and Egenhofer Citation2000, Mendonça-Santos and Claramunt Citation2001, Mota et al. Citation2009, Ferreira et al. Citation2014). Furthermore, the concept of relative motion (Laube et al. Citation2005) could be applied to discover vector objects with similar land-use trajectories. However, one should consider whether the additional work of object management is worth the effort, since there are a large number of land-use change studies that can be performed with the proposed LUC Calculus.
Acknowledgments
We thank the editor and the anonymous reviewers for their suggestions and comments that helped to improve the quality of the paper.
Disclosure statement
No potential conflict of interest was reported by the authors.
Additional information
Funding
Notes on contributors
Adeline Marinho Maciel
Adeline M. Maciel received the Ph.D. degree in Applied Computing from National Institute for Space Research (INPE), Brazil, in 2017. Her current research interests are spatiotemporal analysis, land-use change, geoinformatics, and data mining.
Gilberto Camara
Gilberto Camara is a Senior Researcher at Brazil's National Institute for Space Research (INPE). His research interests are geoinformatics, spatial analysis, land-use change, and big Earth observation data analysis.
Lubia Vinhas
Lubia Vinhas is a Senior Researcher at Brazil's National Institute for Space Research (INPE). Her research interests are geoinformatics, geographical information systems, land-use change, and big Earth observation data analysis.
Michelle Cristina Araújo Picoli
Michelle C. A. Picoli is a postdoctoral research in National Institute for Space Research (INPE), Brazil. Her research interests are statistical modeling, geotechnology and agricultural remote sensing, environmental impacts studies, and agriculture monitoring.
Rodrigo Anzolin Begotti
Rodrigo A. Begotti is a postdoctoral research at INPE, Brazil. His research interests are deforestation and forest degradation monitoring, landscape ecology and conservation of biodiversity.
Luiz Fernando Ferreira Gomes de Assis
Luiz Fernando F. G. de Assis received the B.Sc. degree in Computer Science from São Paulo State University, Brazil, in 2012, and the MSc. degree in Computer Science and Mathematical Computing from São Paulo University, Brazil, in 2015. His current research interests include distributed systems, GIScience and Geoinformatics.
Notes
Related Research Data
References
- Allen, J.F., 1983. Maintaining knowledge about temporal intervals. Communications of the ACM, 26 (11), 832–843. doi:10.1145/182.358434
- Allen, J.F., 1984. Towards a general theory of action and time. Artificial Intelligence, 23 (2), 123–154. doi:10.1016/0004-3702(84)90008-0
- Arima, E.Y., et al., 2014. Public policies can reduce tropical deforestation: lessons and challenges from Brazil. Land Use Policy, 41, 465–473. doi:10.1016/j.landusepol.2014.06.026
- Arvor, D., et al., 2011. Classification of MODIS EVI time series for crop mapping in the state of Mato Grosso, Brazil. International Journal of Remote Sensing, 32 (22), 7847–7871. doi:10.1080/01431161.2010.531783
- Bennett, B., et al., 2002. Multi-dimensional modal logic as a framework for spatio-temporal reasoning. Applied Intelligence, 17 (3), 239–251. doi:10.1023/A:1020083231504
- Câmara, G., et al., 2016. Big Earth observation data analytics: matching requirements to system architectures. In: Proceedings…, New York, NY, USA. 5th ACM SIGSPATIAL International Workshop on Analytics for Big Geospatial Data (BigSpatial “16). ACM, 1–6. doi:10.1145/3006386.3006393
- Claramunt, C. and Thériault, M., 1996. Toward semantics for modelling spatio-temporal processes within GIS. In: Proceedings…, Delft, The Netherlands. 7th International Symposium on Spatial Data Handling: Advances in GIS research II (SDH “96). Taylor & Francis, 27–43.
- Didan, K., 2015. MOD13Q1 MODIS/Terra Vegetation Indices 16-Day L3 Global 250m SIN Grid V006. NASA EOSDIS Land Processes DAAC. doi:10.5067/modis/mod13q1.006
- Ferreira, K.R., Câmara, G., and Monteiro, A.M.V., 2014. An algebra for spatiotemporal data: from observations to events. Transactions in GIS, 18 (2), 253–269. doi:10.1111/tgis.12030
- Frank, A.U., 2005. Map algebra extended with functors for temporal data. In: Akoka, J., et al., eds. Perspectives in Conceptual Modeling. Berlin, Heidelberg: Springer Berlin Heidelberg, 194–207. ISBN: 978-3-540-32239-9.
- Galton, A., 2004. Fields and objects in space, time, and space-time. Spatial Cognition & Computation, 4 (1), 39–68. doi:10.1207/s15427633scc0401_4
- Galton, A., 2008. Experience and history: processes and their relation to events. Journal of Logic and Computation, 18 (3), 323–340. doi:10.1093/logcom/exm079
- Geist, H., et al., 2006. Causes and trajectories of land-use/cover change. Berlin, Heidelberg: Springer Berlin Heidelberg, 41–70. doi:10.1007/3-540-32202-7_3
- Gibbs, H.K., et al., 2010. Tropical forests were the primary sources of new agricultural land in the 1980s and 1990s. Proceedings of the National Academy of Sciences, 107 (38), 16732–16737. doi:10.1073/pnas.0910275107
- Grenon, P. and Smith, B., 2004. SNAP and SPAN: towards dynamic spatial ontology. Spatial Cognition & Computation, 4 (1), 69–104. doi:10.1207/s15427633scc0401_5
- Hornsby, K. and Egenhofer, M.J., 2000. Identity-based change: a foundation for spatio-temporal knowledge representation. International Journal of Geographical Information Science, 14 (3), 207–224. doi:10.1080/136588100240813
- IBGE, 2016. Brazilian Institute of Geography and Statistics (IBGE) - Cities. Available from: https://cidades.ibge.gov.br [Accessed 25 Aug 2016]
- Kuhn, W., 2012. Core concepts of spatial information for transdisciplinary research. International Journal of Geographical Information Science, 26 (12), 2267–2276. doi:10.1080/13658816.2012.722637
- Laube, P., Imfeld, S., and Weibel, R., 2005. Discovering relative motion patterns in groups of moving point objects. International Journal of Geographical Information Science, 19 (6), 639–668. doi:10.1080/13658810500105572
- Maus, V., et al., 2016. A time-weighted dynamic time warping method for land-use and land-cover mapping. IEEE Journal of Selected Topics in Applied Earth Observations and Remote Sensing, PP (99), 1–11.
- Mendonça-Santos, M. and Claramunt, C., 2001. An integrated landscape and local analysis of land cover evolution in an alluvial zone. Computers, Environment and Urban Systems, 25 (6), 557–577. doi:10.1016/S0198-9715(00)00031-4
- Mennis, J., 2010. Multidimensional map algebra: design and implementation of a spatio-temporal gis processing language. Transactions in GIS, 14 (1), 1–21. doi:10.1111/j.1467-9671.2009.01179.x
- Mennis, J., Viger, R., and Tomlin, C.D., 2005. Cubic map algebra functions for spatio-temporal analysis. Cartography and Geographic Information Science, 32 (1), 17–32. doi:10.1559/1523040053270765
- Mota, J.S., et al., 2009. Case-based reasoning for eliciting the evolution of geospatial objects. In: International Conference on Spatial Information Theory. Springer, 405–420.
- Peuquet, D.J. and Duan, N., 1995. An event-based spatiotemporal data model (ESTDM) for temporal analysis of geographical data. International Journal of Geographical Information Systems, 9 (1), 7–24. doi:10.1080/02693799508902022
- R CORE TEAM, 2015. R: A language and environment for statistical computing. Vienna, Austria: R Foundation for Statistical Computing. Available from: http://www.R-project.org/
- Tomlin, C.D., 1990. A map algebra. Cambridge, MA: Harvard Graduate School of Design.
- Verburg, P.H., et al., 2010. Trajectories of land use change in Europe: a model-based exploration of rural futures. Landscape Ecology, 25 (2), 217–232. doi:10.1007/s10980-009-9347-7
- Worboys, M., 2005. Event-oriented approaches to geographic phenomena. International Journal of Geographical Information Science, 19, 1–28. doi:10.1080/13658810412331280167
- Yuan, M., 2001. Representing complex geographic phenomena in GIS. Cartography and Geographic Information Science, 28 (2), 83–96. doi:10.1559/152304001782173718
- Zhao, A., et al., 2016. Impacts of land use change and climate variability on green and blue water resources in the Weihe River Basin of northwest China. CATENA, 137, 318–327. Available from: http://www.sciencedirect.com/science/article/pii/S0341816215301181