
 ?Mathematical formulae have been encoded as MathML and are displayed in this HTML version using MathJax in order to improve their display. Uncheck the box to turn MathJax off. This feature requires Javascript. Click on a formula to zoom.
ABSTRACT
In police planning, a territory is often divided into several patrol districts with balanced workloads, in order to repress crime and provide better police service. Conventionally, in this districting problem, there is insufficient consideration of the impacts of street networks. In this study, we propose a street-network police districting problem (SNPDP) that explicitly uses streets as basic underlying units. This model defines the workload as a combination of different attributes and seeks an efficient and balanced design of districts. We also develop an efficient heuristic to generate high-quality districting plans in an acceptable time. The capability of the algorithm is demonstrated in comparison to an exact linear programming solver on simulated datasets. The SNPDP model is successfully implemented and tested in a case study in London, and the generated police districts have different characteristics that are consistent with the crime risk and land use distribution. Besides, we demonstrate that SNPDP is superior to an aggregation grid-based model regarding the solution quality. This model has the potential to generate street-based districts with balanced workloads for other districting problems, such as school districting and health care districting.
1. Introduction
Districting is the problem of grouping small geographic areas into larger and contiguous geographic clusters, in a way that the results meet the predefined planning criteria (Kalcsics Citation2015). Depending on the context, districting is also called territory design, territory alignment, zone design, sector design, spatially constrained clustering, or regionalisation. Districting problems have been motivated by and applied to a large number of fields, ranging from political districting of electoral areas (Vickrey Citation1961, Cirincione et al. Citation2000, Bozkaya et al. Citation2003), sales and service territory alignment (Hess and Samuels Citation1971, Blais et al. Citation2003, Galvão et al. Citation2006), health care districting (Thomas Citation1979), school districting (Clarke and Surkis Citation1968, Schoepfle and Church Citation1991, Caro et al. Citation2004), to police patrol districting (Mitchell Citation1972, Curtin et al. Citation2005).
In the context of policing, the district design is motivated by various purposes, including patrol planning, emergency response, reporting and demographic police research (Mitchell Citation1972, Sarac et al. Citation1999). In terms of patrol planning and emergency response, one of the most relevant criteria is the workload balance, which ensures the timeliness of emergency response and the effectiveness of patrol activities (Camacho-Collados et al. Citation2015). In contrast, an uneven workload distribution would lead to an imbalance in staffing, morale problems and span-of-control issues (Kistler Citation2009). In particular, some districts are overstaffed while others are understaffed, and the officers with excessive workload would easily become dissatisfied. For these reasons, some police departments would redesign the division boundaries after a certain period to equalise the workload (Kistler Citation2009).
Conventionally, the design of police districts is based on areal units, including grid (Mitchell Citation1972, Bodily Citation1978, Carroll and Laurin Citation1981, Zhang and Brown Citation2013, Camacho-Collados et al. Citation2015), census block (Liberatore and Camacho-Collados Citation2016) and r-district (D’Amico et al. Citation2002), among others. However, there are several limitations associated with these units. First, the grid structure is often selected by the planners and administrators, and the decision is empirical and arbitrary. The district configuration may be sensitive to the unit type and unit size, which is an instance of the modifiable areal unit problem (MAUP) (Openshaw and Taylor Citation1979, Openshaw Citation1984). More precisely, the MAUP includes two components: the scale problem and the aggregation problem. The scale problem is defined as the variation of results when the same areal data are aggregated into larger areal units for analysis. In contrast, the aggregation problem concerns the variations in results due to alternative units of analysis where the number of units is constant. Second, areal units could intersect physical features (e.g. lakes) or barriers (e.g. railway tracks), and could be not well connected on the street network.
The street segments represent a promising unit for the patrol sectors, as the street structure fundamentally influences the human movement patterns. Recent findings in criminology suggest that the street networks shape the long-term pattern of crimes (Davies and Johnson Citation2015, Summers and Johnson Citation2017), as well as the short-term dynamics of crime behaviours (Davies and Bishop Citation2013, Johnson and Bowers Citation2014). These imply that street-based models are appropriate for the description and prediction of crime risks (Rosser et al. Citation2017). Thus, the use of street networks in crime prevention efforts, especially the design of patrol district, is well-motivated, and this has two possible advantages: first, it may amplify the effect of targeted policing, and second, it may enhance the usability of the patrol district and patrol plans. Despite these advantages, few existing studies on police districting problem (PDP) have attempted to use street segments as basic units.
In summary, while it is essentially important to incorporate the street network in the PDP, there is a lack of police districting models that explicitly use street segments as basic units. This study aims to explore the potential of street segments in the police district design and to develop efficient methods for the large-sized PDPs.
Formulating and solving the street-based PDP may present new challenges. The first challenge lies in the representation of streets in the policing context. Although several methods exist that can represent street networks as graphs (Jiang and Claramunt Citation2004; Porta et al. Citation2006b; Porta et al. Citation2006a), it is unclear which method is appropriate. Another challenge is that a street-based PDP with a large number of street units is computationally demanding and hinders the use of the existing algorithms for PDP. This requires the development of efficient algorithms to generate high-quality districting plans in an acceptable time.
To overcome the challenges, in this study we develop an efficient and balanced district design on urban street networks. First, we formulate a multi-criteria police districting model that uses streets as basic units. The model incorporates several relevant workload attributes and a trade-off between the average workload and the workload balance among districts. Second, we propose an efficient heuristic method for large-sized PDP by integrating a graph-partitioning algorithm and a tabu search method. Third, we compare this model with an alternative model that aggregates the patrol demand into a grid, and the results indicates that street-network police districting problem (SNPDP) is superior to the aggregation model regarding the solution quality and the district connectivity.
The paper is organised as follows: Section 2 describes a formulation of the SNPDP; in Section 3, a two-step heuristic method is proposed to solve the SNPDP. In Section 4, an alternative grid-based approach to solving the SNPDP is outlined. In Section 5, a case study based on the London Borough of Camden is reported on, which demonstrates the application and efficiency of the SNPDP. Finally, Section 6 discusses the advantages and limitations of the proposed model and suggests future research directions.
2. A street-network police districting problem (SNPDP)
In this section, the SNPDP is introduced. The goal of this model is to partition the street network, denoted by SN, into a given number, m, of patrol districts in the best possible way. A solution of for SNPDP is denoted as D = {d1, d2, …, dm}. The workload of a district is evaluated by a weighted sum of three attributes – crime risk, area size and diameter.
In this section, first, there is a discussion on how to represent the street network, then the model constraints, workload attributes and objective functions are described. Finally, an exact formulation of the SNPDP is presented, followed by a discussion on the differences between SNPDP and the Police Patrol Area Covering (PPAC) model.
2.1. Street network representation
The first step in this model is to represent the street network as a graph. There are several methods for obtaining such a representation, with varying theoretical and mathematical implications, and the choice should depend on the task. One well-developed method, called the ‘dual’ network model, represents the roads as nodes, and places links between any two nodes that share a junction (Jiang and Claramunt Citation2004, Porta et al. Citation2006a). This representation allows for a street-oriented computational analysis of the properties of an urban street network. As the PDP model in this study focuses on the partition of the streets, this network representation is adopted. The underlying street network is modelled by an undirected graph, G = (V, E), with V corresponding to the named street links and E to the intersections of links (see ).
Figure 1. Construction of the dual representation of a street network. This example shows a section of the Camden network. (a) The original street network map, as obtained from Integrated Transport Network dataset produced by Ordnance Survey. (b) Map zoomed to the section highlighted in red and background map image removed. (c) Nodes placed at the midpoints of streets. (d) Links added between all pairs of connected streets, with original street network removed.
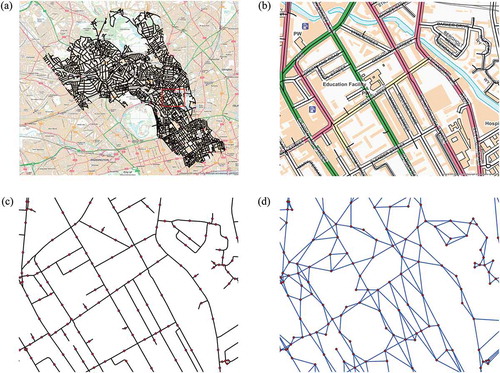
The distance between two streets, dist(i, j), in graph G is defined as the shortest path distance between their midpoints (She et al. Citation2015). Accordingly, the distance between all pairs of streets can be efficiently computed using the Floyd–Warshall algorithm (Floyd Citation1962). A different definition was adopted by Butsch et al. (Citation2014), which defined dist(i, j) as the minimum distance between their end nodes.
2.2. Districting constraints
Below, the two constraints that any feasible districting plan must satisfy are described.
2.2.1. Complete and exclusive assignment
The districts cannot overlap and must cover the entire patrol area. Moreover, each district should be non-empty.
2.2.2. Contiguity
A district must contain basic units that are connected to each other within the district. This implies that an officer cannot be assigned to a patrol sector that is composed of two or more separate parts. Moreover, unconnected districts would lead to excessive response time and inefficient resource deployment. In this study, the terms ‘contiguity’ and ‘connectivity’ are used interchangeably.
The contiguity constraint is satisfied in the methods for the SNPDP in two ways. First, in the exact formulation, the contiguity constraint is designed by borrowing concepts from graph-partitioning. Specifically, the constraint is an extension of the ordered-area assignment conditions that are developed to enforce contiguity in the site design (Cova and Church Citation2000). Second, in the proposed heuristic, the initial solutions are constructed by the graph-partitioning method, and are then modified via iteratively moving a unit from one district to another, on condition that the district contiguity is maintained.
2.3. Workload attribute
Here, three relevant workload attributes of a district are described, including risk, area size and diameter. To be comparable, each attribute is formulated as a relative and dimensionless ratio between 0 and 1. These attributes have been used to quantify the workload of a police district by several previous research (Camacho-Collados et al. Citation2015, Liberatore and Camacho-Collados Citation2016). The crime risk indicates the potential number of calls for service in the district; the area attribute identifies the size of the territory that should be patrolled; the diameter represents the maximum travelling distance within the district.
2.3.1. Risk
The future crime risk on a street can be estimated using historical data and a predictive crime mapping approach (Rosser et al. Citation2017). The crime risk in a district, , is the sum of the risks associated with the contained streets, and the risk measure,
, is expressed as the ratio of the risk of
to the entire area risk, as Equation (8).
Some previous studies used the number of calls for service or incidents as an attribute of workload (Kistler Citation2009). These attributes are similar with the crime risk. As the crime risk in this study is based on the historical incidents and other factors, it is a better indicator of the future workload than the pure number of incidents. Therefore, the crime risk attribute is used here rather than the number of incidents.
2.3.2. Area
The area factor quantifies the size of the territory that an officer should patrol. The area measure, , is defined as the ratio of the total length of streets in the district,
, to the entire network, as in Equation (9).
2.3.3. Diameter
During patrolling, officers have to travel within districts to ensure security and respond to calls for service. Intuitively, a considerable (average or maximum) internal travel distance makes a district challenging to patrol. Therefore, it is favourable to reduce the day-to-day travel distance within districts. Here, the diameter measure is adopted to represent the maximum internal travel distance within a district, or the travel distance in the worst case.
The diameter of a district is defined as the maximum distance between any pair of points in it. It approximates the maximum distance an officer has to travel in the case of a call for service. The diameter measure, , is the ratio of the district diameter to the diameter of the entire graph, as in Equation (10).
2.4. Objective function
The workload is a convex combination of the three relevant attributes. The weights can be determined according to the preferences of police experts. Given the weights, the district workload, , can be computed using Equation (11).
The objective of the SNPDP is to generate districting plans that are both efficient and balanced. First, a districting plan is said to be efficient if the average workload is low. Second, a districting plan is perfectly balanced if the workloads of all districts are equal. As perfectly balanced districts cannot always be achieved, a common measure of workload balance is to use the mean absolute deviation of the workloads.
Both the workload average and deviation should be minimised so as to achieve a good districting plan. However, there might be a trade-off between these two objectives, meaning that improving on one objective may worsen the other. For example, a decrease in the workload deviation could lead to a higher average workload. Hence, two objectives are combined via a convex combination, as in Equation (1). This objective allows the experts to express their preferences concerning the two objectives and examine the trade-off between them. As these two objectives can have different scales, the trade-off between them and the value should be carefully determined. By varying the coefficient
, a range of different models between efficiency (
) and balance (
) can be obtained.
Another way to optimise these two objectives is to treat balance as a hard constraint and to minimise the workload average in the objective function (Salazar-Aguilar et al. Citation2011). In this formulation, the workload of each district is required to lie between a given lower and upper bound, and the bounds are determined by workload average and a tolerance parameter. This approach is not adopted in this study, as this study is focused on minimising the workload average and deviation simultaneously.
2.5. An exact formulation
Here, an exact mixed integer programming (MIP) formulation for the SNPDP is provided:
Parameters:
n = number of basic units;
i, j = index of basic units; I = set of basic units, I = {1,…,n};
m = number of districts;
k = index of district; K = set of districts, K = {1, …, m};
c = index of contiguity order, c ∈ {0, …, q}, q = n −1.
Decision variables:
Minimise
Subject to
This model is formulated as a minimisation problem with an objective function in Equation (1), and the two terms represent the workload average and average workload deviation respectively. They are merged into one single value by a weight, .
Constraint Equation (2) establishes that a district, k, should be non-empty and have exactly one root unit. A root unit for a district has a contiguity order of 0. Constraint Equation (3) requires that each unit should be assigned to exactly one district and one contiguity order. Constraint Equation (4) enforces that a unit, i, can be assigned to a district, k, with order c if and only if a unit j exists in the neighbourhood of i, and that j is assigned to district k in order (c − 1).
Constraint Equations (5), (6) and (7) select the pairwise distance that must be considered for calculating the diameter of any distance. Therefore, the binary variable , if and only if both units i and j are assigned to district k, regardless of the order they are assigned in.
Constraint Equations (8), (9) and (10) define the workload attributes, including risk, area and diameter. Constraint (11) defines the workload of a district, k, as the linear combination of three attributes. Constraint Equations (12) and (13) describe the absolute difference, , between the workload of district k and the average workload as the maximum of their differences. Constraint Equations (14) and (15) guarantee that both
and
are binary variables.
This formulation of the SNPDP model is computationally complicated. It has variables and
constraints, which quickly make the model intractable as the number of units and districts increase.
2.6. Difference between the SNPDP and PPAC model
It is worth clarifying the differences between the SNPDP and the PPAC model (Curtin et al. Citation2010). The PPAC model optimises the delineation of police sectors by assigning the existing beats to new sectors, following two steps. First, the optimal locations of the sector centres are identified by maximising the number of historical incidents that are within the acceptable service distance of a sector centre. Second, the sector boundaries are determined by assigning the beats to new sectors based on the incidents served by the sector centres.
The SNPDP is different from the PPAC model in several aspects. First, the problem definition is different. While the PPAC model seeks the maximal coverage of historical incidents, the SNPDP aims at a district design with a low average and deviation of the workload. Second, the basic units are different. In the PPAC, beat centroids are used as candidate locations for sector centres, and new sectors are generated by assigning the beats in an optimal way. In comparison, the SNPDP uses streets as the basic units for police districts, the output being a partition of the street network into several districts. Third, the role of the street network is different. In the PPAC, the optimal coverage is based on the street-network distance between sector centres and historical incidents. In the SNPDP, the function of the street network is two-fold: the streets comprise the model units and the network distance between the units is used.
3. The heuristic method for SNPDP
In this section, we first review the existing methods for districting problems, and then propose an efficient two-step heuristic method for PDP.
3.1. Existing methods for districting problems
The existing methods for districting problems can be classified into two broad optimisation categories, namely exact methods and heuristic methods. The exact methods aim to identify a provable best solution such that no better solution exists. Common exact methods include enumeration and linear or MIP. One of the main challenges in using MIP for districting problems is to find an effective strategy for incorporating spatial contiguity constraint (Duque et al. Citation2007). Unfortunately, there are practical limitations associated with the exact methods, meaning that they are only applicable to small-sized problems. The reason is that most districting problems are NP-hard (Garey and Johnson Citation1979), indicating that the computational cost normally increases rapidly with the problem size.
In contrast, heuristics methods provide an efficient approach to overcoming the restrictions of an exact method. A heuristic is often an ad hoc, rule-of-thumb, or general approach that tackles the problem approximately (Tong et al. Citation2009). A variety of heuristics have been developed and used, including tabu search, simulated annealing, genetic algorithms, neural networks, among others (Blum and Roli Citation2003). Some heuristics, such as tabu search, have the advantages of searching the solution space efficiently and being able to escape from local optimal solutions. Therefore, we will use the heuristic methods to solve the SNPDP.
Among others, tabu search has proven to be one of the most used heuristic options when addressing districting problems. Tabu search accepts an initial feasible solution and iteratively modify the solution while searching for improvements in the objective function. Because of the capacity for escaping local optimal solution by allowing non-improving moves, tabu search methods have good performances in tackling districting problems. They have been applied in political districting (Bozkaya et al. Citation2003, Ricca and Simeone Citation2008), zone design (Openshaw and Rao Citation1995), home care districting (Blais et al. Citation2003), and the max-p-regions problem (Duque et al. Citation2012, She et al. Citation2017). Therefore, tabu search can be utilised to tackle the PDP, and this possibility is to be explored in this section.
3.2. GP–TS heuristic method for PDP
The problem discussed in Section 3 poses enormous computational challenges, especially when the problem size is large. Here, a two-step heuristic method for the PDP is proposed that considers the workload balance among districts.
This is partly inspired by the Random-Greedy-and-Tabu-Search (RG–TS) heuristic (Camacho-Collados et al. Citation2015, Liberatore and Camacho-Collados Citation2016), which is proposed for PDPs based on grids and census blocks. It consists of two steps – RG and TS. In the RG step, a districting solution is produced by randomly selecting a node for each district and expanding the districts in a greedy way, while keeping their contiguity. In the TS step, the initial solutions are improved by a tabu search.
Although the RG–TS proves efficient for PDPs based on grids and census blocks, it is inefficient for large-sized problems. In the RG step, the initial solution expands gradually to involve a new unit in one step, which is slow for a large problem. Moreover, the original tabu search procedure is also slow for a large problem.
Here, we propose an efficient heuristic Graph-Partition-and-Tabu-Search (GP–TS) to approximately solve the SNPDP. First, a graph-partitioning method is used to generate a set of feasible solutions, and second, the solutions are improved using an efficient TS procedure.
In the GP step, the Karlsruhe Fast Flow Partitioner Evolutionary algorithm (KaFFPaE) (Sanders & Schulz Citation2012) is used to generate the initial partition of the area. The KaFFPaE is a distributed evolutionary algorithm for tackling the graph-partitioning problem, and it is well-suited for the SNPDP for the following reasons. First, it enforces the contiguity of each district by imposing a penalty on incontiguous partitions. Second, KaFFPaE can generate a balanced partition, in which the maximum block (or district) weight is constrained to (1 + ) times the average block weight, and the block number and deviation tolerance (
) are provided by the user. Moreover, KaFFPaE includes a random component, meaning that it can generate a set of feasible and varying solutions to guarantee substantial exploration of the solution space. However, KaFFPaE only accepts node attributes as inputs, and it is unable to implement a district diameter. Therefore, it is used to generate balanced districts only regarding the area and risk.
The second step uses a TS algorithm to improve the solutions. The TS algorithm iteratively modifies the current solution by moving a node from one district to a neighbouring district, in the hope of finding a better solution. The advantage of the TS lies in its ability to avoid local optimality by putting the recently visited solutions in the tabu list (‘tabu’ meaning forbidden). In each iteration, the best move is chosen if it outperforms the best solution ever explored. Otherwise, the best non-tabu move is chosen. The TS terminates when any of three criteria are met: (1) the running time exceeds the predefined maximum time; (2) no improvement over the current solution is found and (3) all moves are tabu; the number of iterations since the last improvement over the best solution exceeds the threshold.
As the TS involves numerous times of evaluating a new solution, it is extremely slow for large problems. Here, the efficiency of the TS is improved by introducing two new features: a fast delta evaluation for new solutions, and rapid identification of feasible moves, as explained below.
Delta evaluation is a technique used in evaluating a modified solution quickly. As the modification involves only one or two districts, the delta evaluation updates only the attribute of the affected districts, which makes it more efficient than a complete evaluation following the definitions. The cost of the delta evaluation is the storage of the attributes of each district in the current solution. In each iteration of the TS, delta evaluation is used to evaluate all feasible moves.
A move generates a feasible solution if it does not disconnect any district. Since a move involves an origin district and a destination district, this condition means that both districts must not be disconnected by the move. According to Ricca and Simeone (Citation2008), the migrating node: (a) must be adjacent to a node in the destination district and (b) must not be a cut-node for the origin district. A brute force method to identify all feasible moves would test every possible move and the connectivity of the two involved districts, which is very inefficient. Here, a fast identification of feasible moves is proposed. To test condition (a) efficiently, for a given district, the boundary is the subset of nodes that are adjacent to a node in a different district. In this implementation, the boundary of a district is stored and dynamically updated. In order to test condition (b) efficiently, for a migrating node x, a subgraph of the origin district is constructed that comprises the first- and second-order neighbours of x. Clearly, is not a cut-node of the origin district if and only if either this subgraph is connected or the graph of the origin district excluding x is connected, and the test can stop if the subgraph is connected. Since the subgraph is small, and the typical urban street network is well connected, the subgraph is very likely to be connected, resulting in considerable time savings by avoiding testing the entire district.
4. A grid-based aggregation model of the SNPDP
This section presents an alternative grid-based approach to generating a street-based districting plan, and this approach is used for evaluating the original SNPDP model. Specifically, this approach initially aggregates the policing workload into grids, and then solves a grid-based PDP, ultimately transforming the solution to the street network. This approach may be advantageous in practice, as it can generate street-based districts using the existing formulations and algorithms for the grid-based districting problem. Moreover, this approach alleviates the computational cost as the grid-based PDP has fewer units. However, it leads to the aggregation error in location models (Francis et al. Citation2009), when the original demands are replaced by aggregate demands.
This approach is illustrated in . In the first step, a spatial grid is created, which consists of uniform square cells of a predefined size. The grid uses the Rook’s neighbourhood relation, in which any two cells that share a boundary line are neighbours. The distance between two neighbouring cells is equal to the cell size. Each cell is intersected with the street network, and its area size (or crime risk) is set as the sum of the intersections with the streets. The cells with no intersections with the network are removed from the grid.
Figure 2. The illustration of the aggregation model for producing street-based districts (n = 6, m = 3). (a) The street network is overlaid with a spatial grid. The dots represent the street midpoints. (b) Cells with no intersections with streets are removed. A grid-based PDP is formulated and solved. (c) The grid solution is transformed into a street solution. The blue and red districts are unconnected.
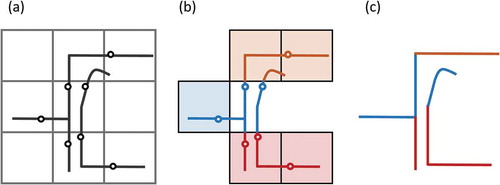
In the second step, a grid-based districting problem is formulated, in a similar way to that of the SNPDP in Section 3, except that the units represent cells. This problem is solved by the GP–TS heuristic proposed in Section 3.
In the third step, the districting solution on grids is transformed into a solution on the street network, by assigning each street to the district in which the midpoint of the street is located. Although each grid-based district is connected, the generated network-based districts are not guaranteed to be contiguous. The network-based districts can be refined to become contiguous, but here no post-treatments are conducted, as the objective is to compare the efficiency of the SNPDP against the aggregation models, and the post-treatment may interfere the comparison.
The cell size influences both the computational demand of all the steps and the quality of the final solution. In particular, it has a three-fold effect. First, it affects the assignment of the attributes of the streets to the cells. A small size implies a large number of cells and thus increases the computational cost of the intersection. Second, it affects the computational cost of solving the grid-based PDP. Similarly, the smaller the cell size, the higher computational demand. Third, it influences the quality of the final solution. At a finer scale, it is more likely to achieve a high-quality solution. Because of the manifold effect, the cell size should be carefully tested and selected.
This aggregation model results in an aggregation error, as the original street units are replaced by grids. Here, a straightforward measure to evaluate the aggregation error from the grid-based model is proposed. The measure is the relative gap from the solution, , by the aggregation model to the solution,
, by the SNPDP, as follows:
The gap is positive if the solution from the SNPDP outperforms that of the aggregation model. A gap close to 0 would indicate an insignificant difference between the two models.
5. Experiments
In this section, we demonstrate the solution quality of the proposed heuristic on several simulated SNPDP datasets, and then illustrate the problem-solving capability and the scalability of the SNPDP model and the heuristic in a case study in the Camden borough of London. The algorithms were implemented in Java 1.8, and were tested on a machine with two i7-4790 Intel CPUs and 32.0 GB DDR3 memory. GUROBI (version 7.5.2) is a commercial optimisation software package that was utilised to obtain the optimal or suboptimal objective value of the MIP formulation.
5.1. Optimality analysis
Here, we compare the solutions of the GP–TS with the solutions generated by GUROBI on a set of simulated datasets. We use a number of instances that are extracted from the Camden street network, with different numbers of units (n = 20, 25, 30, 50, 100, 200) and districts (m = 3–7). The Camden street network is introduced in Section 5.2. Each instance was generated by randomly selecting a node as the seed and gradually expanding the graph using the breadth-first search until the desired instance size is reached. The computational complexity of the SNPDP has been discussed in Section 3, and the above problem sizes were selected to guarantee that at least some of the instances could be solved optimally within the 7-day time limit for GUROBI.
The experimental settings were as follows: for the parameters in the SNPDP, equal weights were adopted for both the workload function (11) and the objective function (1), meaning that ,
, and
were set to 0.333, and
was set to 0.5. For each instance, GP–TS was conducted for 10 runs, and, in each run, the maximum computation time of tabu search was set to 0.5 h, which was a trade-off between solution quality and computation time. Hence, the time limit of GP–TS was approximately 5 h. Two parameters of TS, namely tabu length (i.e. size of the tabu list) and max iteration (i.e. maximum iteration since the last improvement), were both set to the number of units. It was noted that, in all experiments, the TS did not terminate until the maximum runtime had elapsed. The combination of GP and GUROBI was also experimented, in which the GP solutions was used as the initial solution and input to GUROBI. This leads to the same result and similar computation efficiency as the pure GUROBI solver.
shows the results of the instances using 20, 25, 30 units, as GUROBI failed to identify feasible solutions for the other instances within the time limit. The benchmark solution is the best solution by GUROBI. The gap (%) is the relative quality of the solution from the heuristic compared to that of the benchmark solution.
Table 1. Computational results on the simulated instances using GUROBI and the GP–TS.
As indicated in , GUROBI identified the optimal solutions for 15 problems, and the GP–TS found the optimal solutions for 11 of them. Note that for large-sized problems (e.g. n = 30 and m = 6 or 7), the solution time needed by GP–TS was 5 h, which is significantly less than the time required by GUROBI. For all the problems in , the best gap and average gap are within 10% (with one exception), implying that most of the solutions found by the GP–TS are fairly close to the benchmark solutions. In addition, for problems with more than 30 units (not shown in ), while GUROBI failed to find a feasible solution within 24 h, the GP–TS was capable of deriving a solution in a short time. This highlights the capability of the GP–TS to identify high-quality solutions in an acceptable time.
5.2. The London Borough of Camden
Camden, a borough in northwest Inner London, is policed by the Metropolitan Police Service (MPS). The total area of Camden is 21.8 km2 and the total street length is 347.0 km. Recently, the MPS has been implementing and testing a street-level predictive policing system. By integrating street-level crime risk prediction into the design of patrol districts, the SNPDP model has practical implications and would improve the efficiency of policing operations.
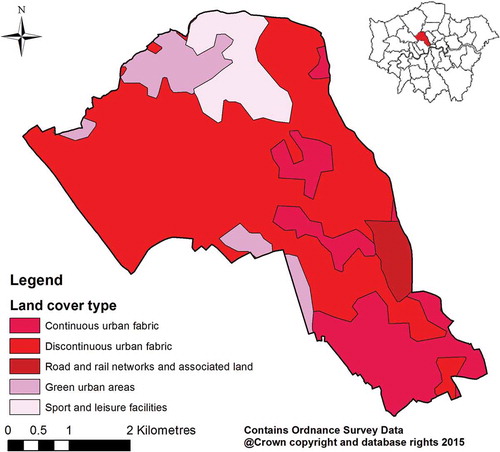
In this study, the Integrated Transport Network data was provided by Ordnance Survey via its MasterMap product (Ordnance Survey Citation2015). This borough includes 5575 street segments, with an average length of 62 m, the maximum 800 m and 82% of the lengths less than 100 m. Although link segmentation (that divides the links into approximately equal size) is common in network-based analysis (Xie and Yan Citation2008, Yamada and Thill Citation2010), it was not conducted as part of this study, as equal link size is not required for the districting task, and most of the streets have acceptable lengths. The street-level crime risk data was computed using the network-time kernel density estimation model (Rosser et al. Citation2017) and the historical burglary crime records (). shows the Corine land cover map of Camden (Cole et al. Citation2015), which is used to interpret the characteristics of different patrol districts.
Figure 3. The predicted burglary crime risk in Camden. Levels of 1–4 denote the crime risk from low to high.
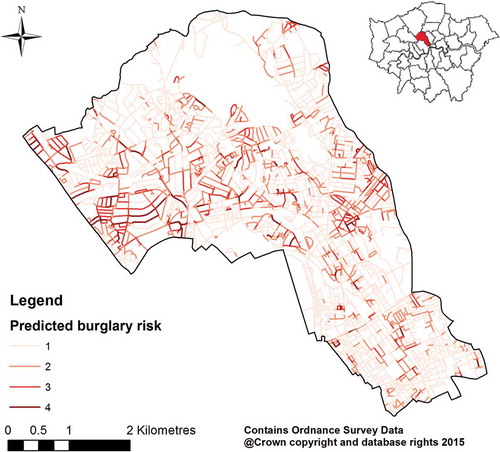
Figure 4. The 2012 Corine land cover map of Camden.
5.3. Results and discussion
In the case study, first, the GP–TS and RG–TS were used to produce districts in Camden, and their efficiency and solution quality were compared. Second, the best districting solution was focused on, and the characteristics of each district were interpreted. Third, the aggregate grid-based model was formulated, using different cell sizes, and the aggregation error was discussed. Finally, it was demonstrated how to achieve the different degrees of trade-offs between efficiency and balance in the SNPDP.
The configuration of the TS is the same as for the optimality analysis. Similar to the optimality analysis, ,
and
are set to 0.333, and
is set to 0.5. In operations, the weight values would be determined by the practitioners and experts. The number of districts is set to six so that each district is of moderate size.
shows the computational results from the GP–TS and RG–TS for the SNPDP in Camden. To produce an initial solution, the GP and RG procedure took 30 and 298 s, respectively, meaning that the GP is considerably more efficient than the RG. The best and the average objective values obtained by GP–TS are significantly superior to those by RG–TS. The results demonstrate the advantages of GP–TS over RG–TS for large problems.
Table 2. Computational results of GP–TS and RG–TS for the SNPDP in Camden.
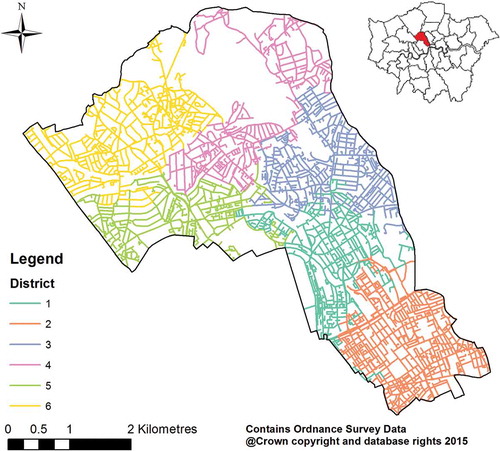
shows the district map with the best districting plan, and presents the values of the attributes and workloads for each district. The six districts have different characteristics, which are dependent on the ambient crime risk and land use types. In south Camden, the dominant land cover is ‘Continuous urban fabric’, meaning that more than 80% of the total surface is covered by buildings, roads and artificially surfaced areas. This part is largely used for education, transport and business. Accordingly, Districts 1 and 2 in this area have the larger accumulative street length than the other districts. In contrast, the north Camden is dominated by ‘Green urban areas’ and ‘Sport and leisure facilities’, and this is where the large green space, Hampstead Heath, is situated. Consequently, District 4 includes sparse streets and has the largest diameter. Moreover, in northwest Camden, District 5 features the highest crime risk score, which can be explained by a cluster of high crime risk streets (see ). The different signatures of the districts may have practical implications for targeted policing.
Table 3. A summary of the best solution using GP–TS.
Figure 5. The best districting solution for Camden.
Moreover, the SNPDP was compared against the aggregation models in generating districting plan on streets. In the aggregation models, varying cell sizes were selected, including 100, 150, 200 and 250 m, in order to study the effects of cell size. These cell sizes were chosen to reflect a reasonable patrol unit for police, and they are on the same scale as a case study on crime hotspot prediction in the same region (Adepeju et al. Citation2016). For each cell size, the grid-based districting problem was formulated and solved by the GP–TS heuristic to produce 10 solutions, which were then transformed to form street solutions.
compares the results of SNPDP and the aggregation models using varying cell sizes. The best solution from the previous SNPDP experiments was considered as the benchmark. The unit number (i.e. problem size) of the districting problem decreases dramatically as the cell size increases. As a smaller districting problem has fewer feasible moves to test in each iteration, the average number of iterations by the TS increases with the decrease of problem size, given the same computation time. For all cell sizes, none of the street solutions that are directly transformed from the grid solutions is contiguous. The relative gap from the street districting solutions to the benchmark solution is computed. The quality of the best solution decreases as the cell size increases, indicating that a small cell size leads to a small aggregation error. The best solution obtained by the model of 100-metre cell size is close to that by SNPDP, with a gap of 1.68%. On average, solutions obtained by SNPDP are better than the aggregation models, except for the model of 100-metre cell size. However, the aggregation model requires several extra steps of data pre-processing and solution transformation. The results confirm that the best solution of the SNPDP outperforms those of the aggregation models.
Table 4. Computational results of two modelling approaches with varying cell size.
Furthermore, different degrees of trade-offs between efficiency () and balance (
) in SNPDP can be achieved via varying the weight coefficient
To evaluate the balance in a districting solution, two measures are used: first, the average deviation, AvgDev, is defined as
, which is the second term in Equation (1); second, the maximum deviation, MaxDev, is defined as:
. The annotations are consistent with Equations (1)–(15). A smaller value of AvgDev or MaxDev implies the more balanced workload distribution in the solution.
Experiments were conducted with the ranging from 0.1 to 0.9 with a step length of 0.1. shows how the workload average and deviation in the best solution change with
. Obviously, the workload average decreases steadily with the increase of
, while the AvgDev and MaxDex increases steadily with the increasing
, when the
is smaller than 0.7. The results shows the ability of the SNPDP model to achieve varying degrees of trade-offs between the two objectives.
Table 5. Results of workload average and deviation in the best solution using different values.
6. Conclusions
In this study, the SNPDP model is proposed. This is a novel approach to incorporating the street network structure and street-level predictive crime risk into the design of police districts. This model is multi-criteria-based, in that the objectives include the efficiency and balance of the district workload, and the workload is a combination of the crime risk, area size and district diameter.
To efficiently solve large cases of the SNPDP, a combined heuristic Graph-Partition-Tabu-Search was developed. In comparison with solutions found by an exact solver (GUROBI), the GP–TS is capable of producing high-quality solutions quickly for the SNPDP.
The SNPDP model was successfully tested in the case study of Camden, generating efficient and balanced patrol districts. The results confirm the advantages of the GP–TS over an existing heuristic RP-TS, with respect to the computation time and solution quality. Moreover, the superior capability of the SNPDP model is supported by comparison with an aggregation grid-based model, in terms of solution quality. The different characteristics of the patrol districts can be identified through a combination of the crime risk distribution and the land use map, and the results can guide the planning of policing strategy.
Putting a street-based district design into police operations has both several advantages and certain limitations. The main advantage is that it incorporates the street network and the street-level predictive crime risk, and ensures a workload balance. Moreover, each district is guaranteed to be well connected in the street network. Therefore, it is expected to enhance the efficiency of patrol planning and emergency response. However, several limitations exist regarding the incorporation of census data and police activities that occur off the streets. First, as the street segments are incompatible with the current census units (e.g. census block, output area), it is difficult to carry out demographic research in a district consisting of streets. Second, while most of the police activities take place on the street or near the street, there are situations in which police deviate from the street network, such as carrying out tasks in an area, such as a large green space, that has no streets.
This study opens up avenues for future research. First, this study proposes street-based and grid-based models to solve districting problems with edge demands, and offers a simple approach to comparing the solution quality. It would be useful to compare the two models systematically, and to quantify the associated aggregation errors. Second, the street-based district design could be improved in certain ways so as to incorporate census data and off-street police activities. One possible approach would be to transform the districts into area-based districts, whilst preserving the workload balance and the connectivity of the new districts.
Acknowledgments
This work is part of the Crime, Policing and Citizenship (CPC): Space-Time Interactions of Dynamic Networks Project (www.ucl.ac.uk/cpc), supported by the UK Engineering and Physical Sciences Research Council (EP/J004197/1). This work is supported in part by the PhD scholarship from the China Scholarship Council (CSC) under the Grant CSC No. 201406010296 and the BEAMS Dean’s Prize from University College London.
The authors would like to acknowledge the Metropolitan Police Service (MPS) for provision of the crime data in the London Borough of Camden. They are also grateful to Trevor Adams for many valuable discussions about the manuscript and related work. The results presented and views expressed in this manuscript are the responsibility of the authors alone and do not represent the views of Trevor Adams or the MPS.
The authors would like to thank the editors Dr. May Yuan and Dr Sytze de Bruin, and three anonymous referees for their valuable comments and suggestions.
Disclosure statement
No potential conflict of interest was reported by the authors.
Additional information
Funding
Notes on contributors
Huanfa Chen
Huanfa Chen is a PhD candidate in Geographic Information Science at Department of Civil, Environmental and Geomatic Engineering, University College London. His research interest includes Geocomputation, spatial optimisation, space-time modelling and agent-based simulation with applications in crime, transport and social media.
Tao Cheng
Tao Cheng is a professor in Geoinformatics at Department of Civil, Environmental and Geomatic Engineering, University College London. She is the Founder and Director of SpaceTimeLab for Big Data Analytics. Her research interests include network complexity, Geocomputation, space-time analytics and Big data mining (modelling, prediction, clustering, visualisation and simulation) with applications in transport, crime, health, social media, and natural hazards.
Xinyue Ye
Xinyue Ye is an associate professor at Department of Informatics, New Jersey Institute of Technology. His research interests include space-time analysis, regional science, and new economic geography. He integrates social science and computational science towards information visualisation, urban informatics and spatial social network analysis – the mapping of relationships among individuals in networks, integrated with spatial and environmental factors.
Related Research Data
References
- Adepeju, M., Rosser, G., and Cheng, T., 2016. Novel evaluation metrics for sparse spatio-temporal point process hotspot predictions – a crime case study. International Journal of Geographical Information Science, 30 (11), 2133–2154. doi:10.1080/13658816.2016.1159684
- Blais, M., Lapierre, S.D., and Laporte, G., 2003. Solving a home-care districting problem in an urban setting. Journal of the Operational Research Society, 54 (11), 1141–1147. doi:10.1057/palgrave.jors.2601625
- Blum, C. and Roli, A., 2003. Metaheuristics in combinatorial optimization: overview and conceptual comparison. ACM Computing Surveys, 35 (3), 189–213. doi:10.1145/937503.937505
- Bodily, S.E., 1978. Police sector design incorporating preferences of interest groups for equality and efficiency. Management Science, 24 (12), 1301–1313. doi:10.1287/mnsc.24.12.1301
- Bozkaya, B., Erkut, E., and Laporte, G., 2003. A tabu search heuristic and adaptive memory procedure for political districting. European Journal of Operational Research, 144 (1), 12–26. doi:10.1016/S0377-2217(01)00380-0
- Butsch, A., Kalcsics, J., and Laporte, G., 2014. Districting for arc routing. INFORMS Journal on Computing, 26 (4), 809–824. doi:10.1287/ijoc.2014.0600
- Camacho-Collados, M., Liberatore, F., and Angulo, J.M., 2015. A multi-criteria police districting problem for the efficient and effective design of patrol sector. European Journal of Operational Research, 246 (2), 674–684. doi:10.1016/j.ejor.2015.05.023
- Caro, F., et al., 2004. School redistricting: embedding GIS tools with integer programming. Journal of the Operational Research Society, 55 (8), 836–849. doi:10.1057/palgrave.jors.2601729
- Carroll, J.M. and Laurin, P.G., 1981. Using simulation to assign police patrol zones. Simulation, 36 (1), 1–12. doi:10.1177/003754978103600102
- Cirincione, C., Darling, T.A., and O’Rourke, T.G., 2000. Assessing South Carolina’s 1990s congressional districting. Political Geography, 19 (2), 189–211. doi:10.1016/S0962-6298(99)00047-5
- Clarke, S. and Surkis, J., 1968. An operations research approach to racial desegregation of school systems. Socio-Economic Planning Sciences, 1, 259–272. doi:10.1016/0038-0121(68)90014-1
- Cole, B. et al., 2015. Corine land cover 2012 for the UK, Jersey and Guernsey.
- Cova, T. and Church, R., 2000. Contiguity constraints for single-region site search problems. Geographical Analysis, 32 (4), 306–329. doi:10.1111/j.1538-4632.2000.tb00430.x
- Curtin, K.M., et al., 2005. Integrating GIS and maximal covering models to determine optimal police patrol areas. InGeographic Information Systems and Crime Analysis, Hershey: IGI Global, 214–235.
- Curtin, K.M., Hayslett-McCall, K. & Qiu, F., 2010. Determining optimal police patrol areas with maximal covering and backup covering location models. Networks and Spatial Economics, 10 (1), 125–145.
- D’Amico, S.J., et al., 2002. A simulated annealing approach to police district design. Computers and Operations Research, 29 (6), 667–684. doi:10.1016/S0305-0548(01)00056-9
- Davies, T. and Johnson, S.D., 2015. Examining the relationship between road structure and burglary risk via quantitative network analysis. Journal of Quantitative Criminology, 31 (3), 481–507. doi:10.1007/s10940-014-9235-4
- Davies, T.P. and Bishop, S.R., 2013. Modelling patterns of burglary on street networks. Crime Science, 2 (1), 10. doi:10.1186/2193-7680-2-10
- Duque, J.C., Anselin, L., and Rey, S.J., 2012. The max-p-regions problem. Journal of Regional Science, 52 (3), 397–419. doi:10.1111/jors.2012.52.issue-3
- Duque, J.C., Ramos, R., and Suriñach, J., 2007. Supervised regionalization methods: a survey. International Regional Science Review, 30 (3), 195–220. doi:10.1177/0160017607301605
- Floyd, R.W., 1962. Algorithm 97: shortest path. Communications of the ACM, 5 (6), 345. doi:10.1145/367766.368168
- Francis, R.L., et al., 2009. Aggregation error for location models: survey and analysis. Annals of Operations Research, 167 (1), 171–208. doi:10.1007/s10479-008-0344-z
- Galvão, L.C., et al., 2006. A multiplicatively-weighted Voronoi diagram approach to logistics districting. Computers and Operations Research, 33 (1), 93–114. doi:10.1016/j.cor.2004.07.001
- Garey, M.R. and Johnson, D.S., 1979. Computers and Intractability: A Guide to the Theory of NP-Completeness. New York: Freeman.
- Hess, S.W. and Samuels, S.A., 1971. Experiences with a sales districting model: criteria and implementation. Management Science, 18 (4 (Part II)), P41–P54. doi:10.1287/mnsc.18.4.P41
- Jiang, B. and Claramunt, C., 2004. Topological analysis of urban street networks. Environment and Planning B: Planning and Design, 31 (1), 151–162. doi:10.1068/b306
- Johnson, S. and Bowers, K., 2014. Near Repeats and Crime Forecasting. In Encyclopedia of Criminology and Criminal Justice. New York: Springer-Verlag New York Inc., 3242–3254.
- Kalcsics, J., 2015. Districting Problems. In Location Science. Berlin: Springer International Publishing, pp. 595–622.
- Kistler, A., 2009. Tucson police officers redraw division boundaries to balance their workload. Geography & Public Safety, 1 (4), 3–5.
- Liberatore, F. and Camacho-Collados, M., 2016. A comparison of local search methods for the multicriteria police districting problem on graph. Mathematical Problems in Engineering, 2016, 1–13. doi:10.1155/2016/3690474
- Mitchell, P.S., 1972. Optimal selection of police patrol beats. Journal of Criminal Law, Criminology & Police Science, 63 (4), 577–584. doi:10.2307/1141814
- Openshaw, S., 1984. The modifiable areal unit problem. Norwich: Geo Books.
- Openshaw, S. and Rao, L., 1995. Algorithms for reengineering 1991 Census geography. Environment and Planning A, 27 (3), 425–446. doi:10.1068/a270425
- Openshaw, S. and Taylor, P.J., 1979. A million or so correlation coefficients: Three experiments on the modifiable areal unit problem. In Statistical Methods in the Spatial Sciences, London: The Royal Geographical Society (with the Institute of British Geographers), 127–144.
- Porta, S., Crucitti, P., and Latora, V., 2006a. The network analysis of urban streets: a dual approach. Physica A: Statistical Mechanics and Its Applications, 369 (2), 853–866. doi:10.1016/j.physa.2005.12.063
- Porta, S., Crucitti, P., and Latora, V., 2006b. The network analysis of urban streets: a primal approach. Environment and Planning B: Planning and Design, 33 (5), 705–725. doi:10.1068/b32045
- Ricca, F. and Simeone, B., 2008. Local search algorithms for political districting. European Journal of Operational Research, 189 (3), 1409–1426. doi:10.1016/j.ejor.2006.08.065
- Rosser, G., et al., 2017. Predictive crime mapping: arbitrary grids or street networks? Journal of Quantitative Criminology, 33(3), 569–594..
- Salazar-Aguilar, M.A., Ríos-Mercado, R.Z., and Cabrera-Ríos, M., 2011. New models for commercial territory design. Networks and Spatial Economics, 11 (3), 487–507. doi:10.1007/s11067-010-9151-6
- Sanders, P. and Schulz, C., 2012. Distributed evolutionary graph partitioning. Proceedings of the Meeting on Algorithm Engineering & Experiments, 16–29.
- Sarac, A., et al., 1999. Reconfiguring police reporting districts in the city of Buffalo. OR Insight, 12 (3), 16–24. doi:10.1057/ori.1999.12
- Schoepfle, O.B. and Church, R.L., 1991. A new network representation of a “classic” school districting problem. Socio-Economic Planning Sciences, 25 (3), 189–197. doi:10.1016/0038-0121(91)90017-L
- She, B., et al., 2015. Weighted network Voronoi Diagrams for local spatial analysis. Computers, Environment and Urban Systems, 52, 70–80. doi:10.1016/j.compenvurbsys.2015.03.005
- She, B., Duque, J.C., and Ye, X., 2017. The network-max-P-regions model. International Journal of Geographical Information Science, 31 (5), 962–981. doi:10.1080/13658816.2016.1252987
- Summers, L. and Johnson, S.D., 2017. Does the configuration of the street network influence where outdoor serious violence takes place? Using space syntax to test crime pattern theory. Journal of Quantitative Criminology, 33 (2), 397–420. doi:10.1007/s10940-016-9306-9
- Survey, O., 2015. OS mastermap integrated transport network layer. Available from: https://www.ordnancesurvey.co.uk/business-and-government/products/itn-layer.html [Accessed November 14, 2017].
- Thomas, J.W., 1979. Techniques for defining geographic boundaries for health regions. Socio-Economic Planning Sciences, 13 (6), 321–326. doi:10.1016/0038-0121(79)90013-2
- Tong, D., Murray, A., and Xiao, N., 2009. Heuristics in spatial analysis: a genetic algorithm for coverage maximization. Annals of the Association of American Geographers, 99 (4), 698–711. doi:10.1080/00045600903120594
- Vickrey, W.S., 1961. On the prevention of gerrymandering. Political Science Quarterly, 76 (1), 105–110. doi:10.2307/2145973
- Xie, Z. and Yan, J., 2008. Kernel density estimation of traffic accidents in a network space. Computers, Environment and Urban Systems, 32 (5), 396–406. doi:10.1016/j.compenvurbsys.2008.05.001
- Yamada, I. and Thill, J.-C., 2010. Local indicators of network-constrained clusters in spatial patterns represented by a link attribute. Annals of the Association of American Geographers, 100 (2), 269–285. doi:10.1080/00045600903550337
- Zhang, Y. and Brown, D.E., 2013. Police patrol districting method and simulation evaluation using agent-based model & GIS. Security Informatics, 2 (1), 7. doi:10.1186/2190-8532-2-7