
 ?Mathematical formulae have been encoded as MathML and are displayed in this HTML version using MathJax in order to improve their display. Uncheck the box to turn MathJax off. This feature requires Javascript. Click on a formula to zoom.
ABSTRACT
The spatial analysis of social media data has recently emerged as a significant source of knowledge for urban studies. Most of these analyses are based on an areal unit that is chosen without the support of clear criteria to ensure representativeness with regard to an observed phenomenon. Nonetheless, the results and conclusions that can be drawn from a social media analysis to a great extent depend on the areal unit chosen, since they are faced with the well-known Modifiable Areal Unit Problem. To address this problem, this article adopts a data-driven approach to determine the most suitable areal unit for the analysis of social media data. Our multicriteria optimization framework relies on the Pareto optimality to assess candidate areal units based on a set of user-defined criteria. We examine a case study that is used to investigate rainfall-related tweets and to determine the areal units that optimize spatial autocorrelation patterns through the combined use of indicators of global spatial autocorrelation and the variance of local spatial autocorrelation. The results show that the optimal areal units (30 km2 and 50 km2) provide more consistent spatial patterns than the other areal units and are thus likely to produce more reliable analytical results.
1. Introduction
Over the past few years, researchers have used social media data as a data source to study several types of human activities and physical phenomena. Given the widespread usage of social media in cities, the analysis of social media activity is considered particularly promising in the emerging field of urban analytics (Singleton et al. Citation2018). Geospatial data extracted from social media is able to give an insight into the dynamic patterns of urban environments and urban life in higher spatial and temporal resolutions than has so far been made possible by conventional data sources (e.g. census data and field surveys) (Batty Citation2013). In line with this approach, researchers have used georeferenced social media data to study several key areas, such as the detection, monitoring and recognition of natural disasters (e.g. earthquakes, typhoons, and floods) and humanitarian crises (e.g. outbreaks of epidemic diseases), as well as to tackle urban planning problems (e.g. traffic jams) – for an overview of this literature, see Nummi (Citation2017), Martínez-Rojas et al. (Citation2018), Martí et al. (Citation2019), and Steiger et al. (Citation2015a).
A common strategy employed in this literature is to assess the intensity of social media activity around a topic and then use this as a proxy signal that is capable of revealing the spatio-temporal distribution of an urban phenomenon of interest, i.e. these studies assume there is a correlation between the aggregated, thematic social media activity in an areal unit and a given spatio-temporal process. This has proven to be a fruitful approach to study natural phenomena, such as flooding (de Albuquerque et al. Citation2015, Kryvasheyeu et al. Citation2016, Smith et al. Citation2017, Rosser et al. Citation2017, Restrepo-Estrada et al.Citation2018, Li et al. Citation2018, Arthur et al. Citation2018), as well as social processes, such as geodemographic patterns (Steiger et al. Citation2015b, Longley and Adnan Citation2016, Patel et al. Citation2017). However, in establishing the relationship between social media activity and a given real-world spatio-temporal process, the analyst often has to make a decision about which areal unit of aggregation to use. This decision is unavoidably related to the classic and well-studied problems of ecological fallacies and the so-called Modifiable Areal Unit Problem (MAUP) (Openshaw Citation1984, Fotheringham Citation1989, Dark and Bram Citation2007). The choice of an areal unit of analysis may be even more complex in social media research than in other areas, since the uneven distribution of social media activity across the urban space is caused by bias in the production practices of social media users and varies in different types of social media platforms (Rzeszewski Citation2018). The relationships between the spatio-temporal processes which govern social media activities and spatio-temporal phenomena of interest are poorly understood. The question of which spatial granularity should be used in social media analysis is thus riddled with uncertainty, as the analyst will often be unsure about how to match the areal unit of analysis to the scale of the phenomena being analyzed.
In view of the potentially serious effects of MAUP on social media research and the uncertainty it arouses, it is surprising that investigations into the effects of MAUP on social media analytics have so far received scant attention. However, whilst most previous studies failed to carry out any investigation into the effects of MAUP or justify their areal unit choices, there have recently been a number of studies that either explicitly address or avoid the issues of MAUP (Jiang and Miao Citation2015, Lee et al. Citation2016). However, these studies are mostly based on a single criterion (e.g. global measures of spatial association), and fail to adopt a generic approach that takes account of a number of other criteria, such as the need to identify significant local spatial patterns.
This article puts forward a systematic approach to support the analyst in investigating the degree of sensitivity to MAUP effects and choosing the most appropriate spatial granularity for a specific application case study. It establishes a multicriteria optimization framework to assist in the selection of the areal unit in social media analysis, which is based on the definition of a number of criteria (e.g. global and local indicators of spatial association) and the application of the Pareto optimality method. Pareto optimality has been widely used to assess a number of alternative solutions in problems that involve multiple criteria, and where a solution that is regarded as optimal for one criterion may not be for another. Multiple conflicting criteria can thus be evaluated to answer questions such as the following: How can we ensure that the optimal spatial unit chosen suitably characterizes or represents the spatial process in accordance with a number of given criteria? What is the optimal spatial unit that should be used when there are multiple and conflicting criteria? This multicriteria framework is applied to investigate the effects of different areal units on the analysis of heavy rainfall patterns by means of Twitter data in the city of Sao Paulo, Brazil.
The remainder of the article is structured as follows: Section 2 provides an overview of the literature on the effects of MAUP on social media analyses; Section 3 outlines the multicriteria optimization framework for the selection of an appropriate spatial unit in social media analysis; Section 4 describes a case study on the use of social media as a proxy for heavy rainfall patterns; Sections 5 and 6 report the main results and conduct a discussion on the findings; finally, Section 7 presents the conclusions and makes suggestions for future studies.
2. MAUP in social media analysis
The spatial approach to social media analysis often involves aggregating messages to a study area which has been partitioned into areal units that vary in size, from square meters to square kilometers, and shape, such as regular and irregular polygons. This kind of spatial arrangement for data aggregation is sensitive to the scale and zoning effects of MAUP, which can yield very different spatial patterns and statistical results owing to uncertainty about the number (scale effect) and shape (zoning effect) of the areal units (Openshaw Citation1977, Citation1978, Citation1984, Fotheringham Citation1989, Dark and Bram Citation2007).
Figure 1. Scale and zoning effects for spatial data aggregation (based on Lee et al. Citation2016). (a) corresponds to a sample of spatial data at an individual level bounded to a study area, (b) is the spatial count data using a reference lattice design, (c) and (d) illustrate the scale and zoning effects, respectively
shows the influence of the scale and zoning effects of MAUP for spatial data aggregation in a given study area. Clearly, the density patterns reported for any one particular areal unit () could be highly misleading if taken as representative of the sample of spatial data bounded to the study area (). For example, the densities of spatial data across the vertical arrangement in varies considerably when compared with the constant densities across the horizontal arrangement. A similar behavior can be seen in , where the low density appears on horizontally opposite sides when the two spatial arrangements are looked at together. It is widely recognized that, different conclusions can be drawn about the underlying statistical relationships depending on the choice of an areal unit of analysis (Fotheringham Citation1989). As a result, if no systematic criteria are used for the assessment of the effects of MAUP and for the choice of an areal unit of analysis, this may lead to the data being aggregated in a biased and mistaken zoning system.
Although it is widely regarded as a problem that is inherent to spatial analysis, the literature provides some possible strategies for dealing with MAUP (Fotheringham Citation1989, Dark and Bram Citation2007). These include the following: (i) the derivation of an ‘optimal’ zoning system where a hypothesis concerning the expected results can be attained (e.g. Openshaw Citation1977, Openshaw and Rao Citation1995), (ii) the identification of basic entities and primitive areal units as a means of avoiding the use of data aggregation (e.g. Jiang and Brandt Citation2016), (iii) the development of new methods that lay greater emphasis on visualisation than statistical analysis (e.g. Tobler Citation1989), (iv) the emphasis of spatial analysis on the rates of change (e.g. Fotheringham Citation1989, Poorthuis Citation2018), and (v) the sensitivity analysis that examines the effects of MAUP by reporting the results for different areal units (e.g. Fotheringham and Wong Citation1991). Although previous approaches have proved effective in understanding and addressing MAUP, they tended to deal with special cases of a general problem and should be applied with some caution – depending on the project and type of analysis (Dark and Bram Citation2007).
MAUP is often ignored in social media analytics and empirical studies involving the analysis of areal data rarely mention possible scale and zoning effects. This is especially true in urban analytics that use social media data around a topic to mirror real-world spatio-temporal phenomena – for some examples, see Tenkanen et al. (Citation2017), Restrepo-Estrada et al. (Citation2018), Arthur et al. (Citation2018) and Longley and Adnan (Citation2016). However, there have recently been a number of studies that clearly address the question of MAUP. For example, Jiang and Miao (Citation2015) delineated urban boundaries of cities by means the topology of social media activity. They used the heterogeneity of the hierarchical agglomerations of social media activity to determine the urban structure, which may mitigate the statistical bias of MAUP. However, this work does not make a systematic assessment of MAUP effects to provide evidence of improvements achieved by its selection strategy for the spatial unit of analysis. In contrast, Lee et al. (Citation2016) assessed the scale effect of MAUP through the rate of change of an indicator of global spatial association (Global Moran’s I) using regular grid lattices with different areal unit sizes. Analogously to a previous work in the segmentation of high resolution remotely sensed images (Meng et al. Citation2014), Lee et al. (Citation2016) proposed to select the areal unit of analysis based on the lattice layout that yields the higher Global Moran’s I coefficient.
Although the use of global indicators of spatial association for a sensitivity analysis has proved to be a useful way of investigating MAUP effects, this method only considers the overall clustering patterns of georeferenced social media data, whilst the spatial variance or structural instability of local patterns have been neglected. Global Moran’s I coefficient alone may not be enough to diagnose the spatial heterogeneity of social media activity, particularly in study areas partitioned into a large number of areal units of analysis. One of the reasons for this is that global patterns of spatial association usually assume spatial homogeneity (Anselin Citation1995) and social media activity is often dispersed in space, irregular in time, and uncertain in content. Moreover, local spatial patterns may be of particular relevance in urban analytics due to the intra-urban inequalities that influence a user-data generation. As a result, social media activity is often associated with a low/medium spatial dependence (i.e. a degree of spatial association) and a high level of spatial heterogeneity. Thus, the investigation of the effects of MAUP should take account of other indicators, such as the spatial heterogeneity of the process in a study area.
An example which takes the structural instability of the local patterns into account is given in . Each lattice () is related to a global indicator of spatial association and the standard deviation (i.e. spatial variance) of the local indicators of spatial association. These spatial association statistics were calculated by means of Global Moran’s I coefficient and its local version. According to Anselin (Citation1995), local indicators of spatial association (LISA) are spatial decomposition statistics of global indicator of association that enable the identification of spatial outliers and make an assessment of the overall structural (in)stability, which is useful for an analysis of spatial heterogeneity. If the underlying process is stable throughout the lattice, the local indicators are expected to show a constant statistical behavior at the areal unit chosen.
As shown in , spatial variance changes considerably and a high Global Moran’s I does not necessarily yield a low standard deviation of Local Moran’s I, i.e. the choice of the most suitable lattice should be bi-dimensional in terms of global and local statistics. Hence, the spatial heterogeneity analysis is of value for assessing the extent to which a global indicator is representative of the local association (Anselin Citation1995) and measuring the conflict between spatial stability and the global indicator of association. This kind of trade-off can occur in any spatial data analysis, including urban social media analytics in different periods and areal units.
Figure 2. Trade-off between Global Moran’s I and the overall degree of structural (in)stability (standard deviation) of Local Moran’s I. It should be noted the difference when compared to the trends of the standard deviation of Local Moran’s I and Global Moran’s I across the lattices. Standard deviation of the Local Moran’s I was normalized by scaling between the minimum and maximum values of the Global Moran’s I. Both statistics were computed for a row-standardized spatial weights matrix based on first-order rook contiguity
In summary, the determination of an optimal areal unit for spatial analysis of social media data is a complex task owing to the MAUP effects, differences in the fields of application, and uncertainties and conflicts arising from the different potential spatial indicators to be used. Since a global (or singular) optimal areal unit cannot be determined, the approach we adopt to address this problem is to enable the assessment of various different areal units by multiple indicators in order to subsequently support the selection of an optimal areal unit, depending on the application and determination of the spatial analysts.
3. Multicriteria optimization framework
shows the multicriteria optimization framework established by a Multi-Criteria Decision Analysis (MCDA) for the choice of an optimal areal unit in spatial data analysis, which focuses on studies involving the social mirroring of real-world phenomena derived from social media activity. MCDA is a discipline that provides a systematic and generalized way of dealing with decision problems, by assisting decision-makers to choose an appropriate and satisfactory solution from a finite set of candidate or alternative (Xu Citation2012, Greco et al. Citation2016). According to Xu (Citation2012), MCDA ‘refers to making decisions in the presence of multiple, usually conflicting, criteria’. As argued in Section 2, the choice of an areal unit in social media analysis related to real-world phenomena is closely linked to the evaluation of conflicting indicators or criteria. Hereinafter, the words indicators and criteria will be used interchangeably in the context of MCDA.
Figure 3. Methodological multicriteria optimization framework for the selection of an optimal areal unit in a spatial data analysis
3.1. Modelling of candidate areal units
An MCDA problem can be modeled by a bidimensional decision matrix in which each element (cell) represents the outcome of a measure against a criterion (column) and corresponds to a particular decision – also referred to as a candidate solution (line). The number of criteria and candidate solutions is unlimited; however, both can be reduced if knowledge is drawn from the project topic and type of analysis. In problems concerning urban analytics, this means choosing a range of areal units that are geographically meaningful, and spatial statistics that make sense to the problem/analysis in hand – the analyst should reduce the search space of the candidate areal units within the multicriteria optimization framework.
In general, the establishment of criteria depends on the problem, and no set rule is followed. We assessed the areal units in social media on the basis of two criteria, namely Global Moran’s I and the coefficient of variation of Local Moran’s I. The former relies on the spatial aspects of a global social media activity (i.e. the average of the overall spatial patterns), whereas the latter measures the overall instability through local inequalities (i.e. the variance of the local spatial patterns). These spatial statistics can be calculated by means of different schemes of spatial contiguity and spatial weight matrices, but we computed them for a row-standardized spatial weights matrix based on first-order rook contiguity (i.e. adjacent neighbors) – since the first-order rook makes sense for our case study (i.e. the mapping of a continuous phenomena) and the results remained stable across different schemes of spatial weights matrix. The coefficient of variation was used to summarize the Local Moran’s I, rather than the standard deviation, since it allows direct quantitative comparisons to be made between different probability distributions, i.e. comparisons between spatial variances of Local Moran’s I across different areal units.
3.2. Evaluation of the candidate areal units
Although the MCDA methods share similar modelling procedures (i.e. stages in an organization and decision matrix construction), they synthesize and optimize the criteria, and calculate the decision matrix differently (Greco et al. Citation2016). Hence, selecting a particular MCDA method depends on the characteristics of a given problem. Collette and Siarry (Citation2004) and Greco et al. (Citation2016) provide a review of the well established and recently emerging fields, theories and methods within MCDA, which assist the readers in linking problems to methods. We have selected the Pareto optimality algorithm available in rPref package (Roocks Citation2016), which is a dominance-based method. In general, it sorts the candidate solutions into Pareto frontiers based on all the trade-offs of the criteria and leaves the selection of a preferred candidate solution free for the decision-maker. Frontiers are cutting points that group the candidate solutions into ordered classes that range from the best (first frontier) to worst (last frontier). All the candidate solutions that fall into the same frontier are considered to be interchangeable. The so-called Pareto-optimal solutions are those that fall into the first frontier, which are assumed by the method to be the most suitable solutions.
3.2.1. Pareto optimality method
Let be a set of user-defined areal units with different levels of aggregation. Each spatial granularity of aggregation
is characterized by different criteria that will be optimized by a set of objective functions. A vector containing
objective functions
can be represented by
A Pareto-optimal solution only contains areal units that are not Pareto-dominated by any other areal unit. More formally, but still in general terms, an areal unit dominates another
when it has satisfied the following two constraints:
(i) , and
(ii)
where and
correspond to the ‘general better’ and ‘better or equal’ relations, depending on whether the objective function refers to maximization or minimization. All the Pareto-optimal areal units form the first Pareto Frontier and if two or more areal units fall into it, additional human expertise is required for the selection of a proper areal unit. As mentioned above, all the areal units in the first Pareto Frontier are considered to be equally ‘good’. The other frontiers are calculated in the same way, although the areal units of the previous frontiers are removed (e.g. the second frontier is calculated by removing the areal units of the first frontier, the third frontier is calculated by removing the areal units of the first and second frontiers, and so on).
3.3. Sensitivity analysis of the optimal areal units
Once the first frontier has been obtained, the robustness of its solutions must be evaluated. Within the context of MCDA, a sensitivity analysis is a common approach for investigating the statistical robustness of Pareto-optimal solutions (Grunert da Fonseca et al. Citation2001). A practical way of carrying this out, it is to check the stability of the outcomes obtained from multiple runs of the Pareto optimality algorithm. Random resampling or disturbances from the original data should be introduced to give an idea of how stable (i.e. robust) the Pareto-optimal solutions in each run tend to be. In line with this approach, we applied a bootstrap method since this has been widely recognized as a good asymptotic resampling approach in different contexts (Efron Citation1979).
shows the bootstrap resampling strategy used to generate samples of spatial data; it uses blocks of data to partially ‘retain’ the original spatial properties. Each block corresponds to an event/occurrence of a particular phenomenon and shares a set of data (e.g. rain-related social media messages on a rainy day). In this work, an event is understood to be a measurement/observation of an observed phenomenon within a study area (e.g. daily or hourly observations of rainfall in a city). Hence, a resampling of events (i.e. sets of social media data grouped into time units) were generated to perform the sensitivity analysis.
Figure 4. Bootstrap resampling strategy with a set of spatial data grouped into regular time units called events. corresponds to spatial data at an individual level spread over a study area (e.g. social media messages across the city of Sao Paulo)
4. Application of the multicriteria optimization framework
4.1. Case study in the context of heavy rain in Sao Paulo city, Brazil
The multicriteria optimization framework was employed for the selection of the optimal areal unit in a social media analysis within the context of heavy rainfall patterns in Sao Paulo city, Brazil. The city was chosen because heavy rain events cause flash floods, inundations and flooding, mainly due to the rivers overflowing and the poor drainage system of the urban pavements. It should also be noted that, Sao Paulo has a vast number of Twitter users and an estimated population of approximately 12 million people, which has made it the most density populated city in Brazil (IBGE Citation2010).
The entire surface area of the city was partitioned into hexagonal areal units of 5 km2, ranging from 10 to 100 km2 every 10 km2, and 200 km2. Each spatial unit aggregated rainfall data and rain-related Twitter messages over the period of 1 year, from November 2016 to November 2017. This range of areal units allowed us to determine the trade-off between the Global Moran’s I and the coefficient of variation of Local Moran’s I for a specific application case, while the hexagonal areal units reduced the visual field bias when compared with the square units (Carr et al. Citation1992).
4.2. Description of the data
4.2.1. Twitter data
We used the Twitter Streaming API to fetch public geotagged tweets that fell within Sao Paulo city. Although the methods employed by Twitter Streaming API for sampling data are unknown, they return a large enough set of geotagged tweets from the Twitter population (Morstatter et al. Citation2013). 2,073,219 geotagged tweets were sampled during the entire period of analysis. Although we examined a large and dense dataset, the geotagged tweets related to rain represented a small fraction (5,996/0.29%) of the total number. A low percentage of phenomenon-related geotagged tweets was also observed in other studies on crises and natural disasters (Xiao et al. Citation2015, Huang and Xiao Citation2015, de Albuquerque et al. Citation2015).
Five meaningful rain-related keywords obtained from de Andrade et al. (Citation2018) – ‘chuva’, ‘chove’, ‘chuvoso’, ‘chuvosa’ and ‘chuvarada’ (in Brazilian Portuguese) – were employed and any geotagged tweets containing at least one of them were filtered. The authors showed that these keywords are less sensitive to time and space than others and thus have the potential to create a filter that produces more signal than noise, i.e. they are almost invariant across space and time (when the study area is a city) and filter more true-positive (signal) than true-negative (noise) Twitter messages. True-negative tweets are referred to as those that contain at least one keyword and where the text content is not linked to the phenomenon of rain. An example of a true-negative tweet is ‘bolinho de chuva’ (little rain cookie), a typical Brazilian doughnut.
We built a rainfall signal on the basis of the filtered geotagged tweets by means of the ‘odds ratio measure’ of the frequency of geotagged tweets (EquationEquation 2(2)
(2) ) on a one-day scale.
where is the number of rain-related geotagged tweets in a spatial unit
,
is the total number of rain-related geotagged tweets,
is the number of ‘population’ geotagged tweets in a spatial unit
, and
is the grand total of that population. This kind of measure is based on the Location Quotient technique and takes into account the sampling Twitter data to offset the over-representation of the space units, which reduces the effects of a dissimilar spatial distribution of Twitter activity (Poorthuis et al. Citation2014). In addition, a higher odds ratio measure leads to a better representation of rainfall signals with regard to the Twitter activity within the spatial unit of observation.
Figure 5. Cross-section data of daily rainfall and frequency of rain-related tweets from 7 November 2016 to 26 April 2017, Sao Paulo, Brazil
4.2.2. Rainfall maps from the weather radar
The Sao Paulo weather radar of the Department of Water and Power (DAEE) and the Hydraulics Technology Foundation Center (FCTH) of the Polytechnic School of the University of Sao Paulo diagnosed the rain maps every 5 min. This device is a Dual Polarisation Doppler S-Band weather radar located approximately 60–70 km from Sao Paulo city which continuously estimates the statistics of rainfall rates at a 250 m spatial resolution from an azimuthal width of 1 degree (Selex Citation2015).
Instead of using the polar rain yields, we relied on a radar product known as Surface Rain Intensity (SRI) projected in Cartesian coordinates of a 500 × 500 m scale (Selex Citation2015). This enabled us to create new maps at 10 min time intervals to match the representation of rainfall signals of used in the Twitter activity. The mean, minimum and maximum values of each time interval were stored in each spatial observation unit. Spatial and linear interpolation techniques were employed to overcome the problem of missing data and, despite errors in the weather radar rainfall estimates, such as overestimation of some observation points (Battan Citation1973), the radar measured the rainfall rate accurately.
On the basis of the rainfall threshold of the U.S. Geological Survey (USGS), we selected days when the daily record of rainfall was, at least, higher than 10 mm per hour, i.e. we took note of any rain event equal to, or greater than, a heavy shower. This threshold is very close to the one generally used by Brazilian meteorological centers for heavy rain, such as the Brazilian National Center of Monitoring and Early Warning of Natural Disaster (CEMADEN in Portuguese). shows the daily increase in the rainfall and frequency of rain-related tweets of a cross-sectional data from 7 November 2016 to 26 April 2017.
5. Results
5.1. Optimal areal units
shows Global Moran’s I coefficient and the coefficient of variation of Local Moran’s I for the areal units. Only some of the areal units show an improvement in the criteria when compared with the adjacent areal units, i.e. higher Global Moran’s I and lower coefficient of variation of Local Moran’s I. The other areal units either increase or decrease both criteria. For example, from 20 km2 to 30 km2 both criteria improved, i.e. Global Moran’s I coefficient increased and the coefficient of variation of Local Moran’s I decreased. This means that the areal unit of 30 km2 is linked to a higher pattern of spatial association and lower spatial heterogeneity than the areal unit of 20 km2, i.e. the former provides more consistent spatial patterns and is thus likely to reflect more reliable analytical results. A similar improvement was achieved by the other areal units, such as from 80 km2 to 90 km2 and from 90 km2 to 100 km2 ().
Figure 6. Trade-off between the global indicator of spatial association (Global Moran’s I) and the overall degree of structural (in)stability (coefficient of variation of Local Moran’s I normalized by scaling between the minimum and maximum values of the Global Moran’s I coefficients. Both global and local spatial statistics were computed for a row-standardized spatial weights matrix based on first-order rook contiguity
In contrast, the areal units of 30 km2 and 50 km2 appear to achieve the best results in visual terms, although the criteria are in conflict with each other. While Global Moran’s I coefficient is higher for the areal unit of 50 km2, the coefficient of variation of Local Moran’s I is lower for the areal unit of 30 km2, i.e. if the criteria had been analyzed separately, they would have led to different results. The areal unit of 50 km2 is better in terms of overall spatial patterns, but the one of 30 km2 is better in terms of the structural stability of the local patterns. A similar conflict also appears between the areal units of 100 km2 and 200 km2. In view of this, more conflicts might occur, depending on the range, size and shape of the user-defined areal units.
According to the results of the multicriteria optimization framework in , Pareto-optimal solutions are the areal units of 50 km2 and 30 km2, since both areal units fall within the first Pareto frontier and are thus considered to be equally good (see Section 3). The Pareto front line visualization () is a ‘stair-shaped line marking the border of the dominance area’ of those tuples (solutions) (Roocks Citation2016). For example, the areal units of 50 km2 and 30 km2 dominate the other ones because their criteria are better, i.e. they are combined with a higher Global Moran’s I and lower coefficient of variation of Local Moran’s I, respectively. However, they are mutually dominated by one criterion, i.e. the areal unit of 50 km2 dominates 30 km2 in terms of Global Moran’s I and the opposite is the case for the coefficient of variation of Local Moran’s I (see ). Such a mutual domination is illustrated in by a link (line) between the scales.
Figure 7. Pareto frontier and the trade-off between Global Moran’s I and the coefficient of variation of Local Moran’s I (overall degree of structural (in)stability). Both statistics were computed for a row-standardized spatial weights matrix based on first-order rook contiguity
Table 1. Criteria values and the corresponding Pareto frontier for each areal unit. In the case of Global Moran’s I criterion, the p-value corresponds to the null hypothesis that the social media pattern is randomly distributed among the spatial units
5.2. Sensitivity analysis of the optimal areal units
shows the Pareto-optimal areal units (i.e. those within the first frontier) of a thousand runs of the multicriteria optimization framework performed by the bootstrap method which is used as a resampling approach – for details of the bootstrap resampling strategy, see Section 3. The areal units of 50 km2 and 30 km2 were significant and corresponded to 32.5% and 28.2% frequencies, respectively (); they covered 60.7% of the outcomes. Thus, they can be regarded as robust Pareto-optimal solutions within the scope and limitations of the case study.
Figure 8. Robustness of the Pareto-optimal areal units using the bootstrap method with 1,000 replications – for details of the bootstrap resampling strategy, see Section 3
Table 2. Pareto-optimal areal units and corresponding frequencies after the bootstrap method with 1,000 replications
(a)The sum of the frequencies is greater than 1,000 because the Pareto-optimal frontier may contain one or more areal units.
5.3. Implications of the choice of an arbitrary areal unit
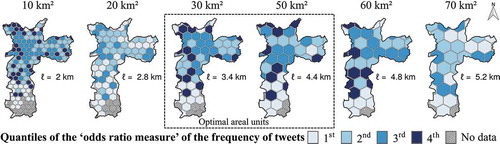
shows the spatial patterns of the heavy rainfall signal from geotagged tweets on the maps of 10 km2, 20 km2, 30 km2, 50 km2, 60 km2 and 70 km2. If an arbitrary areal unit is chosen, such as 20 km2 or 60 km2, very different and discordant spatial patterns are obtained when compared with the Pareto-optimal areal units, i.e. the patterns of the areal units of 30 km2 and 50 km2 are more similar than the others. In practice, this affects the conclusions and may lead to uncertain and unstable decisions by analysts when applying the strategy (i.e. an arbitrary choice) to urban planning (e.g. for the use of social media as a supplementary data source for heavy rainfall and flood risk management).
Figure 9. Comparison of spatial patterns of Pareto-optimal areal units (middle) and four arbitrary areal units (extremes). The patterns correspond to the ‘odds ratio measure’ of the frequency of geotagged tweets (Poorthuis et al. Citation2014). corresponds to the side length of hexagonal lattices
6. Discussion
The results of the spatial analysis of geotagged social media (e.g. those related to social mirroring of heavy rain events in our application example) are strongly dependent on the areal unit of analysis. In light of this, a large number of possible areal units must be assessed to determine which is most suitable, and computational techniques can automate their choice by evaluating one or more criteria. This is related to the pioneering work of Openshaw (Citation1977), which minimized a loss function of a linear regression model for the selection of an optimal zonal system in census studies. More recently, in the context of social media, Lee et al. (Citation2016) maximized Global Moran’s I as a criterion for the selection of an optimal areal unit. However, a limitation of both of these studies is that they rest on the assumption that the most suitable areal unit can be determined on the basis of a single optimization criterion (or loss function). As our example in this paper shows, a number of different factors may determine the choice of an areal unit and this can lead to divergences, and thus make the assessment a laborious process for the spatial analyst.
In this article, we argue that the choice of the most appropriate areal unit for social media analysis (as a data source to study real-world processes) should be based on data-driven approaches that require a multiple-criteria analysis (Section 2). Our analysis has shown the conflicts that can occur if multiple criteria are employed and we put forward a way of dealing with them that involves establishing a multicriteria optimization framework which relies on the Pareto optimality method (Section 3). This framework provides an innovative method for selecting a more appropriate areal unit of aggregation in social media based on multiple criteria, instead of a choice made through an awareness of the analyst or the evaluation of a single criterion (which were the approaches commonly used in previous work). Our systematic and novel approach for the selection of an areal unit can be flexibly adapted to include any number of optimization criteria that may be appropriate for different spatial datasets and applications. Our example of an application for the analysis of social media messages about heavy rain events, shows that the resulting optimal areal units of 30 km2 and 50 km2 provide more consistent spatial patterns than the other areal units.
Nevertheless, a number of caveats and suggested extensions of this study should be discussed. There exists a relation between the criteria chosen and the results. An ‘optimal’ areal unit for one particular criterion may not be suitable for another, e.g. the results vary when Global Moran’s I and the coefficient of spatial variation of Local Moran’s I are optimized individually ( and ). For this reason, the knowledge on the project topic and type of analysis should be used for both definitions of the range of user-defined areal units and for defining the criteria that must be evaluated (). In this article, Global Moran’s I and the coefficient of variation of Local Moran’s I have been defined because the evaluation of both criteria together reveals the continuous spatial processes more suitably than the use of a single criterion. Spatial patterns of heavy rain usually involve a high degree of spatial dependence and low level of spatial heterogeneity and are thus expected to be ‘spatially continuous’ within the study area (Blöschl and Sivapalan Citation1995).
Regarding the calculation of spatial statistics of Global and Local Moran’s I, a doubt arises on how we should choose the spatial contiguity and spatial weights matrices. In the case study, a row-standardized spatial weight matrix based on first-order rook contiguity was chosen, that was based on the results that remained stable across different spatial weight matrices. However, for a generalized and unbiased use of these spatial statistics, future studies should investigate to what extent the relationship and degree of intensity influences the underlying spatial units (Anselin Citation1995).
Furthermore, our case study is bounded to the spatial dimension and only addressed the scale effect of MAUP by means of a fixed temporal unit, i.e. the variation in statistical results between different levels of aggregation (i.e. areal unit sizes) in a one-day scale. Although our multicriteria optimization framework can be applied to assess different combinations of areal units (i.e. the scale and zoning effects, as described in Section 2), further investigation is required to address the temporal dimension. There are studies that have recently demonstrated the temporal effects of aggregation, segmentation, and boundary in a time series as a means of understanding and analyzing real-world spatio-temporal processes (Cheng and Adepeju Citation2014). Hence, these temporal effects should be taken into account in a future extension of the framework and case studies.
It should also be noted that when a spatial analysis uses regular lattices, it is often driven by data aggregation approaches and may ‘reshape’ the topology of the social media messages – depending on the size and shape of the areal unit of aggregation. The topology of social relationships can be useful for identifying landmark sites (e.g. airports, major public parks, and green spaces) and could be better reflected by using bottom-up approaches such as the concept of ‘natural cities’ (Jiang Citation2015, Jiang and Brandt Citation2016), which relies on the head/tail breaks algorithm to delineate irregular areal units and hotspots in a natural setting. Instead, we are interested in the social mirroring of a real-world spatio-temporal process from social media data (by assuming independence of social media messages).
Certainly, a number of other factors is likely to exert influence on the spatial patterns of the Twitter activity, including the topography of the urban space and potential underlying processes. However, our previous work (de Andrade et al. Citation2017, Restrepo-Estrada et al. Citation2018) provides quantitative evidence that rainfall patterns from meteorological data (e.g. rainfall gauges) are significantly associated with rainfall-related Twitter activity in the city of Sao Paulo. This enables us to suggest that the patterns identified in the current application case for our method can be useful for the analysis of the spatial distribution of rainfall within the urban space, even if we recognize the potential for spatial biases introduced by other factors (such as topography), which should be further investigated in future work.
Furthermore, the spatial heterogeneity of Twitter activity within the urban space could be associated with the existence of multiple spatial scales in the data (Westerholt et al. Citation2015). Addressing this issue goes beyond the scope of the current article, but one potential extension of our approach in this direction could involve assessing the spatial heterogeneity of the Twitter patterns to determine more homogeneous subareas, in which our approach could then be employed for selecting a most suitable local scale. However, we contend that a global optimization approach still makes sense in our application case, since it is widely used in hydrology for the analysis of rainfall (Blöschl and Sivapalan Citation1995) and it can thus be useful in practical scenarios of rainfall and flood monitoring.
With regard to the robustness of Pareto-optimal solutions, the areal units of 50 km2 and 30 km2 covered 60.7% of the bootstrapping method outcomes (), and only reflect the findings of a particular application in a case study. As a consequence, the results can change in function of different data, periods and case studies.
Last, but not least, some MCDA modelling methods cannot model the uncertainties that arise from more complex decision-making problems which are often of a quantitative and qualitative nature and extend the application of average values to represent the criteria for an assessment as a distribution (Xu Citation2012), e.g. the stratification of the average values into classes. In this case, belief structures, such as Evidential Reasoning (ER) approach (Xu Citation2012), might be employed to model and represent the problem as an MCDA.
7. Conclusion
The ‘optimal’ areal unit in social media analysis is traditionally established in different ways through the view of the analyst and the field of application. Frequently, a preferred areal unit is chosen with no clear criteria or justification for ensuring its representativeness regarding the phenomenon under study. In this case, the areal unit chosen may raise methodological issues, such as the MAUP effects. In this article, we argued that the ability to select the most appropriate areal unit in spatial analysis should be based on data-driven approaches that rely on a multiple-criteria analysis. A multicriteria optimization framework was established for the selection of an optimal areal unit in social media analysis driven by the Pareto optimality method.
We expect that the choice of an areal unit by adopting a multicriteria approach can provide much more realistic patterns than a one-dimensional approach. Indeed, solutions of real-world problems are naturally driven by multiple perspectives (i.e. criteria), which make our multicriteria optimization framework a valuable tool for selecting an optimal areal unit like those described in our application example in social media (Section 4). The potential benefits of using it were examined and discussed in detail in Sections 2, 5 and 6. However, the degree of uncertainty that an optimal areal unit can be found increases with the number of criteria and more in-depth expertise is necessary before a decision can be made on the choice of the ideal areal unit.
Future studies should aim at evaluating this framework by exploring other case study scenarios (e.g. other cities and datasets with more control than social media data) and criteria (e.g. economic and demographic factors) so that generalized results can be obtained. Furthermore, the MCDA discipline encompasses a wide range of algorithms, and other ones can be considered for the handling of multiple and usually conflicting criteria. Finally, forecasting spatial models can be designed on the basis of the optimal areal units provided by the multicriteria optimization framework to further explore the practical use of the approach proposed.
Acknowledgments
The authors would like to express their gratitude to the Center for Mathematical Sciences Applied to Industry (CeMEAI) [grant number 2013/07375-0], funded by Sao Paulo Research Foundation (FAPESP), for providing the computing resources and to DAEE/FCTH for making the weather radar data available for this study. CAMR gratefully acknowledges the support of the Brazilian National Council for Scientific and Technological Development (CNPq) (grant number 307424/2016-2). CRE would like to thank the CIC (Centro de Investigaciones y Consultorias) and Faculty of Economic Sciences of the University of Antioquia for supporting him with the necessary economic resources and working time-discharging. The authors are also grateful to the anonymous reviewers for their helpful suggestions.
Data access statement
The data and code that support the findings of this study are available in ‘figshare.com’ with the identifier https://doi.org/10.6084/m9.figshare.11369649.
Disclosure statement
No potential conflict of interest was reported by the authors.
Additional information
Funding
Notes on contributors
Sidgley Camargo de Andrade
Sidgley Camargo de Andrade is a Professor at Federal University of Technology - Paraná. His research interests are focused on spatio-temporal analysis, spatial data mining and geoscience.
Camilo Restrepo-Estrada
Camilo Restrepo-Estrada is a Professor at University of Antioquia. His research interests are focused on hydrology, social media analysis, data assimilation, statistics and machine learning.
Luiz Henrique Nunes
Luiz Henrique Nunes is a Professor at Federal Institute of São Paulo. His research interests are focused on distributed systems and multi-criteria decision analysis.
Carlos Augusto Morales Rodriguez
Carlos Augusto Morales Rodriguez is a Professor at University of São Paulo. His research interests are focused on precipitation remote sensing and atmospheric electricity.
Júlio Cézar Estrella
Júlio Cézar Estrella is a Professor at University of São Paulo. His research interests include distributed systems and multi-criteria decision analysis.
Alexandre Cláudio Botazzo Delbem
Alexandre Cláudio Botazzo Delbem is a Professor at University of São Paulo. His investigations have focused on multiobjective evolutionary algorithms and multicriteria decision making.
João Porto de Albuquerque
João Porto de Albuquerque is a Professor and the Director of the Institute for Global Sustainable Development at University of Warwick. His research interests are focused on geographic information science and sustainable development.
References
- Anselin, L., 1995. Local indicators of spatial association–LISA. Geographical Analysis, 27 (2), 93–115. doi:10.1111/j.1538-4632.1995.tb00338.x.
- Arthur, R., et al., 2018. Social sensing of floods in the UK. PloS One, 13 (1), 1–18. doi:10.1371/journal.pone.0189327.
- Battan, L.J., 1973. Radar observation of the atmosphere. L. J. Battan (The University of Chicago Press) 1973. PP X, 324; 125 figures, 21 tables. 715. Quarterly Journal of the Royal Meteorological Society, 99, 422.
- Batty, M., 2013. The new science of cities. London: MIT Press.
- Blöschl, G. and Sivapalan, M., 1995. Scale issues in hydrological modelling: A review. Hydrological Processes, 9 (3–4), 251–290. doi:10.1002/hyp.3360090305.
- Carr, D.B., Olsen, A.R., and White, D., 1992. Hexagon mosaic maps for display of univariate and bivariate geographical data. Cartography and Geographic Information Systems, 19 (4), 228–236. doi:10.1559/152304092783721231.
- Cheng, T. and Adepeju, M., 2014. Modifiable temporal unit problem (MTUP) and its effect on space-time cluster detection. PloS One, 9 (6), 1–10.
- Collette, Y. and Siarry, P., 2004. Multiobjective optimization. Decision engineering. Berlin, Heidelberg: Springer Berlin Heidelberg.
- Dark, S.J. and Bram, D., 2007. The modifiable areal unit problem (MAUP) in physical geography. Progress in Physical Geography: Earth and Environment, 31 (5), 471–479. doi:10.1177/0309133307083294.
- de Albuquerque, J.P., et al., 2015. A geographic approach for combining social media and authoritative data towards identifying useful information for disaster management. International Journal of Geographical Information Science, 29 (4), 667–689. doi:10.1080/13658816.2014.996567.
- de Andrade, S.C., et al., 2017. Mining rainfall spatio-temporal patterns in twitter: A temporal approach. In: A. Bregt, et al., eds. Societal geo- innovation. Cham: Springer International Publishing, 19–37.
- de Andrade, S.C., et al., 2018. Does keyword noise change over space and time? A case study of social media messages. XIX Brazilian Symposium on Geoinformatics – GeoInfo 2018, Campina Grande, 5-7 December. PB, Brazil, 116–121.
- Efron, B., 1979. Bootstrap methods: another look at the jackknife. The Annals of Statistics, 7 (1), 1–26. doi:10.1214/aos/1176344552.
- Fotheringham, A.S. and Wong, D.W.S., 1991. The modifiable areal unit problem in multivariate statistical analysis. Environment and Planning A: Economy and Space, 23 (7), 1025–1044. doi:10.1068/a231025.
- Fotheringham, S., 1989. Scale-independent spatial analysis. In: M. Goodchild and S. Gopal, eds.. The accuracy of spatial databases. London: Taylor & Francis, 144–149.
- Greco, S., Ehrgott, M., and Figueira, J.R., 2016. Multiple criteria decision analysis: state of the art surveys. International Series in Operations Research & Management Science, Vol. 233, New York, NY: Springer, New York, NY.
- Grunert da Fonseca, V., Fonseca, C.M., and Hall, A.O., 2001. Inferential performance assessment of stochastic optimisers and the attainment function. In: E. Zitzler, et al., eds. Evolutionary multi-criterion optimization. Berlin, Heidelberg: Springer Berlin Heidelberg, 213–225.
- Huang, Q. and Xiao, Y., 2015. Geographic situational awareness: mining tweets for disaster preparedness, emergency response, impact, and recovery. ISPRS International Journal of Geo-Information, 4 (3), 1549–1568. doi:10.3390/ijgi4031549.
- IBGE, 2010. Censo demográfico 2010. Rio de Janeiro: Brazilian Institute of Geography and Statistics.
- Jiang, B., 2015. Geospatial analysis requires a different way of thinking: the problem of spatial heterogeneity. GeoJournal, 80 (1), 1–13. doi:10.1007/s10708-014-9537-y.
- Jiang, B. and Brandt, S.A., 2016. A fractal perspective on scale in geography. ISPRS International Journal of Geo-Information, 5 (6), 95. doi:10.3390/ijgi5060095.
- Jiang, B. and Miao, Y., 2015. The evolution of natural cities from the perspective of location- based social media. The Professional Geographer, 67 (2), 295–306. doi:10.1080/00330124.2014.968886.
- Kryvasheyeu, Y., et al., 2016. Rapid assessment of disaster damage using social media activity. Science Advances, 2 (3), e1500779. doi:10.1126/sciadv.1500779.
- Lee, Y., et al., 2016. Method for determining appropriate clustering criteria of location- sensing data. ISPRS International Journal of Geo-Information, 5 (9), 151. doi:10.3390/ijgi5090151.
- Li, Z., et al., 2018. A novel approach to leveraging social media for rapid flood mapping: a case study of the 2015 South Carolina floods. Cartography and Geographic Information Science, 45 (2), 97–110. doi:10.1080/15230406.2016.1271356.
- Longley, P.A. and Adnan, M., 2016. Geo-temporal Twitter demographics. International Journal of Geographical Information Science, 30 (2), 369–389. doi:10.1080/13658816.2015.1089441.
- Martí, P., Serrano-Estrada, L., and Nolasco-Cirugeda, A., 2019. Social media data: challenges, opportunities and limitations in urban studies. Computers, Environment and Urban Systems, 74, 161–174. doi:10.1016/j.compenvurbsys.2018.11.001
- Martínez-Rojas, M., Del Carmen Pardo-Ferreira, M., and Rubio-Romero, J.C., 2018. Twitter as a tool for the management and analysis of emergency situations: A systematic literature review. International Journal of Information Management, 43, 196–208. doi:10.1016/j.ijinfomgt.2018.07.008
- Meng, Y., et al., 2014. Scale selection based on Moran’s I for segmentation of high resolution remotely sensed images. 2014 IEEE Geoscience and Remote Sensing Symposium, Quebec City, QC, Canada, July, 4895–4898.
- Morstatter, F., et al., 2013. Is the sample good enough? Comparing data from Twitter’s streaming API with Twitter’s firehose. CoRR, abs/1306.5204.
- Nummi, P., 2017. Social media data analysis in urban e-planning. International Journal of E-Planning Research, 6 (4), 18–31. doi:10.4018/IJEPR.2017100102.
- Openshaw, S., 1977. A geographical solution to scale and aggregation problems in region- building, partitioning and spatial modelling. Transactions of the Institute of British Geographers, 2 (4), 459–472. doi:10.2307/622300.
- Openshaw, S., 1978. An empirical study of some zone-design criteria. Environment and Planning A: Economy and Space, 10 (7), 781–794. doi:10.1068/a100781.
- Openshaw, S., 1984. Ecological fallacies and the analysis of areal census data. Environment and Planning A: Economy and Space, 16 (1), 17–31. doi:10.1068/a160017.
- Openshaw, S. and Rao, L., 1995. Algorithms for reengineering 1991 census geography. Environment and Planning A: Economy and Space, 27 (3), 425–446. doi:10.1068/a270425.
- Patel, N.N., et al., 2017. Improving large area population mapping using geotweet densities. Transactions in GIS, 21 (2), 317–331. doi:10.1111/tgis.12214.
- Poorthuis, A., et al., 2014. Using geotagged digital social data in geographic research. In N. Clifford, S. French, M. Cope, & T. Gillespie, eds. Pre-publication version of chapter submitted to: key methods in geography. London: SAGE Publishing, 248London: SAGE Publishing, 248–269.
- Poorthuis, A., 2018. How to draw a neighborhood? The potential of big data, regionalization, and community detection for understanding the heterogeneous nature of urban neighborhoods. Geographical Analysis, 50 (2), 182–203. doi:10.1111/gean.12143.
- Restrepo-Estrada, C., et al., 2018. Geo-social media as a proxy for hydrometeorological data for streamflow estimation and to improve flood monitoring. Computers & Geosciences, 111, 148–158. doi:10.1016/j.cageo.2017.10.010.
- Roocks, P., 2016. Computing pareto frontiers and database preferences with the rPref package. The R Journal, 8 (2), 393–404. doi:10.32614/RJ-2016-054.
- Rosser, J.F., Leibovici, D.G., and Jackson, M.J., 2017. Rapid flood inundation mapping using social media, remote sensing and topographic data. Natural Hazards, 87 (1), 103–120. doi:10.1007/s11069-017-2755-0.
- Rzeszewski, M., 2018. Geosocial capta in geographical research – a critical analysis. Cartography and Geographic Information Science, 45 (1), 18–30. doi:10.1080/15230406.2016.1229221.
- Selex, 2015. Selex meteor manual. Germany: Selex.
- Singleton, A.D., Spielman, S., and Folch, D., 2018. Urban analytics. London: SAGE.
- Smith, L., et al., 2017. Assessing the utility of social media as a data source for flood risk management using a real-time modelling framework. Journal of Flood Risk Management, 10 (3), 370–380. doi:10.1111/jfr3.12154.
- Steiger, E., et al., 2015b. Twitter as an indicator for whereabouts of people? Correlating Twitter with UK census data. Computers, Environment and Urban Systems, 54, 255–265. doi:10.1016/j.compenvurbsys.2015.09.007.
- Steiger, E., de Albuquerque, J.A.P., and Zipf, A., 2015a. An advanced systematic literature review on spatiotemporal analyses of Twitter data. Transactions in GIS, 19 (6), 809–834. doi:10.1111/tgis.12132.
- Tenkanen, H., et al., 2017. Instagram, flickr, or Twitter: assessing the usability of social media data for visitor monitoring in protected areas. Scientific Reports, 7 (1). doi:10.1038/s41598-017-18007-4.
- Tobler, W.R., 1989. Frame independent spatial analysis. In: M. Goodchild and S. Gopal, eds. The accuracy of spatial databases. London: Taylor & Francis, 75–79.
- Westerholt, R., Resch, B., and Zipf, A., 2015. A local scale-sensitive indicator of spatial autocorrelation for assessing high- and low-value clusters in multiscale datasets. International Journal of Geographical Information Science, 29 (5), 868–887. doi:10.1080/13658816.2014.1002499.
- Xiao, Y., Huang, Q., and Wu, K., 2015. Understanding social media data for disaster management. Natural Hazards, 79 (3), 1663–1679. doi:10.1007/s11069-015-1918-0.
- Xu, D.L., 2012. An introduction and survey of the evidential reasoning approach for multiple criteria decision analysis. Annals of Operations Research, 195 (1), 163–187. doi:10.1007/s10479-011-0945-9.