
ABSTRACT
Movement analysis has become an integral part of many disciplines, yet with relatively little overlap. A foresight paper in this journal entitled “Towards an integrated science of movement: converging research on animal movement ecology and human mobility science” argued for a better integration of concepts across the divide of animal and human movement, which would lead to the Integrated Science of Movement, but did so from a top-down perspective based on a series of expert workshops. We argue that for a solid establishment of the Integrated Science of Movement, a bottom-up approach is necessary, one based on existing literature which identifies similarities and differences across disciplines. We therefore review, compare, and contrast movement analysis methodologies from GIScience, movement ecology, geography, transportation, public health, computer science, and physics. We structure our review along the dichotomy of individual versus population-based movement or, using terminology from wildlife ecology, between the Lagrangian and Eulerian perspectives. We further introduce a new unifying framework for movement research that is sufficiently general to cover any type of movement study in any discipline and that spans the Lagrangian/Eulerian divide, with the ambitious goal to bridge the gap between disciplines and lay a solid foundation for a new Integrated Science of Movement.
1. Introduction
Movement is a fundamental property of life (Nathan et al. Citation2008) – where, when, how and why objects move, and how movement is linked to external factors, are therefore wide-spread research questions in many disciplines. Technological advances in movement data acquisition now allow researchers to tackle these questions, but there is still little awareness of similar developments across disciplines. There is therefore a need for an interdisciplinary science of movement to integrate theories and methodologies from across movement-interested disciplines (Demšar et al. Citation2020).
Movement data are collected through positioning technologies, such as Global Navigation Satellite Systems, mobile phone positioning, and presence-based sensors. These technologies are constantly evolving and have led to a ‘data revolution’ in many disciplines where the study of movement has gone from a data-poor to a data-rich area of research (Laube Citation2015). The movement data revolution is mirroring the processes that have recently been seen in the field of cartography. With the introduction of online map services (such as Google Maps) and open online mapping portals (such as OpenStreetMap.org), everyone can now make maps, without awareness of the historical literature and traditional cartographic techniques (Robinson et al. Citation2017). In a similar way, the number of researchers conducting movement analysis is expanding, as it is now easy for researchers to either access movement data online or collect their own. At the same time, disciplines are largely remaining in their respective silos, resulting in a wide-spread lack of interdisciplinary awareness of common methods and analytical tasks. Some disciplines are starting to recognise this as a fundamental problem (Cagnacci et al. Citation2010), leading to a call to develop a unifying general analytical framework for movement analysis in any discipline where movement data are collected (Dodge Citation2019), or a so-called Integrated Science of Movement.
A recent foresight paper in this journal (Miller et al. Citation2019) approaches the evolution of the Integrated Science of Movement from a top-down perspective, based on a series of expert workshops. Miller et al. (Citation2019) advocate for the development of cross-disciplinary research projects in movement analysis to foster the sharing of ideas and methods. Such efforts will ultimately be strongly influential in developing new and innovative research ideas in movement analysis.
However, the first step in establishing a new interdisciplinary science is a recognition and explanation of the equivalency of concepts and methods being used across the different disciplines and, where necessary, a translation between unfamiliar terminologies. In this paper, we therefore adopt an alternative bottom-up approach, by considering the concepts and methods employed across a range of disciplines involved in movement analysis, and identifying what is and is not similar. We further build upon theories from movement ecology and human mobility to introduce an integrated framework for movement research that is general and applicable in any discipline, yet covers all aspects that are relevant in investigation of movement.
We consider research in ecology, geographic information science (GIScience), geography, social sciences, public health, transportation, computer science and physics (for each discipline’s interest in movement research see Supplementary Information 3). Our goal is to attempt to bridge the gap between disciplines given their current differences in terminology and methods. A specifically wide gap seems to exist between animal movement and human mobility (Miller et al. Citation2019), one that is hindering innovation in both areas of research.
We structure the review across the two conceptualisations of movement. In the individual-based, Lagrangian, view researchers observe and analyse movement of individuals. In contrast, in the space/place-based, Eulerian, view movement is investigated as a property of population or space. We introduce a new general framework for movement research that models analysis pathways for any kind of movement study and covers both Lagrangian and Eulerian perspectives. We further identify typical analytical tasks, describe how these fit into the framework, and, for each task, compare and contrast representative methods in animal and human movement. In the main text, we provide a short overview of these common tasks, while a more complete description of concepts and methods is in Supplementary information 1. We finish with a discussion of conditions for, and barriers to, the integration of terminology and methods across disciplines and how the unification supported by our new framework could help establish the Integrated Science of Movement.
2. An integrated framework for movement research
2.1. Conceptualisation of movement research into Lagrangian and Eulerian views
As noted above, movement can be conceptualised in two ways, either as a property of individual objects or as a property of space or a population. In GIScience and geography, these two perspectives reflect the philosophical distinction between absolute and relative conceptual views of space and time (Pequet Citation1994). They are also commonly used in ecology and reflected through the Lagrangian/Eulerian dichotomy focusing on individual versus population-wide movement patterns, respectively (Nathan et al. Citation2008). The same distinction is found in human mobility, known under the terms of individual and population (or collective) mobility (Barbosa et al. Citation2018). We adopt the Lagrangian/Eulerian terminology for this review.
Lagrangian view considers the location of each individual at each time. Data that support this type of analysis are termed trajectories, which are temporal sequences of geographic locations of a moving object (Laube Citation2014). These data can be collected by different sensors, most commonly devices that use Global Navigation Satellite Systems technology such as the Global Positioning System (GPS). There are also other technologies that generate trajectory data, particularly in ecology, such as VHF radio trackers, light loggers (which identify the location on the surface of the Earth from the timing and duration of the observed daylight) and trackers using alternative satellite systems, for example the Argos system or the newly launched ICARUS (ICARUS, Citation2019). Video-based analysis is used to generate trajectories in sports and animal collective motion.
In Eulerian view, identities and exact routes of individual moving entities are not identifiable (and not the focus of study). This is space-centric movement, where we consider either presence of objects at a specific location through time and infer movement flows, or we look at origins, destinations, and the aggregated properties of the flows between origins and destinations.
Eulerian data are collected from presence sensors, for example camera traps in ecology and Bluetooth/wireless and Closed-circuit television (CCTV) systems in human mobility. Methods-based disciplines (physics, computer science and transportation) generate flows of mobile phone traffic from the Call Detail Records (CDR) data, which log communication transactions of mobile phones, such as which mobile mast the phone connected to for each transaction. Eulerian analysis also has a long tradition in geography, where the main data sources are flows between administrative units or transport locations; termed origin-destination (OD) flows (Tobler Citation1987). More recently, with the advent of Radio Frequency Identification (RFID) technology, flow data are also generated at large scale in the context of public transport (e.g. from smart cards). A common type of animal flow data are data from passive acoustic telemetry for aquatic animals (Kessel et al. Citation2014), where an array of hydrophones is placed into the observation area, and the receivers create a data record every time a tagged animal passes by.
2.2. Introducing the new integrated framework for movement research
Characteristics of movement can be domain-specific and may not be applicable across different domains. Yet there are many similarities in the concepts and the types of questions and analytical methods used to study movement across disciplines. We identify these similarities and use them to propose a new integrated framework for movement research that is both general and which offers a possibility to compare and contrast studies across disciplines. The goals of our new framework are threefold: 1) to incorporate existing animal and human movement frameworks, 2) to provide a theoretical conceptualisation for both animal and human mobility and 3) to be general enough to include both Lagrangian and Eulerian representations.
We take inspiration from two existing theoretical frameworks, one from animal movement and one from transportation science. The first is a movement ecology framework (Nathan et al. Citation2008) which focuses on Lagrangian movement and is therefore constrained with characteristics and processes suitable for investigation of movement of individuals. The second framework is a long-standing tradition in transportation science to analyse travel demand as a four-step model (FSM) (Miller and Shaw Citation2001, McNally Citation2007), which uses an Eulerian perspective (although we note that contemporary use of FSM increasingly incorporates individual mobility (Miller and Shaw Citation2015)).
The movement ecology framework for animal movement (Nathan et al. Citation2008) presents movement of an individual as a combination of three basic components related to the individual: its internal state, its motion capacity, and its navigation capacity. Each of these components represents the answer to one of the following questions: why move, where to move, and how to move? The internal state (W) is the set of psychological and neurological traits that affect the readiness of the individual to move. The motion capacity (Φ) is a set of characteristics (biomechanical or morphological) that enable the individual to move and define how it is able to move. The navigation capacity (Ω) is a set of cognitive and sensory capabilities that support the individual to find out where to move and how to get there. These components are further linked through three processes (the motion fM, the navigation fN and the movement propagation process fU) which are realisations of the respective capacities and which lead to the fourth component of the model, represented as a realised movement path (U). Animal movement is further affected by external factors (R), which are a set of static and dynamic, biotic and abiotic factors, and which affect the three basic components of the individual (the internal state, the navigation capacity and the motion capacity). These can in turn be affected by the realised movement path (e.g. by changing location) and by the focal individual (for example when interacting with other moving individuals, which are considered external factors). In our new framework we follow the mathematical symbology of this animal movement framework.
The FSM (Miller and Shaw Citation2001, McNally Citation2007) is used to forecast future demand and performance of a transportation system. It uses two types of information as input: the activity system and the transportation system. The activity system consists of socio-economic, demographic and land use data across a set of spatial units (usually traffic analysis zones, TAZs), which serve as a set of origin/destination locations for each trip. The transportation system is the transportation network graph (usually the road network). In this graph, nodes (junctions) and edges (road segments) have attributes that describe actual and potential movement along the network (e.g. length, speed, capacity, actual traffic counts). The activity and transportation systems are connected via centroid connectors that link the centre of each spatial unit to access points on the road network. Travel demand is then determined by generating an equilibrium of trips through the transportation system in four steps: 1) trip generation, 2) trip distribution, 3) choice of mode of transport and 4) route choice. In step 1, we determine for each spatial unit to what extent it is an origin or a destination for movement flows. In step 2, these flows are used to fit a spatial interaction model (see Section 4.3.) to create a flow matrix between spatial units. In step 3, each flow is assigned a most likely mode of transport, and in step 4 flows are mapped to the transportation network via centroid connectors. While this model has the very specific purpose to determine the equilibrium of travel demand across the network, its steps can be understood in a wider context as being linked to similar questions as those in the animal movement framework: why move (step 1: trip generation), where to move (step 2: trip distribution), how to move (step 3: mode choice) and, an additional step that is not present in the Nathan et al. (Citation2008) framework, what route to take (step 4: route choice).
To generalise these two frameworks across animal and human movement and to include both Lagrangian and Eulerian movement paradigms, we propose a related yet new framework () built around six questions:
Figure 1. A general conceptual framework for movement research. The model represents components of the movement process by the object of movement M (yellow background box) answering the four questions on why to move (W), where to move to (Φ1), how to get there (Φ2) and what mode to use. (Ω). The four components are interconnected and affect each other through the motion process fM (shown with arrows in blue), the navigation process fN (shown with arrows in red) and the movement propagation process fU (arrows in green). Grey arrows indicate the effects on the dynamics of external (dotted) and internal (full line) factors. The combination of processes leads to a realised movement pattern (U). Finally, the conceptualisation of the movement space (S) underlies the entire process and defines which methods are suitable for a specific movement study
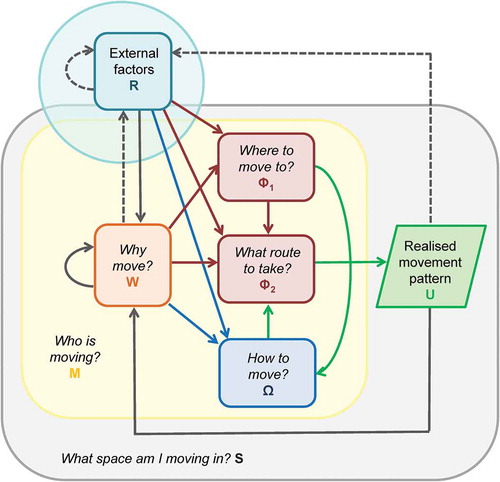
Who is moving? (M) – This replaces the focus on an individual in movement ecology and generalises the transportation framework to more than just travel demand on transportation networks. M can incorporate either an individual, a group or population movement across space.
Why move? (W) – In animal movement, the component that answers this question is the internal state of an individual (physiological/neurological), while in human movement this can be represented as motivation to move, which is realised through a cognitive decision-making process.
Where to move to? (Φ1) – In animal movement, this question is part of navigation capacity (Φ), along with route choice. In the transportation model, destination choice is investigated separately from route choice and we have therefore split these two in our framework.
What route to take? (Φ2) – For animals, this is the question of navigational strategy, while for human mobility this covers the choice of route as well as the process of cognitive wayfinding.
How to move? (Ω) – In animal movement, this question relates to physiological and biomechanical capabilities and to classification of different movement and activity types, while in human mobility this refers to the choice of travel mode.
What space am I moving in? (S) – This question relates to the representation of the space within which movement is embedded, which can be either continuous or discrete, unconstrained or restricted and which also has its inherent spatial and temporal scale.
As in the ecology framework, we propose to link questions through three processes: the motion fM, the navigation fN and the movement propagation process fU. These affect each other and result in a realised movement pattern (U). Unlike in the original model however, we place this pattern outside of the moving entity as we consider it an abstract conceptual representation of the movement process rather than an inherent characteristic of the moving entity. For Lagrangian movement, U is typically a trajectory, while in the Eulerian case, U is a set of flows between given locations or presence data from which these flows can be inferred.
All processes are affected by external factors R, which can be both static and dynamic. For animal movement, an example of a static factor is topography, and a dynamic factor is the level of greenness in the landscape. For human mobility, a static factor is the road network, and a dynamic factor is real-time congestion in different parts of the network. These factors influence the internal state of the moving entity and its motivation to move, the choice of the destination and of the route and the travel mode. For example, the motivation of caribou to migrate north is linked to the timing of greenness of the landscape, while a commuter decides when to leave home in the morning based on the level of congestion. Destination choice is done through a decision-making process, such as the decision by animals to start the dispersal out of their juvenile home ranges or for a person, the choice of a supermarket to go to on a particular day. For the route choice, migratory birds change their pathways based on environmental conditions or commuters choosing a less congested route on their way to work. Travel mode choice example in animal movement are birds using thermals to soar and gain height without using additional energy for flapping and in human mobility commuters choosing to bike or walk to work in good weather instead of taking the car.
External influences also include biotic factors, that is, the moving entity can be either influenced by movement of others or interact with other individuals in some way. A typical example in animal movement is prey escaping a predator in a pattern of avoidance. This is similar to a runner avoiding crowded areas in the park in times of social distancing. Another example is a crowd evacuating a football stadium in which every fan is following the nearest spectators to find the exit. This is similar to movement of starlings in a murmuration, where individual birds are influenced by movement of the nearest few birds.
Finally, space S refers to the conceptualisation of the geography through which the objects are moving. This can be either a continuous two- or three-dimensional physical space, a structured space or a discrete space consisting of a set of spatial units. Unconstrained continuous geographic space is typically used in terrestrial and aerial animal tracking, where animals can in principle roam freely and access any location. A structured space is exemplified in vehicular mobility, which is bound to a transportation network, or fish movement, which is bound by the river. A discrete set of spatial units is used in Eulerian movement, where we deal with flows for which we only know the origin and destination, but not the route that the movement has taken. This conceptualisation is also affected by the choice of spatio-temporal scale for analysis. In ecology, movement can be studied at the level of steps in continuous space (i.e. from one GPS point to the next), phases (i.e. segments that correspond to individual behaviours, such as foraging or escaping a predator), or lifetime tracks (Nathan et al. Citation2008). Similarly, in human mobility, we can look at steps, episodes or trips (i.e. segments that correspond to travel in a particular mode or for a particular purpose), entire semantic trajectories (Yan et al. Citation2013), or at origin-destination flows between a set of discrete spatial units (Tobler Citation1987). The choice of representation of space and the spatio-temporal scale is the precondition for a selection of a specific methodology for a particular movement study.
The advantage of our framework is that any movement study, regardless of subject, can be characterised according to our six questions (as in the list above). As a result, scientists will be more readily able to compare research questions, data structures, core concepts and analytical methods between studies, regardless of animal/human subject and Lagrangian/Eulerian perspectives. gives an example of how four of our previous studies would be characterised in this way and compared with each other.
Table 1. The unified movement framework can be applied to four previous studies from our own research spanning human and animal movement applications using both Eulerian and Lagrangian data perspectives
3. Individual-based movement/Lagrangian analysis
In this section, we describe seven common analytical tasks used in Lagrangian movement analysis () and for each task identify concepts, methods and similarities in both animal and human movement. More details are provided in Supplementary Information 1, Part I (where sections A-G correspond to sections 3.1. – 3.7. respectively).
Table 2. An overview of equivalencies of methods in animal and human movement analysis for the Lagrangian approach. For each task we identify the purpose of the task, give the concepts (terminology) in both domains and list the most frequently used data and methods (the lists are not exhaustive). In each row, the concepts/methods from the animal and human domain are equivalent. In cases where we could not find equivalency, we leave the respective domain columns blank. A detailed review of each of these tasks is provided in Supplementary Information 1 (Part I). The first column in the table identifies relevant sections in the main text (MT) and in Supplementary information 1 (SI-1)
3.1. Task L1: space use
One of the basic questions when studying movement is mapping its distribution through geographic space and time – the analysis of space use. In ecology, the two concepts that describe animal space use are home range and utilisation distribution. A home range is defined as a set of bounded areas used by the animal during its normal activities (foraging, resting, taking care of the young) (Burt Citation1943, Powell and Mitchell Citation2012), while the utilisation distribution (UD) is a probability surface that describes the intensity of use of a particular location (Kie et al. Citation2010). In human movement, the equivalent measure is an activity space, which is defined either as the spatial and potential extent of people’s habitual movements (Patterson and Farber Citation2015), the movement space of an individual (Hurst Citation1969), or a locational choice of travellers (Rai et al. Citation2007). Common methods for both home range/UD and activity spaces are the Minimum Convex Polygon (MCP) and kernel density estimation (-b).
Figure 2. Space use and time geography measures. Panel a) shows the Minimum Convex Polygon and b) a utilisation distribution surface calculated with kernel density estimation. The example in panels a) and b) is calculated with adehabitatHR R package (Calenge Citation2006) using tracking data from a Scottish Osprey (Pandion haliaetus, Crawford and Long Citation2017) in its wintering site, but the same methods are used for human tracking data. Panel c) shows space use in 2D with Potential Path Areas (PPA) and panel d) the Potential Path Volume (PPV) the 3D space use of Antarctic petrels (Thalassoica antarctica, Demšar and Long Citation2019), both calculated with the wildlifeTG R package (Long Citation2020)
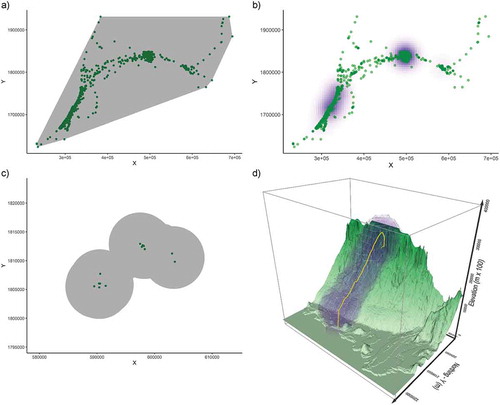
A further set of space use measures come from time geography, where human movement is modelled using the principles of space-time cubes (STC, Hägerstrand Citation1970), space-time prisms (STP, Miller Citation1991, Citation2005) and potential path areas/volumes (PPA, PPV, Long and Nelson Citation2012, Citation2015, Demšar and Long Citation2019, -d). In contrast with home ranges and activity spaces, which represent actual movement, time geography concepts study accessibility space, within which the object must have moved given the physical constraints of movement.
3.2. Task L2: identification of movement behaviours
Different movement behaviours generate different patterns in movement data. For wildlife, foraging will create a different pattern than long-term migration flights, while for humans a tourist will move differently than a commuter. Identifying behaviours requires information on the destination (Φ1) and the route (Φ2), but also on how an individual moves (Ω).
Behavioural patterns in movement data are identified through the process of segmentation, which decomposes movement data into sub-sections with similar characteristics (Buchin et al. Citation2010). In human mobility analysis it is common to derive what is termed a semantic-trajectory model (Yan et al. Citation2013), which distinguishes stops and trips from raw tracking data (). In ecology, behavioural analysis is undertaken in a nearly identical way, without the process being named.
Figure 3. The hybrid spatio-semantic trajectory model (redrawn after Yan et al. Citation2013). A raw trajectory is a sequence of individual GPS points (x,y,t). These are grouped into segments representing stops and movement parts, which build a segmented trajectory. Finally, each of the segments and stops is enriched/annotated with external information to create the classified/semantic trajectory, which describes the purpose of each stop and trip
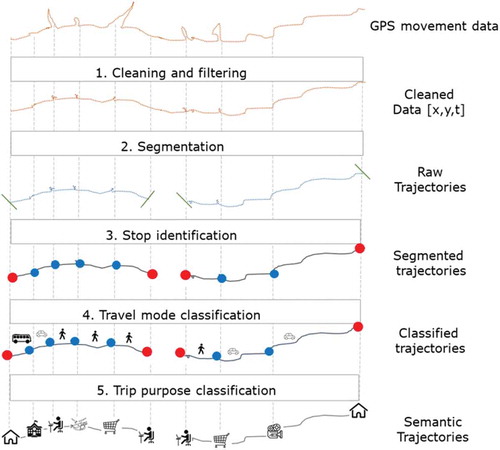
The first step in the semantic-trajectory model is a segmentation into parts with equal movement behaviour: stops, which are called significant places (Siła-Nowicka et al. Citation2016), and subtrajectories with a specific travel mode such as driving or walking (Spaccapietra et al. Citation2008, Parent et al. Citation2013). In ecology, the former are called sites of interest (Benhamou and Riotte-Lambert Citation2012, Munden et al. Citation2018) and the latter canonical activity modes (Getz and Saltz Citation2008). A typical segmentation considers location persistence (termed site fidelity in ecology) and is based on temporal duration and frequency of visits (Benhamou and Riotte-Lambert Citation2012, Siła-Nowicka et al. Citation2016).
3.3. Task L3: interaction of moving objects
The idea that individual movement is impacted by other moving individuals is in ecology termed dynamic interaction (Long and Nelson Citation2013, Long et al. Citation2014), but has alternative terms such as space–time interaction (or association) (Kenward et al. Citation1993). In human mobility (and specifically human geography), the same process is called either bundling (Hägerstrand Citation1970) or social interaction (Farber et al. Citation2013). This task requires knowledge about the motivation to move (W) and about biotic external factors (R), both involved in the reaction of the focal individual to others. Dynamic interaction methods have been applied in both human and wildlife studies (Böhm et al. Citation2009), but also in sports analytics (Bourbousson et al. Citation2010), human-computer interaction studies (Demšar and Çöltekin Citation2017), and in public health (Oliver et al. Citation2020).
Interaction of moving objects is a popular topic in computational geometry, in which geometric similarity of abstract trajectories are investigated (with no particular human/animal application) (Gudmundsson and van Kreveld Citation2006). Similarity of trajectories has also been a popular problem in the data mining and knowledge discovery subdiscipline of computer science. There are algorithms that cluster trajectories into those that represent similar movement (Nanni and Pedreschi Citation2006) and some that combine visual and analytical methods to identify similar traces (Pelekis et al. Citation2012, Andrienko et al. Citation2017b).
New technology specifically targeting interactive behaviour uses sensors that can detect when individuals are within a pre-specified distance of another – commonly referred to as contacts. In wildlife systems these devices are called proximity loggers (Ji et al. Citation2005, Böhm et al. Citation2009). Bluetooth and wireless technologies, primarily through modern mobile phones, can be used in a similar way to detect contact networks in human systems (Natarajan et al. Citation2007), real-time proximity of individuals for pandemic contact tracing (Cho et al. Citation2020) or behaviour of crowds at large events (Versichele et al. Citation2012). See also section 4.4. for more on these technologies.
3.4. Task L4: collective behaviour
Studying how groups of moving entities (animals, people or vehicles) move in relation to each other requires information on the motivation to move (W), biotic and abiotic external factors (R) as well as navigational capacities (Φ1 and Φ2). Collective motion is the synchronised movement of a group of individuals, where the group creates a structure that moves as one body and where at the same time individuals in the group do not have a complete picture of their position in the overall structure (Sumpter Citation2006). Examples are found in both animal and human movement (Warren Citation2018, Delgado et al. Citation2018).
In ecology, a specific topic is collective navigation of migratory animals (Couzin Citation2018), which is explored using agent-based models (see section 3.6) (Berdahl et al. Citation2018). In human mobility, collective behaviour is known as crowd behaviour and has been a topic of investigation for decades, with a particular focus on pedestrian behaviour in large crowds, which may require evacuation or where panic may occur (Helbing et al. Citation2000), e.g. the Hajj (Johansson et al. Citation2012) or the Notting Hill Carnival (Batty et al. Citation2003). Irfan and Tokarchuk (Citation2016) provide a review of visual (video) and non-visual (sensor-based, mostly mobile phone) methods for analysis of crowd behaviour. Crowd dynamics are also frequently modelled using Eulerian data, such as data from Bluetooth/wireless sensors, proximity sensors and CCTV camera data (section 4.4.).
3.5. Task L5: how does environment affect movement decisions?
External factors (R) such as temperature, wind or landscape elements, influence movement decision-making and navigation strategies. These factors are captured through environmental information, collected at the same time and location as the movement data.
Ecologists include environmental data into statistical models of movement in the form of covariates or factors. These typically include surfaces (raster data), such as products from satellite remote sensing (Pettorelli et al. Citation2014), land cover data (De Groeve et al. Citation2015) or meteorological data (Safi et al. Citation2013, Tarroux et al. Citation2016). The process of attaching values of environmental data to each trajectory point is called trajectory annotation. A popular ecological trajectory annotation system is Env-DATA (Dodge et al. Citation2013), which is housed by the largest repository of animal tracking data, Movebank.org (Wikelski et al. Citation2020). This process of annotating trajectories is called semantic enrichment in computer science (Parent et al. Citation2013). Annotations can be attached either to the entire trajectory or its subset, to create a so-called semantic trajectory (Yan et al. Citation2013, see also section 3.2. and ). In human mobility analysis it is common to link vector data (objects) with the trajectory and, unlike in ecology, use of contextual raster data is rare. A related problem commonly encountered in geography and transportation is called map-matching (Marchal et al. Citation2005) which links trajectories and road network segments. Trajectory annotation, semantic enrichment and map-matching all fall under the umbrella term data fusion.
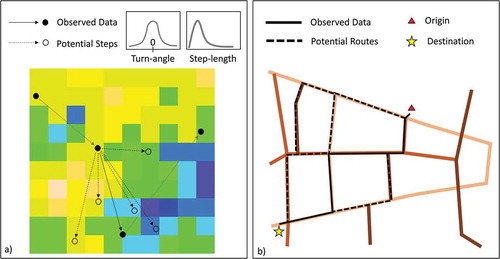
Once movement and environmental data are linked, researchers can explore how movement decisions are influenced by the environment. In ecology, this is often done via step-selection analysis (Fortin et al. Citation2005, Thurfjell et al. Citation2014, ), while human mobility analysis in geography typically employs route-, mode-, and destination choice models (Prato Citation2009, ). Context-Aware Movement Analysis (CAMA) is a term used in GIScience for the combination of trajectory annotation and data mining of annotated data to explore the effect of environment on movement (Purves et al. Citation2014). CAMA is typically applied in human mobility context and these studies often use data mining or machine learning methods (Pelekis and Theodoridis Citation2014, Brum-Bastos et al. Citation2018) or spatial interaction models (Siła-Nowicka and Fotheringham Citation2019, for more on these see section 4.3)
Figure 4. A comparison between a) step-selection functions and b) route choice models in movement research. Step-selection functions compare observed movement steps to potential steps, typically derived from random draws from a distribution describing turning-angles and step-lengths. In route choice models, observed routes are compared to potential routes across a spatial network, and typically there is overlap between potential routes. In both cases, environmental/contextual covariates are included in the model to infer about movement–environment relationships, for example land cover or elevation in step-selection functions (shown as the underlying raster), and road speeds in route choice models (shown as colours of the road network segments)
3.6. Task L6: models and prediction of movement
A fundamental challenge in both human and animal movement analysis is predicting future behaviour, which is often based on understanding movement processes (tasks L1 to L5). Both animal and human movement predominantly use statistical models for this purpose. Modelling objectives are broad and cover all stages in our proposed movement framework: motivation (W), navigation (Φ1+ Φ2), motion capacity (Ω) and external effects (R). Movement models are used to simulate individual patterns or collective population flows (for the latter see section 4.3).
In ecology, random walk models are used as a fundamental representation of animal movement (Codling et al. Citation2008), modelling movement as a series of steps with the step length and direction of movement sampled from a given distribution. Frequently used models are correlated (Kareiva and Shigesada Citation1983) and biased random walks (Moorcroft et al. Citation2006), in both discrete (Langrock et al. Citation2012) and continuous time (Harris and Blackwell Citation2013). Similar models are used in the study of human mobility (Gonzalez et al. Citation2008). These models can be extended to capture additional characteristics such as preferential returns to known locations (Song et al. Citation2010a) and favouring recently visited places (Barbosa et al. Citation2015) or social interactions (Cho et al. Citation2011).
A more general class of methods are Individual or Agent-Based Models (ABM), which model movement responses of an individual agent at every point in time and can incorporate interactions with their environment and with other individuals (Tang and Bennett Citation2010, O’Sullivan and Perry Citation2013). In ecology, ABMs require empirical data on animal movement physiology as a biological base of the simulation, along with environmental properties. They are used to study behaviour and navigation (Tang and Bennett Citation2010). In human mobility, ABMs are typically used for collective behaviour (O’Sullivan and Perry Citation2013, see also section 3.5.) and human spatial navigation (Wiener et al. Citation2009, Giannopoulos et al. Citation2014).
Movement models offer potential for prediction. This is commonly done via interpolation (Technitis et al. Citation2015) or through forecasting algorithms, which in human mobility are typically divided into three main groups: Markov-based methods, time-series methods, and machine learning methods (Gambs et al. Citation2012, Zeng et al. Citation2017, Kulkarni et al. Citation2019). Hidden-Markov Models (HMMs) are also popular in ecology (Langrock et al. Citation2012, Michelot et al. Citation2016, Leos-Barajas et al. Citation2017).
3.7. Task L7: visualising individual movement
Visualisation is an important step in the analysis of spatio-temporal data, to explore the data and communicate analysis results. In our framework, visualisation is typically limited to the realised movement pattern (U) and linking this pattern to contextual and other information (R).
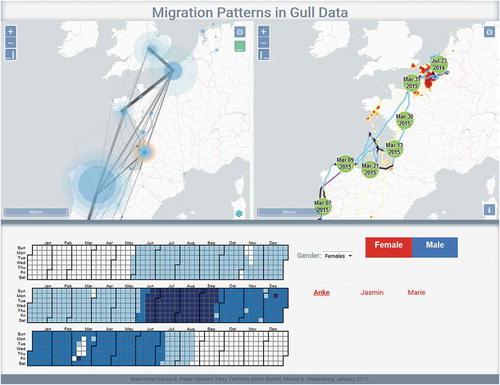
Most of the movement visualisation literature provides methods for GPS trajectories. Very common are the so-called spaghetti maps and kernel density surfaces, in both 2D, 3D and space-time cube spaces (Tracey et al. Citation2014, CitationDemšar et al. 2015a, Andrienko et al. Citation2017b). Temporal visualisations for GPS trajectories support identification of specific places and temporal profiles of movement (Kölzsch et al. Citation2013, Slingsby and van Loon Citation2017). Visual analytics systems for movement consist of interactively linked views and provide a possibility to explore different aspects of the same data (, Konzack et al. Citation2018). For non-trajectory data, an example is visualisation of magnetometry data that allows ecologists to visually analyse posture patterns (Williams et al. Citation2017).
Figure 5. A visual analytics system to analyse gull migration trajectories. The top left panel shows aggregation into flows between stopovers, which are identified through trajectory segmentation (Section 3.2.). The top right panel shows a kernel density surface (Section 3.1.) derived from trajectories and a trajectory of one selected gull (Anke). The bottom panel shows temporal use of a particular selected stopover site, marked with the orange circle in the top left panel. After Konzack et al. (Citation2018). Data on migration of lesser black-backed gulls (Larus fuscus) come from an open online biodiversity data portal gbif.org (Stienen et al. Citation2016)
4. Place-based movement/Eulerian analysis
Here we briefly describe the five typical tasks in Eulerian analysis we have identified (). Further details are given in Supplementary Information 1, part II (sections H-L, corresponding to sections 4.1. – 4.5. respectively).
Table 3. An overview of equivalencies of methods in animal and human movement analysis for the Eulerian approach. For each task we identify the purpose of the task, give the concepts (terminology) in both domains and list the most frequently used data and methods (the lists are not exhaustive). In each row, the concepts/methods from the animal and human domain are equivalent. In cases where we could not find equivalency, we leave the respective domain columns blank. A detailed review of each of these tasks is provided in Supplementary Information 1 (Part II). The first column in the table identifies relevant sections in the main text (MT) and in Supplementary information 1 (SI1)
4.1. Task E1: space use
As in Lagrangian analysis, space use methods require the knowledge of the origin and destination of movement (Φ1). In ecology, the simplest way to investigate space use from passive acoustic array data is to treat it as a point pattern data set or sequence of locations, analysed using Lagrangian methods such as the centre of activity (Simpendorfer et al. Citation2002) or home range methods combined with movement models (Papastamatiou et al. Citation2018, ). Eulerian methods for space use are rare in human mobility.
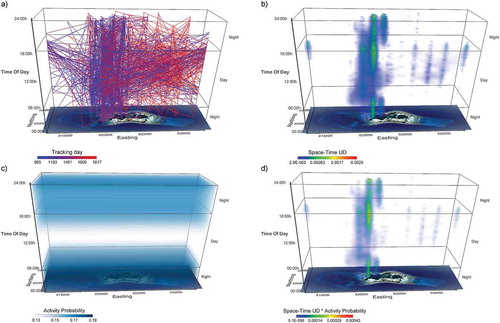
Figure 6. Activity seascapes for acoustic array data of a grey reef shark (Carcharhinus amblyrhynchos) at Palmyra Atoll in the Pacific Ocean. Panel a) shows a space-time cube of the acoustic trajectories of one individual over two years. In b) we calculated space-time densities (CitationDemšar et al. 2015a) on the same data (representing the utilisation distribution (UD) volume in space and time) and combined them with a volume of activity probability in space-time (Leos-Barajas et al. Citation2017), shown in panel c). The combination is called the activity seascape and is shown in panel d). The combined method visually enhances areas and times of high activity (Papastamatiou et al. Citation2018)
4.2. Task E2: representing flows as networks
Another common way to investigate movement as a property of space is to build networks from Eulerian observations. For this, origin and destination locations are set as vertices of the network, with edges representing movement between two locations. Each edge may be weighted, usually by the number of individuals that have moved along that edge. In geography, such networks are called either origin-destination (OD) networks or flow networks (Tobler Citation1987). Analysis of flow networks requires information on the destination Φ1 and on the structure of flows, represented as the realised movement pattern U. Occasionally, external factors (R), such as geographic distance or travel time, are also used.
In animal movement, flow networks are constructed from passive acoustic telemetry data (Lédée et al. Citation2015), camera-trap data (limited to species where individuals can be identified from photos and therefore can be tracked between cameras) and high-resolution GPS tracking data (Jacoby and Freeman Citation2016). On the human side, typical flow networks are mobile phone flows in physics (Expert et al. Citation2011), transportation networks (Hu and Zhu Citation2009) and migration or commuting networks in geography (Tranos et al. Citation2015, Sekulić et al. Citation2018).
Networks are either explored using topological properties, such as centralities (Heupel et al. Citation2018) or partitioned into dense areas – the so-called (mathematical) communities (Fortunato and Hric Citation2016). Communities are derived from properties of flows and networks structure, and in geography sometimes from distance/travel time (Sekulić et al. Citation2018), although physicists often explicitly exclude geography (Expert et al. Citation2011). In public health, community detection has been used to relate patterns in human mobility to spread of infectious diseases (Charaudeau et al. Citation2014).
4.3. Task E3: models and prediction of movement
Movement modelling from Eulerian data is primarily found in human mobility in geography and transportation, where models using origin-destination data are known as spatial interaction models – these describe movement or communication over space that results from a decision-making process (Roy and Thill Citation2005). Spatial interaction models are fitted on either raw Eulerian data (e.g. census data on commuting, Farmer and Fotheringham Citation2011) or on Eulerian data created from GPS trajectories (Siła-Nowicka and Fotheringham Citation2019). An important term is the distance decay effect, which states that strength of interaction between two locations decreases with the respective distance (Fischer Citation2002). In spatial interaction modelling, distance decay can be combined with other factors affecting movement, such as preferential returns or exploration strategies (Wang et al. Citation2019).
Another common data source for human mobility are the Call Detail Records data, which log characteristics of communication transactions of mobile phones, in particular which mobile masts they connect to for each transaction. Physicists have used these data to create models and predictions of human mobility flows (Song et al. Citation2010b, Expert et al. Citation2011). In public health, they are used to assess efficiency of measures, for example during the current COVID-19 pandemic (Oliver et al. Citation2020). They can also be linked to other data, for example to urban water flows (Smolak et al. Citation2020).
Spatial interaction models and flow models seen to be unknown in animal movement. One exception we found is a study that uses spatial interaction models to investigate landscape connectivity (Koenig Citation2018). Instead, ecology typically uses similar movement models for both Lagrangian and Eulerian data.
4.4. Task E4: modelling spatio-temporal dynamics of populations
Exploring population movement in both ecology and human mobility from Eulerian data requires information from all parts of the movement framework ().
In ecology, the most frequent and long-standing Eulerian approaches are capture-recapture methods (Otis et al. Citation1978), where scientists capture a subset of a population, mark and release them, and observe how many individuals are re-caught at a later time. Capture-recapture modelling is applied to data from remote sensing camera traps (Glover‐Kapfer et al. Citation2018), with a spatially explicit variation, called spatial capture-recapture (SCR, Royle et al. Citation2013). These approaches are less common in human mobility, although there are individual studies with similar methods, for example use of mark-recapture methods to estimate human population from mobile phone data (Papacharalampous Citation2014).
In human mobility, understanding crowd movements from Eulerian data is instead often done using data from Wi-Fi or Bluetooth arrays (Versichele et al. Citation2012, Faragher and Harle Citation2014, Cho et al. Citation2020). Another type of Eulerian data that are used to model human crowd dynamics is video footage from CCTV cameras (Nayan et al. Citation2019).
4.5. Task E5: visualising flows
The most common flow visualisations are OD maps, which have been in use in geography since the 19th century (Friendly Citation2008) and remain popular today in a variety of shapes and forms (Xiao and Chun Citation2009, Wood et al. Citation2010, Buchin et al. Citation2011, Andrienko et al. Citation2017a). Batty (Citation2018) gives a review of methods for visualising flows in cities. Graser et al. (Citation2018) provide a big data approach to OD maps.
In ecology, most flow visualisations are related to space use (see section 4.1), for example, Papastamatiou et al. (Citation2018) connect space-time densities with Hidden Markov Model-derived activity probabilities to create activity seascapes ().
The main challenge in visualising flows is that they form a dense interconnected network with many edges and vertices that cannot be moved because they are linked to specific geographic positions. This leads to significant occlusion and overprinting, unlike general network visualisations in computer science which allow positions of vertices to be optimised given the network structure, without being constrained by geographic space. In computer science there are further non-geographic alternatives to address this problem, such as visualisations based on adjacency matrices, edge bundling or small multiples (Hadlak et al. Citation2015), but these are rarely used for practical analysis of movement outside computer science.
5. Discussion and conclusions
5.1. The need for a general framework for movement analysis
Our goal in developing a new framework for movement analysis was to establish a set of concepts that will allow researchers explore the causes and mechanisms of movement and relate these to the resulting spatio-temporal patterns observed in the data, regardless of what kind of movement they are investigating. The ambition of our framework is that it can be applied to any movement study, from bird migration through transportation analysis to general models of human mobility in physics (as demonstrated in ). The expectation is that such a framework will set the stage for a development of the unified theory of movement, which will consolidate diverse and specialised research fields and allow them to find interdisciplinary solutions to contemporary environmental and societal problems – many of which are linked to movement. There is a current debate as to whether such a unified theory of movement is possible, due to the variety of objects that move, types of movement and movement-related processes (Miller et al. Citation2019). We argue that a general framework such as ours, which provides an integrated approach to the acquisition of knowledge about movement processes, but which is at the same time general enough to cover all types of animal and human movement, can indeed serve this purpose. In this section, we therefore explore how our framework compares with other existing frameworks in movement ecology and human mobility () in terms of the potential to fulfil this purpose.
Table 4. An overview of existing analysis frameworks in movement ecology and human mobility. We use citation rate per year (citations from Google Scholar, 8 December 2020) as a proxy for uptake of each framework in their respective discipline. CDR data are call detail record data
Our framework extends the highly influential Nathan et al. (Citation2008) movement ecology framework, which has since publication unified animal movement research to an extraordinary level in that most studies now use this as its main theoretical basis (as demonstrated by its citation rate, ). Other analysis frameworks in movement ecology are narrower in scope – it remains to be seen what their influence will become. For example, Allen and Singh (Citation2016) present a framework to link movement data analysis to conservation management and Williams et al. (Citation2020) propose a framework that optimises the use of bio-loggers in Lagrangian movement research through either a question-driven or a data-driven analysis. Neither of these are applicable outside of their specific topic.
Human mobility frameworks are much more numerous, due to the more fragmented research landscape and a tradition in methods-driven disciplines to frame research in terms of introducing new methodological frameworks. A strong theme amongst existing frameworks in the study of human mobility is their non-generalisability in that they focus on a specific topic in the human mobility process (). They are consequently not as well known beyond a small circle of researchers and, therefore, not as ubiquitously applicable as the Nathan et al. (Citation2008) framework is in movement ecology. The closest to a general theoretical framework for human mobility are perhaps two sources. One is Andrienko et al. (Citation2013), which sets out a theory of representation of movement in terms of data types, modelling representation, transformations and applications, but then focuses on visual analytics rather than establishing an overarching case for movement analysis in general. The second is the data science paradigm applied to movement (Dodge Citation2019), which specifies how movement analysis tasks fit into the intersection between theory- and data-driven analytics, visualisation and domain knowledge, but which provides a top-down view on the intersection of disciplines. Unlike our proposed framework, this does not address practicalities of how to contextualise a particular movement study in terms of questions it is trying to answer and concepts used to answer these questions, such as our framework is able to do ().
None of the frameworks in fulfils the ambition that we set for our framework: to be applicable to any movement study by going beyond the animal/human divide, beyond the Lagrangian/Eulerian perspective and beyond the data type or research topic. While it remains to be seen what influence our framework could achieve, we believe that among all surveyed theoretical work (), ours is the most unifying and general enough to achieve the ambitious goal to underpin interdisciplinary integration of movement research.
5.2. Obstacles for interdisciplinary knowledge transfer
One of the obstacles for interdisciplinary transfer of concepts and methods is inaccessibility: methods which are inaccessible to a wide audience stand a lower chance of being adopted beyond the original discipline. Accessibility is supported by an open culture that provides data openly and implements methods as Free and Open Source Software (FOSS). Many journals that publish movement research now require open data and code as a pre-requisite for peer review, including this journal (the International Journal of Geographic Information Science), which requires papers to comply with the FAIR principle (Wilkinson et al. Citation2016): code and data need to be Findable, Accessible, Interoperable and Reusable. We found however that in movement research this openness varies substantially between the animal and human side.
Open data are becoming the norm in movement ecology (Roche et al. Citation2015, Wikelski et al. Citation2020, Supplementary Information 2), but this is not currently widespread in human mobility. The sensitive nature of human data means that human mobility researchers often cannot (or choose not to) release data without compromising privacy. It is easy to identify important places in an individual’s life from their GPS trajectories (see section 3.2) and discover the identity of a particular individual. To prevent this, human movement data can be anonymised, either by masking the locations of home/work or by providing only aggregate data. Sometimes anonymisation is not possible even for aggregated data (De Montjoye et al. Citation2013). While privacy is not considered an equivalent problem in movement ecology, analogous concerns about the ease of location identification appear with tracking of endangered or economically profitable species (Goldenberg et al. Citation2018). More research into strategies for anonymising/de-sensitising movement data is therefore required so that they can be released as open data (Demšar et al. Citation2020).
The provision of Free and Open Source Software has grown rapidly across most movement disciplines (Supplementary Information 2), in particular using the R Computing Environment and the Python Programming Language. While ecology and GIScience are at the forefront with a widespread code-sharing tradition, in methods-oriented movement disciplines (computer science, physics, transportation science) there are varied levels of commitment to releasing code. Many of the computer science and physics papers we reviewed provide mathematical details of their new methods, but code is usually not provided. This limits a wider adoption of these methods beyond the authors and their direct collaborators. However, even in these disciplines we are beginning to see a cultural shift as they become aware of the importance of reproducibility in methodological research (Stahl and Wright Citation2018).
A further major obstacle is the fractured nature of the publishing landscape. This is reflected by the differences in publication culture between methods-oriented disciplines such as computer science or engineering, and applied disciplines such as ecology or geography. Methods-oriented disciplines favour conference proceedings, which typically publish ~10 page long peer-reviewed papers, over academic journals. This means that methods-oriented research is often unknown in applied disciplines, where the main publication venues are academic journals and where conferences typically only require very short abstracts (often 100–200 words) without full papers. Consequently, it might not occur to an ecologist to look for a conference paper from computer science as a potential source of new methodology. Conversely, a relatively common approach in methods-oriented disciplines is that researchers develop sophisticated new methods, but do not critically evaluate their data analyses (Brunsdon and Comber Citation2020) through obtaining domain knowledge about the objects they are modelling, such as in movement analysis the knowledge about the biology of animals whose movement they are analysing or psychological motivations for human movement decision-making. This leads to methods that are either simplistic, too abstract or that fail to produce a plausible result (Demšar et al. Citation2019). We as GIScientists may be optimally situated to close this gap in both directions, since our publishing culture acknowledges both journals and conferences and since we traditionally collaborate widely across many different application disciplines.
5.3. Success stories
An important condition for interdisciplinary knowledge transfer is understanding the nature of the research problems in a complementary discipline, and interdisciplinary collaboration has been crucial to fulfiling this condition (Miller et al. Citation2019). In Europe, some of the interdisciplinary developments included COST Actions, for example, “MOVE – Knowledge Discovery from Moving Objects“ (CitationDemšar et al. 2015b) and ‘ENRAM – The European Network for the Radar surveillance of Animal Movement’ (Shamoun-Baranes et al. Citation2014), both of which brought together researchers from disciplines interested in movement (movement ecology, transportation, architecture, human-computer interaction) and methodological experts (computer scientists, GIScientists, engineers). These actions have sparked follow up activities, such as a series of interdisciplinary workshops on analysis of movement (Purves et al. Citation2014, Dodge et al. Citation2016, Long et al. Citation2018). Another current example is an initiative by the International Bio-logging Society, which brings together teams from ecology and human mobility to investigate changes in wildlife-human interaction during the COVID-19 lockdown – in the so-called ‘anthropause’ (Rutz et al. Citation2020). Animal ecology has further recognised the importance of ecologists to obtain an improved understanding of spatio-temporal analysis through initiatives such as AniMove.org, which trains ecologists in remote sensing and analysis of spatial data. These and similar initiatives have already led to cross-disciplinary studies, where methods from one discipline were adapted or applied in a completely different context. To illustrate that crossing boundaries can be and is indeed being done, we now list some successful examples.
In an ecological study, Cleasby et al. (Citation2019) evaluate trajectory similarity measures from GIScience and computational geometry and compare them with the nearest neighbour distance (NND) which is commonly used in ecology. They found that those measures that were so-far unknown in ecology outperformed NND. Transferring methods the other way, Van Nieuland et al. (Citation2016) developed a spatially explicit movement model popular in ecology to predict movement in a sports event, and Acedo and Johnson (Citation2019) used home range and habitat use methods from ecology for platial analysis in human mobility.
One method that has been applied in many disciplines is sequence analysis, which originated in bioinformatics for analysis of DNA and proteins. To use sequence analysis for movement analysis, trajectories are translated into categorical sequences of characters and then data mining methods are applied to identify movement patterns. De Groeve et al. (Citation2015) use sequence analysis for habitat analysis in animal movement, while Brum-Bastos et al. (Citation2018) adapt a multi-channel version of sequence analysis (originally introduced for longitudinal analysis in demography (Gauthier et al. Citation2010)) in human mobility, to investigate the effect of weather on commuting.
Computer science can in these interdisciplinary collaborations be either the methodological or, more rarely, the application discipline. An example of the latter is an approach where dynamic interaction measures from ecology were used to explore eye and mouse movement in human-computer interaction (Demšar and Çöltekin Citation2017). An example of the former is a development of bespoke virtual and augmented reality environment for visualisation of 3D bird movement (Klein et al. Citation2019).
5.4. Opportunities for GIScience
We have identified many similarities in concepts and methods between animal and human movement analysis and found fewer gaps than we expected as we started our review. However, there remain fundamental open problems, which GIScience, as a discipline that specialises in spatio-temporal aspects of movement analysis, may be particularly well placed to address.
Scale is one of the most fundamental problems in any spatio-temporal analysis, and particularly so for movement. Scale refers both the spatial and/or temporal level at which movement processes operate but also to a more practical issue of choosing the correct scale or scales to collect and analyse movement data. Both ecology and geography have recognised that there is no specific scale at which spatio-temporal phenomena should be studied as both animal and human systems show variability across a range of spatial and temporal scales (Openshaw Citation1984, Levin Citation1992). This can lead to fundamentally different insights depending on the choice of scale, something that movement researchers are not always aware of. GIScience, however, has a long tradition of studying scale, both generally and for animal and human movement (Laube and Purves Citation2011, Alessandretti et al. Citation2020) and can contribute to a better understanding of the effect of choice of scale on inferences we make.
A related problem is the mismatch of scale between different data sources. With the increase in availability of sensor data from co-located sensors on tracking tags and of environmental data from external sources, there is also an increased need for methods that will link these data through their co-location in space and time (section 3.5.). The main challenge that these data fusion methods need to solve are vastly different spatial and temporal scales at which data are collected – GIScience is again uniquely positioned to assist with this type of problem and has started to offer solutions, such as utilising multi-source downsampling methods from remote sensing for animal movement analysis (Brum Bastos et al. Citation2020).
Movement is defined as change in location over time and is therefore an inherently temporal process. However, many methods that we reviewed ignore the temporal aspect completely. While this is beginning to change to some extent (Demšar and Long Citation2019, Miller et al. Citation2020), it is an established fact in GIScience that introducing time increases the complexity of analysis (Pequet Citation1994). This complexity is often beyond the level that many movement researchers are comfortable with and so they ignore time and resort to spatial analysis only. GIScience has a long tradition of simultaneously dealing with space and time and can help develop robust new measures and methods that consider space as well as time for both animal and human movement.
Much of movement research has attempted to divide movement data into parts that describe places/stops and those that describe movement between these places (section 3.2.). Researchers often characterise moving parts using a variety of measures (Dodge et al. Citation2008), but places that animals and humans visit have not been given equal attention. A new GIScience trend towards platial analysis (Westerholt et al. Citation2019, Acedo and Johnson Citation2019) – a richer perspective which goes beyond automatic geometric identification of ‘significant places’ in semantic trajectory analysis (section 3.2.) – could lead towards a more platial-oriented analysis of movement. While we note that in GIScience ‘a place’ has a specifically human connotation as a location with perceived anthropogenic meaning (Westerholt et al. Citation2019), a type of platial behaviour exists in animal movement as well, for example in migration, where the animals every year travel to the same breeding and wintering grounds using the same stopover locations. These specific locations are either chosen individually on the first migration (Gill et al. Citation2019) or learnt through social interaction (Oudman et al. Citation2020) and can therefore be considered as having an equivalent type of meaning for the migratory animals as a place in human mobility.
5.5. Conclusion
We are at a point in time where new and increasingly complex movement data require new innovative interdisciplinary approaches to address novel and ambitious questions about movement. These new approaches require concentrated efforts by movement researchers to expand beyond disciplinary silos and seek inspiration and connection to other disciplines, something that is often difficult to accomplish. The primary goal of this paper is to facilitate such interdisciplinary exchange. We believe that our proposed general framework, along with the comprehensive review of the current state of the art methods in movement research presented in this paper, will help accomplish the unification of movement research across disciplines to bring the Integrated Science of Movement out of its infancy and into a fully fledged interdisciplinary science.
TGIS_1880589_Supplementary_Material
Download Zip (2.6 MB)Acknowledgments
Authors are supported by the Leverhulme Trust Research Project Grant (RPG-2018-258), the Economic and Social Research Council (ESRC) Advanced Quantitative Methods Scholarship (2017), the Natural Sciences and Engineering Research Council of Canada, the Children’s Health Research Institute, the James Hutton Institute, the University of St Andrews, Wroclaw University of Environmental and Life Sciences, The University of Auckland and the Western University. We would also like to thank the three anonymous reviewers who have helped us come up with the idea of a general framework that spans disciplines and modelling perspective divide. Further thanks go to handling associate editor Prof Shawn Laffan, for his constructive suggestions and editorial effort.
Disclosure statement
No potential conflict of interest was reported by the authors.
Data and code availability statement
Data and code sharing are not applicable to this article as no new data were created or analysed in this study nor did we produce any code.
Supplementary material
Supplemental data for this article can be accessed here.
Additional information
Funding
Notes on contributors
Urška Demšar
Urška Demšar is Senior Lecturer (Associate Professor) in Geoinformatics at the University of St Andrews, where she is co-chair of the Bell Edwards Geographic Data Institute (BEGIN). She has a PhD in Geoinformatics from the Royal Institute of Technology (KTH), Stockholm, Sweden and a background in Applied Mathematics from the University of Ljubljana, Slovenia. Her research interests are in spatio-temporal analytics and in particular in analysis of movement – a topic on which she is collaborating with movement researchers from other disciplines (movement ecologists, human mobility researchers, human-computer interaction specialists).
Jed A. Long
Jed A. Long is Assistant Professor in the Department of Geography & Environment at Western University in London, Ontario, Canada. He received his PhD in Geography from the University of Victoria, in Victoria, BC, Canada. Dr Long’s research focuses on the theoretical, methodological, and applied aspects of the study of movement. His work is highly computational and has application both in the context of human and animal movement.
Fernando Benitez-Paez
Fernando Benitez-Paez is a Postdoctoral Researcher in spatial data science at the University Jaume I, working on analysing and classifying urban mobility patterns. Previously, Fernando was a Postdoctoral Fellow at the School of Geography and Sustainable Development at the University of St Andrews. He received his PhD in Geoinformatics from the University Jaume I in 2018. His research interests include geographic information science, data fusion methods, animal movement, urban analytics, and geospatial data analysis.
Vanessa Brum Bastos
Vanessa Brum-Bastos received her doctoral degree in Geography (Geoinformatics) from the University of St Andrews in 2019. During 2019, she worked as a Postdoctoral Research Associate at Arizona State University and since January 2020 she has been back at the University of St Andrews as a Postdoctoral Fellow at the Bell Edwards Geographic Data Institute (BEGIN). Her research focuses on the development and implementation of Context-Aware Movement Analysis (CAMA) to further understand behaviour from movement data. More specifically, she is interested in combining movement data with environmental and socio-economic variables to understand how different factors can influence human mobility and wildlife behaviour. This knowledge is critical for planning equalitarian sustainable transportation systems, as well as designing biodiversity conservation plans.
Solène Marion
Solène Marion is a PhD student at the University of St Andrews and the James Hutton Institute. Her PhD focuses on the interaction between red deer and hikers in the Scottish uplands. She specialises in collecting and analysing camera traps photos. Prior to that, she did her MSc degree at the University of Montpellier, where she studied the ecology of ecosystems and interaction between species.
Gina Martin
Gina Martin is a Postdoctoral Associate in the Department of Geography and Environment at Western University. She holds a Ph.D. from the Faculty of Medicine at the University of St Andrews in Scotland, with a specialization in Population and Behavioural Health Science. Her research focuses on how neighbourhood environments influence human health and wellbeing.
Sebastijan Sekulić
Sebastijan Sekulić is currently a PhD student at the University of St Andrews, where he arrived after obtaining a MSc degree at in Geodesy and Geoinformatics from Zagreb University. Currently he is working on developing new methods for spatial flow network analysis. His research interests are geographic information science, spatial network analysis, mobility and geospatial data mining.
Kamil Smolak
Kamil Smolak has completed an MSc in Geodesy and Cartography at Wroclaw University of Environmental and Life Sciences (UPWr) and is a PhD student at the same university. His research interests are human mobility modelling, privacy protection, mobility prediction, and machine learning.
Beate Zein
Beate Zein is currently a PhD student at the University of St. Andrews. She has an MSc from the University of Bielefeld, where she studied systems biology and ecology. For her PhD she is modelling geomagnetic bird navigation during migration. Her research interests lie mainly in the areas of movement biology, especially in marine species.
Katarzyna Siła-Nowicka
Katarzyna Siła-Nowicka is a Lecturer in Geographic Information Science at the University of Auckland. She was previously a Postdoctoral researcher at the Urban Big Data Centre at the University of Glasgow. She has a PhD in Geoinformatics from the University of St Andrews, Scotland. Her research focuses on movement analytics, geocomputation, geoprivacy and spatial modelling.
Related Research Data
References
- Acedo, A. and Johnson, P.A., 2019. Home range and habitat: using platial characteristics to define urban areas from the bottom up. Transactions in GIS, 24 (4), 819–841. doi:10.1111/tgis.12597.
- Alessandretti, L., Aslak, U., and Lehmann, S., 2020. The scales of human mobility. Nature, 587 (7834), 402–407. doi:10.1038/s41586-020-2909-1.
- Allen, A.M. and Singh, N.J., 2016. Linking movement ecology with wildlife management and conservation. Frontiers in Ecology and Evolution, 3, 155. doi:10.3389/fevo.2015.00155
- Andrienko, G., et al., 2013. Visual analytics of movement. Berlin-Heidelberg: Springer Verlag.
- Andrienko, G., et al., 2017a. Revealing patterns and trends of mass mobility through spatial and temporal abstraction of origin-destination movement data. IEEE Transactions on Visualization and Computer Graphics, 23 (9), 2120–2136. doi:10.1109/TVCG.2016.2616404.
- Andrienko, G., et al., 2017b. Visual analytics of mobility and transportation: state of the art and further research directions. IEEE Transactions on Intelligent Transportation Systems, 18 (8), 2232–2249. doi:10.1109/TITS.2017.2683539.
- Barbosa, H., et al., 2015. The effect of recency to human mobility. EPJ Data Science, 4 (1), 21. doi:10.1140/epjds/s13688-015-0059-8.
- Barbosa, H., et al., 2018. Human mobility: models and applications. Physics Reports, 734, 1–74. doi:10.1016/J.PHYSREP.2018.01.001
- Batty, M., 2018. Visualizing aggregate movement in cities. Philosophical Transactions of the Royal Society B, 373, 20170236. doi:10.1098/rstb.2017.0236
- Batty, M., Desullas, J., and Duxbury, E., 2003. Safety in numbers? Modelling crowds and designing control for the notting Hill Carnival. Urban Studies, 40 (8), 1573–1590. doi:10.1080/0042098032000094432.
- Benhamou, S. and Riotte‐Lambert, L., 2012. Beyond the utilization distribution: identifying home range areas that are intensively exploited or repeatedly visited. Ecological Modelling, 227, 112–116. doi:10.1016/j.ecolmodel.2011.12.015
- Berdahl, A.M., et al., 2018. Collective animal navigation and migratory culture: from theoretical models to empirical evidence. Philosophical Transactions of the Royal Society B, 373, 20170009. doi:10.1098/rstb.2017.0009
- Böhm, M., Hutchings, M.R., and White, P.C.L., 2009. Contact networks in a wildlife-livestock host community: identifying high-risk individuals in the transmission of bovine TB among badgers and cattle. PloS One, 4 (4), e5016. doi:10.1371/journal.pone.000501.
- Bourbousson, J., Sève, C., and McGarry, T., 2010. Space-time coordination dynamics in basketball: part 1. intra- and inter-couplings among player dyads. Journal of Sports Sciences, 28 (3), 339–347. doi:10.1080/02640410903503632.
- Brum Bastos, V., et al., 2020. Multi-source data fusion of optical satellite imagery to characterize habitat selection from wildlife tracking data. Ecological Informatics, 60. doi:10.1016/j.ecoinf.2020.101149.
- Brum-Bastos, V.S., Long, J.A., and Demšar, U., 2018. Weather effects on human mobility: a study using multi-channel sequence analysis. Computers, Environment and Urban Systems, 70, 1–17. doi:10.3233/AIC-2008-0431
- Brunsdon, C. and Comber, A., 2020. Big issues for big data: challenges for critical spatial data analytics. Journal of Spatial Information Science, 21, 89–98. doi:10.5311/JOSIS.2020.21.625
- Buchin, K., Speckmann, B., and Verbeek, K., 2011. Flow Map Layout via Spiral Trees. IEEE Transactions on Visualization and Computer Graphics, 17 (12), 2536–2544. doi:10.1109/TVCG.2011.202.
- Buchin, M., et al., 2010. An algorithmic framework for segmenting trajectories based on spatio-temporal criteria categories and subject descriptors. Proceedings of the 18th SIGSPATIAL International Conference on Advances in Geographic Information Systems, 0903, 202–211. doi:10.1145/1869790.1869821
- Burt, W.H., 1943. Territoriality and home range concepts as applied to mammals. Journal of Mammalogy, 24, 346–352. doi:10.2307/1374834
- Cagnacci, F., et al., 2010. Animal ecology meets GPS-based radiotelemetry: a perfect storm of opportunities and challenges. Philosophical Transactions of the Royal Society B, 365, 2157–2162. doi:10.1098/rstb.2010.0107
- Calenge, C., 2006. The package adehabitat for the R software: tool for the analysis of space and habitat use by animals. Ecological Modelling, 197 (3–4), 516–519. doi:10.1016/j.ecolmodel.2006.03.017.
- Charaudeau, S., Pakdaman, K., and Boëlle, P.Y., 2014. Commuter mobility and the spread of infectious diseases: application to influenza in France. PloS One, 9, 1. doi:10.1371/journal.pone.0083002
- Cheng, X., et al., 2017. Exploiting mobile big data: sources, features and applications. IEEE Network. doi:10.1109/MNET.2017.1500295NM.
- Cho, E., Myers, S.A., and Leskovec, J., 2011. Friendship and mobility: user movement in location-based social networks. Proceedings of the 17th ACM SIGKDD International Conference on Knowledge Discovery and Data Mining, 1082–1090. doi:10.1145/2020408.2020579
- Cho, H., Ippolito, D., and Yu, Y.W., 2020. Contact tracing mobile apps for COVID-19: privacy considerations and related trade-offs. ArXiv, arXiv, 2003.11511. [cs.CR]. Available from: https://arxiv.org/abs/2003.11511.
- Cleasby, I.R., et al., 2019. Using time-series similarity measures to compare animal movement trajectories in ecology. Behavioral Ecology and Sociobiology, 73 (151). doi:10.1007/s00265-019-2761-1.
- Codling, E., Plank, M.J., and Benhamou, S., 2008. Random walk models in biology. Journal of the Royal Society Interface, 5, 813–834. doi:10.1098/rsif.2008.0014
- Couzin, I.D., 2018. Collective animal migration. Current Biology, 28, 976–980. doi:10.1016/j.cub.2018.04.044
- Crawford, R.E. and Long, J.A., 2017. Habitat preferences of juvenile Scottish Ospreys Pandion haliaetus at stopover and wintering sites. Ringing & Migration, 32 (1), 1–18. doi:10.1080/03078698.2017.1323998.
- De Groeve, J., et al., 2015. Extracting spatio-temporal patterns in animal trajectories: an ecological application of sequence analysis methods. Methods in Ecology and Evolution, 7, 369–379. doi:10.1111/2041-210X.12453.
- De Montjoye, Y.A., et al., 2013. Unique in the crowd: the privacy bounds of human mobility. Scientific Reports, 3, 1376.
- Delgado, M.D.M., et al., 2018. The importance of individual variation in the dynamics of animal collective movements. Philosophical Transactions of the Royal Society B, 373, 20170008. doi:10.1098/rstb.2017.0008
- Demšar, U., et al., 2015a. Stacked space-time densities: a geovisualisation approach to explore dynamics of space use over time. GeoInformatica, 19 (1), 85–115. doi:10.1007/s10707-014-0207-5.
- Demšar, U., et al., 2015b. Analysis and visualisation of movement: an interdisciplinary review. Movement Ecology, 2015 (3), 5. doi:10.1186/s40462-015-0032-y.
- Demšar, U. and Çöltekin, A., 2017. Quantifying gaze and mouse interactions on spatial visual interfaces with a new movement analytics methodology. PLoS ONE, 12 (8), e0181818. doi:10.1371/journal.pone.0181818.
- Demšar, U., et al., 2018. Revisiting the past: replicating fifty year old flow analysis using contemporary taxi flow data. Annals of the Association of American Geographers, 108 (3), 811–828. doi:10.1080/24694452.2017.1374164.
- Demšar, U. and Long, J.A., 2019. Potential Path Volume (PPV): a geometric estimator for space use in 3D. Movement Ecology, 7, 14. doi:10.1186/s40462-019-0158-4
- Demšar, U., Slingsby, A., and Weibel, R., 2019. Introduction to the special section on visual movement analytics. Information Visualization, 18 (1), 133–137. doi:10.1177/1473871618810849.
- Demšar, U., Long, J.A., and Siła-Nowicka, K., 2020. Integrated science of movement. Journal of Spatial Information Science. doi:10.5311/JOSIS.2020.21.721.
- Dodge, S., et al., 2013. The environmental-data automated track annotation (Env-DATA) system: linking animal tracks with environmental data. Movement Ecology, 1 (1), 3. doi:10.1186/2051-3933-1-3.
- Dodge, S., et al., 2016. Analysis of movement data. International Journal of Geographical Information Science, 30 (5), 825–834. doi:10.1080/13658816.2015.1132424.
- Dodge, S., 2019. A data science framework for movement. Geographical Analysis. Online First publication. doi:10.1111/gean.12212.
- Dodge, S., Weibel, R., and Lautenschuetz, A.-K., 2008. Towards a taxonomy of movement patterns. Information Visualization, 7 (3–4), 240–252. doi:10.1057/PALGRAVE.IVS.9500182.
- Expert, P., et al., 2011. Uncovering space-independent communities in spatial networks. Proceedings of the National Academy of Sciences, 108 (19), 7663–7668. doi:10.1073/pnas.1018962108.
- Faragher, R. and Harle, R., 2014. An analysis of the accuracy of bluetooth low energy for indoor positioning applications. Proceedings of the 27th International Technical Meeting of the Satellite Division of the Institute of Navigation, Tampa, Florida ION GNSS 2014, 1, 201–210.
- Farber, S., et al., 2013. The social interaction potential of metropolitan regions: a time-geographic measurement approach using joint accessibility. Annals of the Association of American Geographers, 103 (3), 483–504. doi:10.1080/00045608.2012.689238.
- Farmer, C.J.Q. and Fotheringham, A.S., 2011. Network-based functional regions. Environment & Planning A, 43 (11), 2723–2741. doi:10.1068/a44136.
- Fileto, R., et al., 2013. Baquara: a holistic ontological framework for movement analysis using linked data. In: W. Ng, V.C. Storey, and J.C. Trujillo, eds.. Conceptual modeling. Lecture Notes in Computer Science, 8217. Berlin, Heidelberg: Springer, 342–355. doi:10.1007/978-3-642-41924-9_28.
- Fischer, M.M., 2002. Neural spatial interaction modeling. In: M.M. Fischer and Y. Leung, eds.. Geocomputational modelling: techniques and applications. Berlin: Springer, 195–219.
- Fortin, D., et al., 2005. Wolves influence Elk movements: behaviour shapes a trophic cascade in yellowstone national park. Ecology, 86 (5), 1320–1330. doi:10.1890/04-0953.
- Fortunato, S. and Hric, D., 2016. Community detection in networks: a user guide. Physics Reports, 659, 1–44. doi:10.1016/j.physrep.2016.09.002
- Friendly, M., 2008. The golden age of statistical graphics. Statistical Science, 23 (4), 502–535. Available from: https://www.jstor.org/stable/20697655.
- Gambs, S., Killijian, M.-O., and Del Prado Cortez, M.N., 2012. Next place prediction using mobility Markov chains. Proceedings of the First Workshop on Measurement, Privacy, and Mobility - MPM ’12,Bern Switzerland 1–6. doi:10.1145/2181196.2181199.
- Gauthier, J.-A., et al., 2010. 1. Multichannel sequence analysis applied to social science data. Sociological Methodology, 40 (1), 1–38. doi:10.1111/j.1467-9531.2010.01227.x.
- Getz, W.M. and Saltz, D., 2008. A framework for generating and analyzing movement paths on ecological landscapes. Proceedings of the National Academy of Sciences, 105 (49), 19066–19071. doi:10.1073/pnas.0801732105.
- Giannopoulos, I., et al., 2014. Wayfinding decision situations: a conceptual model and evaluation. In: M. Duckham, et al., eds. International Conference on GIScience 2014, Vienna, Austria. Lecture Notes in Computer Science, 8728, 221–234.
- Gill, J.A., Alves, J.A., and Gunnarson, T.G., 2019. Mechanisms driving phenological and range change in migratory species. Philosophical Transactions of the Royal Society B, 374, 20180047. doi:10.1098/rstb.2018.0047
- Glover‐Kapfer, P., Soto‐Navarro, C.A., and Wearn, O., 2018. Camera-trapping version 3.0: current constraints and future priorities for development. Remote Sensing in Ecology and Conservation. doi:10.1002/rse2.106.
- Goldenberg, S.Z., Douglas-Hamilton, I., and Wittemyer, G., 2018. Intergenerational change in African elephant range use is associated with poaching risk, primary productivity and adult mortality. Proceedings of the Royal Society B, 285, 20180286. doi:10.1098/rspb.2018.0286
- Gonzalez, M.C., Hidalgo, C.A., and Barabasi, A.-L., 2008. Understanding individual human mobility patterns. Nature, 453 (5), 779–783. doi:10.1038/nature06958.
- Graser, A., et al., 2018. Untangling origin-destination flows in geographic information systems. Information Visualization, 2018, 1–20. doi:10.1177/1473871617738122
- Gudmundsson, J. and van Kreveld, M., 2006. Computing longest duration flocks in trajectory data. Proceedings of ACM-GIS’06, Nov. 10-11, 8. doi:10.1145/1183471.1183479.
- Hadlak, S., Schumann, H., and Schulz, H.-J., 2015. A survey of multi-faceted graph visualization. STAR – state of the art report. Eurographics Conference on Visualization (EuroVis), Cagliari, Sardinia, Italy.
- Hägerstrand, T., 1970. What about people in regional science? Papers of the Regional Science Association, 24, 7–21. doi:10.1111/j.1435-5597.1970.tb01464.x
- Harris, K.J. and Blackwell, P.G., 2013. Flexible continuous-time modelling for heterogeneous animal movement. Ecological Modelling, 255, 29–37. doi:10.1016/j.ecolmodel.2013.01.020
- Helbing, D., Farkas, I., and Vicsek, T., 2000. Simulating dynamical features of escape panic. Nature, 407, 487–490. doi:10.1038/35035023
- Heupel, M.R., Lédée, E.J.I., and Simpendorfer, C.A., 2018. Telemetry reveals spatial separation of co-occurring reef sharks. Marine Ecology Progress Series, 589, 183–196. doi:10.3354/meps12423
- Hu, Y. and Zhu, D., 2009. Empirical analysis of the worldwide maritime transportation network. Physica A, 388, 2061–2071. doi:10.1016/j.physa.2008.12.016
- Hurst, M., 1969. The structure of movement and household travel behaviour. Urban Studies, 6 (1), 70–82. doi:10.1080/00420986920080051.
- ICARUS Erdbeobachtung mit Tieren, 2019. Icarus is switched on. Available from: https://www.icarus.mpg.de/52254/news_publication_13684039_transferred Accessed 2 Dec 2019.
- Irfan, M. and Tokarchuk, L., 2016. Crowd analysis using visual and non-visual sensors, a survey. 2016 IEEE Global Conference on Signal and Information Processing (GlobalSIP). doi:10.1109/GlobalSIP.2016.7906041.
- Jacoby, D.M.P. and Freeman, R., 2016. Emerging network-based tools in movement ecology. Trends in Ecology & Evolution, 31 (4), 301–314. doi:10.1016/j.tree.2016.01.011.
- Ji, W., White, P.C.L., and Clout, M.N., 2005. Contact rates between possums revealed by proximity data loggers. Journal of Applied Ecology, 42 (3), 595–604. doi:10.1111/j.1365-2664.2005.01026.x.
- Johansson, A., et al., 2012. Crowd and environmental management during mass gatherings. The Lancet, 12 (2), 150–156. doi:10.1016/S1473-3099(11)70287-0.
- Karamshuk, D., et al., 2014. SPoT: Representing the social, spatial and temporal dimensions of human mobility with a unifying framework. Pervasive and Mobile Computing, 11, 19–40. doi:10.1016/j.pmcj.2013.07.011
- Kareiva, P.M. and Shigesada, N., 1983. Analyzing insect movement as a correlated random walk. Oecologia, 56, 234–238. doi:10.1007/BF00379695
- Kenward, R.E., Marcström, V., and Karlbom, M., 1993. Post-nestling behaviour in goshawks, accipiter gentilis: II. sex differences in sociality and nest-switching. Animal Behaviour, 46 (2), 371–378. doi:10.1006/anbe.1993.1199/.
- Kessel, S.T., et al., 2014. A review of detection range testing in aquatic passive acoustic telemetry studies. Reviews in Fish Biology and Fisheries, 24, 199. doi:10.1007/s11160-013-9328-4
- Kie, J.G., et al., 2010. The home-range concept: are traditional estimators still relevant with modern telemetry technology? Philosophical Transactions of Royal Society B, 365, 2221–2231. doi:10.1098/rstb.2010.0093
- Klein, K., et al., 2019. Fly with the flock: immersive solutions for animal movement visualization and analytics. Journal of the Royal Society Interface, 16, 20180794. doi:10.1098/rsif.2018.0794.
- Koenig, S.J., 2018. Making movement matter: modelling connectivity with spatial interaction models. Thesis (PhD) University of Calgary.
- Kölzsch, A., et al., 2013, Visualisation design for representing bird migration tracks in time and space. Workshop on Visualisation in Environmental Sciences (EnvirVis), Jul 2013, Leipzig, Germany. Available from: http://openaccess.city.ac.uk/2384/
- Konzack, M., et al., 2018. Visual exploration of migration patterns in gull data. Information Visualization, 18 (1), 138–152. doi:10.1177/1473871617751245.
- Kulkarni, V., et al., 2019. Examining the limits of predictability of human mobility. Entropy, 21 (4), 432. doi:10.3390/e21040432.
- Langrock, R., et al., 2012. Flexible and practical modeling of animal telemetry data: hidden markov models and extensions. Ecology, 93, 2336–2342. doi:10.1890/11-2241.1
- Laube, P., 2014. Computational movement analysis. Berlin-Heidelberg: Springer Verlag.
- Laube, P., 2015. The low hanging fruit is gone: achievements and challenges of computational movement analysis. SIGSPATIAL Special, 7 (1), 3–10.
- Laube, P. and Purves, R.S., 2011. How fast is a cow? Cross-scale analysis of movement data. Transactions in GIS, 15 (3), 401–418. doi:10.1111/j.1467-9671.2011.01256.x.
- Lédée, E.J.I., et al., 2015. A comparison between traditional kernel-based methods and network analysis: an example from two nearshore shark species. Animal Behaviour, 103, 17e28. doi:10.1016/j.anbehav.2015.01.039
- Leos-Barajas, V., et al., 2017. Analysis of animal accelerometer data using hidden Markov models. Methods in Ecology and Evolution, 8, 161–173. doi:10.1111/2041-210X.12657
- Levin, S.A., 1992. The problem of pattern and scale in ecology. Ecology, 73 (6), 1943–1967. doi:10.2307/1941447.
- Long, J.A., et al., 2014. A critical examination of indices of dynamic interaction for wildlife telemetry studies. Journal of Animal Ecology, 83 (5), 1216–1233. doi:10.1111/1365-2656.12198.
- Long, J.A., et al., 2018. Moving ahead with computational movement analysis. International Journal of Geographical Information Science, 32 (7), 1275–1281. doi:10.1080/13658816.2018.1442974.
- Long, J.A., 2020. WildlifeTG R package. Available from: https://github.com/jedalong/wildlifeTG
- Long, J.A. and Nelson, T.A., 2012. Time geography and wildlife home range delineation. The Journal of Wildlife Management, 76 (2), 407–413. doi:10.1002/jwmg.259.
- Long, J.A. and Nelson, T.A., 2013. Measuring dynamic interaction in movement data. Transactions in GIS, 17 (1), 62–77. doi:10.1111/j.1467-9671.2012.01353.x.
- Long, J.A. and Nelson, T.A., 2015. Home range and habitat analysis using dynamic time geography. The Journal of Wildlife Management, 79 (3), 481–490. doi:10.1002/jwmg.845.
- Marchal, F., Hackney, J., and Axhausen, K.W., 2005. Efficient map matching of large global positioning system data sets. Transportation Research Record: Journal of the Transportation Research Board, 1935, 93–100. doi:10.1177/0361198105193500111
- McNally, M.G., 2007. The four step model. In: Hensher and Button, eds.. Handbook of transport modeling. 2nd ed. Pergamon, Oxford, England.
- Michelot, T., Langrock, R., and Patterson, T.A., 2016. moveHMM: an R package for the statistical modelling of animal movement data using hidden Markov models. Methods in Ecology and Evolution, 7, 1308–1315. doi:10.1111/2041-210X.12578
- Miller, 1991. Modelling accessibility using space-time prism concepts within geographical information systems. International Journal of Geographical Information Science, 5 (3), 287–301. doi:10.1080/02693799108927856.
- Miller, 2005. A measurement theory for time geography. Geographical Analysis, 37, 17–45. doi:10.1111/j.1538-4632.2005.00575.x
- Miller, D.S., Miller, J., and Bohrer, G., 2019. Towards an integrated science of movement: converging research on animal movement ecology and human mobility science. International Journal of Geographical Information Science, 33 (5), 855–876. doi:10.1080/13658816.2018.1564317.
- Miller, H.J., Jaegal, Y., and Raubal, M., 2020. Measuring the geometric and semantic similarity of space–time prisms using temporal signatures. Annals of the American Association of Geographers, 109 (3), 730–753. doi:10.1080/24694452.2018.1484686.
- Miller, H.J. and Shaw, S.-J., 2015. Geographic information systems for transportation in the 21st century. Geography Compass, 9 (4), 180–189. doi:10.1111/gec3.12204.
- Miller, H.J. and Shaw, S.-L., 2001. Geographic information systems for transportation: principles and applications. New York: Oxford University Press.
- Moorcroft, P.R., Lewis, M.A., and Crabtree, R.L., 2006. Mechanistic home range models capture spatial patterns and dynamics of coyote territories in Yellowstone. Proceedings of the Royal Society B, 273, 1651–1659. doi:10.1098/rspb.2005.3439
- Munden, R., et al., 2018. Making sense of ultrahigh‐resolution movement data: a new algorithm for inferring sites of interest. Ecology and Evolution, 9 (1), 265–274. doi:10.1002/ece3.4721.
- Nanni, M. and Pedreschi, D., 2006. Time-focused clustering of trajectories of moving objects. Journal of Intelligent Information Systems, 27, 267–289. doi:10.1007/s10844-006-9953-7
- Natarajan, A., Motani, M., and Srinivasan, V., 2007. Understanding urban interactions from bluetooth phone contact traces. In: S. Uhlig, K. Papagiannaki, and O. Bonaventure, eds.. Passive and Active network measurement. Berlin Heidelberg: Springer, 115–124.
- Nathan, R., et al., 2008. A movement ecology paradigm for unifying organismal movement research. Proceedings of the National Academy of Sciences, 105 (49), 19052–19059. doi:10.1073/pnas.0800375105.
- Nayan, N., Sahu, S.S., and Kumar, S., 2019. Detecting anomalous crowd behavior using correlation analysis of optical flow. Signal, Image and Video Processing, 13 (6), 1233–1241. doi:10.1007/s11760-019-01474-9.
- O’Sullivan, D. and Perry, G.L.W., 2013. Spatial simulation: exploring pattern and process. Chichester, UK: John Wiley & Sons, Ltd. doi:10.1002/9781118527085
- Oliver, N., et al., 2020. Mobile phone data for informing public health actions across the COVID-19 pandemic life cycle. Science Advances, eabc0764. doi:10.1126/sciadv.abc0764.
- Openshaw, S., 1984. The modifiable areal unit problem. GeoBooks.Norwich, England.
- Otis, D.L., et al., 1978. Statistical inference from capture data on closed animal populations. Wildlife Monographs, 3–135. Available from: https://www.jstor.org/stable/3830650.
- Oudman, T., et al., 2020. Young birds switch, but old birds lead: how barnacle geese adjust migratory habits to environmental change. Frontiers in Ecology and Evolution, 7, 502. doi:10.3389/fevo.2019.00502.
- Papacharalampous, A.E., 2014. Aggregated GSM data in origin destination studies. Thesis (MSc), Transport and Planning department, Civil Engineering and Geosciences faculty, Technical University of Delft.
- Papastamatiou, Y.P., et al., 2018. Activity seascapes highlight central place refuging strategies in marine predators that never stop swimming. Movement Ecology, 6, 9. doi:10.1186/s40462-018-0127-3
- Parent, C., et al., 2013. Semantic trajectories modeling and analysis. ACM Computing Surveys, 45 (4), Article 42. doi:10.1145/2501654.2501656.
- Patterson, Z. and Farber, S., 2015. Potential path areas and activity spaces in application: a review. Transport Reviews, 35 (6), 679–700. doi:10.1080/01441647.2015.1042944.
- Pelekis, N., et al., 2012. Visually exploring movement data via similarity-based analysis. Journal of Intelligent Information Systems, 38 (2), 343–391. doi:10.1007/s10844-011-0159-2.
- Pelekis, N. and Theodoridis, Y., 2014. Mobility data mining and knowledge discovery. In: N. Pelekis and N. Theodoridis, eds.. Mobility data management and exploration, 143-167. New York, NY: Springer. doi:10.1007/978-1-4939-0392-4_7.
- Pequet, D.J., 1994. It’s about time: a conceptual framework for the representation of temporal dynamics in GISystems. Annals of the Association of American Geographers, 84 (3), 441–461. doi:10.1111/j.1467-8306.1994.tb01869.x.
- Pettorelli, N., et al., 2014. Satellite remote sensing for applied ecologists: opportunities and challenges. Journal of Applied Ecology, 2015, 839–848. doi:10.1111/1365-2664.12261
- Powell, R.A. and Mitchell, M.S., 2012. What is a home range? Journal of Mammalogy, 93 (4), 948–958.
- Prato, C.G., 2009. Route choice modeling: past, present and future research directions. Journal of Choice Modelling, 2 (1), 65–100. doi:10.1016/S1755-5345(13)70005-8.
- Purves, R.S., et al., 2014. Moving beyond the point: an agenda for research in movement analysis with real data. Computers, Environment and Urban Systems, 47, 1–4. doi:10.1016/j.compenvurbsys.2014.06.003
- Qiao, Y., et al., 2017. A mobility analytical framework for big mobile data in densely populated area. IEEE Transactions on Vehicular Technology, 66 (2), 1443–1455. doi:10.1109/TVT.2016.2553182.
- Rai, R., Balmer, M., and Rieser, M., 2007. Capturing human activity spaces: new geometries. Journal of the Transportation Research Board, 2021, 70–80. doi:10.3141/2021-09
- Robinson, A.C., et al., 2017. Geospatial big data and cartography: research challenges and opportunities for making maps that matter. International Journal of Cartography, 3 (1), 32–60. doi:10.1080/23729333.2016.1278151.
- Roche, D.G., et al., 2015. Public data archiving in ecology and evolution: how well are we doing? PLoS Biology, 13 (11), e1002295. doi:10.1371/journal.pbio.1002295.
- Roy, J.R. and Thill, J.-C., 2005. Spatial interaction modelling. Papers in Regional Science, 83 (1), 339–361. doi:10.1007/s10110-003-0189-4.
- Royle, J.A., et al., 2013. Spatial capture-recapture. Academic Press, Amsterdam, The Netherlands.
- Rutz, C., et al., 2020. COVID-19 lockdown allows researchers to quantify the effects of human activity on wildlife. Nature Ecology and Evolution, 4, 1156–1159. doi:10.1038/s41559-020-1237-z
- Safi, K., et al., 2013. Flying with the wind: scale dependency of speed and direction measurements in modelling wind support in avian flight. Movement Ecology, 1 (1), 4. doi:10.1186/2051-3933-1-4.
- Sekulić. S., Long, J.A., and Demšar U. 2018. The effect of geographical distance on community detection in flow networks. Proceedings of the AGILE 2018 conference, Lund, Sweden, 12–15 June 2018.
- Shamoun-Baranes, J., et al., 2014. Continental-scale radar monitoring of the aerial movements of animals. Movement Ecology, 2:9. doi:10.1186/2051-3933-2-9.
- Siła-Nowicka, K., et al., 2016. Analysis of human mobility from GPS trajectories and contextual information. International Journal of Geographic Information Science, 30 (5), 881–906. doi:10.1080/13658816.2015.1100731.
- Siła-Nowicka, K. and Fotheringham, A.S., 2019. Calibrating spatial interaction models from GPS tracking data: an example of retail behaviour. Computers, Environment and Urban Systems, 74, 136–150. doi:10.1016/j.compenvurbsys.2018.10.005
- Simpendorfer, C.A., Heupel, M.R., and Hueter, R.E., 2002. Estimation of short-term centers of activity from an array of omnidirectional hydrophones and its use in studying animal movements. Canadian Journal of Fisheries and Aquatic Sciences, 59, 23–32. doi:10.1139/F01-191
- Sîrbu, A., et al., 2020. Human migration: the big data perspective. International Journal of Data Science and Analytics. doi:10.1007/s41060-020-00213-5.
- Slingsby, A. and van Loon, E.E., 2017, Temporal tile-maps for characterising the temporal occupancy of places: a seabird case study. Proceedings of the Geographical Information Science Research UK Conference (GISRUK 2017), 18 Apr 2017-21 Apr 2017, Manchester, UK. Available from: http://openaccess.city.ac.uk/17398/
- Smolak, K., et al., 2020. Applying human mobility and water consumption data for short-term water demand forecasting using classical and machine learning models. Urban Water Journal, 17 (1), 32–43. doi:10.1080/1573062X.2020.1734947.
- Song, C., et al., 2010a. Modelling the scaling properties of human mobility. Nature Physics, 6 (10), 818–823. doi:10.1038/nphys1760.
- Song, C., et al., 2010b. Limits of predictability in human mobility. Science, 327, 1018–1021.
- Spaccapietra, S., et al., 2008. A conceptual view on trajectories. Data & Knowledge Engineering, 65 (1), 126–146. doi:10.1016/j.datak.2007.10.008.
- Stahl, B.C. and Wright, D., 2018. Ethics and privacy in AI and big data: implementing responsible research and innovation. IEEE Security & Privacy, 16 (3), 26–33. doi:10.1109/MSP.2018.2701164.
- Stienen, E., et al., 2016. GPS tracking data of lesser black-backed gulls and herring gulls breeding at the southern North Sea coast. ZooKeys, 555, 115–124. doi:10.3897/zookeys.555.6173.
- Sumpter, D.J.T., 2006. The principles of animal collective behaviour. Philosophical Transactions of the Royal Society B, 361, 5–22. doi:10.1098/rstb.2005.1733
- Tang, W. and Bennett, D.A., 2010. Agent-based modeling of animal movement: a review. Geography Compass, 4 (7), 682–700. doi:10.1111/j.1749-8198.2010.00337.x.
- Tarroux, A., et al., 2016. Flexible flight response to challenging wind conditions in a commuting Antarctic seabird: do you catch the drift? Animal Behaviour, 113, 99–112. doi:10.1016/j.anbehav.2015.12.021
- Technitis, G., et al., 2015. From A to B, randomly: a point-to-point random trajectory generator for animal movement. International Journal of Geographical Information Science, 29 (6), 912–934. doi:10.1080/13658816.2014.999682.
- Thurfjell, H., Ciuti, S., and Boyce, M.S., 2014. Applications of step-selection functions in ecology and conservation. Movement Ecology, 2 (1), 4. doi:10.1186/2051-3933-2-4.
- Tobler, W.R., 1987. Experiments in migration mapping by computer. The American Cartographer, 14 (2), 155–163. doi:10.1559/152304087783875273.
- Toch, E., et al., 2018. Analyzing large-scale human mobility data: a survey of machine learning methods and applications. Knowledge and Information Systems, 58, 501–523. doi:10.1007/s10115-018-1186-x
- Tracey, J.A., et al., 2014. Movement-based estimation and visualization of space use in 3D for wildlife ecology and conservation. PloS One, 9 (7), e101205. doi:10.1371/journal.pone.0101205.
- Tranos, E., Gheasi, M., and Nijkamp, P., 2015. International migration: a global complex network. Environment and Planning. B, Planning & Design, 42 (1), 4–22. doi:10.1068/b39042.
- Van Nieuland, S., Baetens, J.M., and De Baets, B., 2016. Spatially explicit modelling of the belgian major endurance event `the 100 km dodentocht’. PLoS ONE, 11 (10), e0164981. doi:10.1371/journal.pone.0164981.
- Versichele, M., et al., 2012. Mobile mapping of sporting event spectators using bluetooth sensors: tour of Flanders 2011. Sensors, 12 (10), 14196–14213. doi:10.3390/s121014196.
- Wang, J., et al., 2019. An extended exploration and preferential return model for human mobility simulation at individual and collective levels. Physica A: Statistical Mechanics and Its Applications, 121921. doi:10.1016/j.physa.2019.121921.
- Warren, W.H., 2018. Collective motion in human crowds. Current Directions in Psychological Science, 27 (4), 232–240. doi:10.1177/0963721417746743.
- Westerholt, R., Mocnik, F.-B., and Comber, A., 2019. A place for place: modelling and analysing platial representations. Transactions in GIS, 24 (4), 811–818. doi:10.1111/tgis.12647.
- Wiener, J.M., Büchner, S.J., and Hölscher, C., 2009. Taxonomy of human wayfinding tasks: a knowledge-based approach. Spatial Cognition and Computation, 9 (2), 152–165.
- Wikelski, M., Davidson, S.C., and Kays, R., 2020. Movebank: archive, analysis and sharing of animal movement data. Hosted by the Max Planck Institute of Animal Behavior. Available from: www.movebank.org, [Accessed 29 Jun 2020].
- Wilkinson, M., et al., 2016. The FAIR guiding principles for scientific data management and stewardship. Scientific Data, 3, 160018. doi:10.1038/sdata.2016.18.
- Williams, H., et al., 2017. Identification of animal movement patterns using tri-axial magnetometry. Movement Ecology, 2017 (5), 6. doi:10.1186/s40462-017-0097-x.
- Williams, H.J., et al., 2020. Optimising the use of bio-loggers for movement ecology research. Journal of Animal Ecology. doi:10.1111/1365-2656.13094.
- Wood, J., Dykes, J., and Slingsby, A., 2010. Visualisation of origins, destinations and flows with OD maps. The Cartographic Journal, 47 (2), 117–129. doi:10.1179/000870410X12658023467367.
- Xiao, N. and Chun, Y., 2009. Visualising migration flows using kriskograms. Cartography and Geographic Information Science, 36 (2), 183–191. doi:10.1559/152304009788188763.
- Yan, Z., et al., 2013. Semantic trajectories: mobility data computation and annotation. ACM Transactions on Intelligent Systems and Technology, 4 (3), Article 49. doi:10.1145/2483669.2483682.
- Zein, B., et al., 2019. Time and tide: seasonal, diel and tidal rhythms in Wadden Sea Harbour porpoises (Phocoena phocoena). PloS One, 14 (3), e0213348. doi:10.1371/journal.pone.0213348.
- Zeng, S., et al., 2017. Predictability and prediction of human mobility based on application-collected location data. In 2017 IEEE 14th International Conference on Mobile Ad Hoc and Sensor Systems (MASS), 28–36. IEEE. doi:10.1109/MASS.2017.