
 ?Mathematical formulae have been encoded as MathML and are displayed in this HTML version using MathJax in order to improve their display. Uncheck the box to turn MathJax off. This feature requires Javascript. Click on a formula to zoom.
ABSTRACT
Although it is acknowledged that urban inequalities can lead to biases in the production of social media data, there is a lack of studies which make an assessment of the effects of intra-urban movements in real-world urban analytics applications, based on social media. This study investigates the spatial heterogeneity of social media with regard to the regular intra-urban movements of residents by means of a case study of rainfall-related Twitter activity in São Paulo, Brazil. We apply a spatial autoregressive model that uses population and income as covariates and intra-urban mobility flows as spatial weights to explain the spatial distribution of the social response to rainfall events in Twitter vis-à-vis rainfall radar data. Results show high spatial heterogeneity in the response of social media to rainfall events, which is linked to intra-urban inequalities. Our model performance () provides evidence that urban mobility flows and socio-economic indicators are significant factors to explain the spatial heterogeneity of thematic spatiotemporal patterns extracted from social media. Therefore, urban analytics research and practice should consider not only the influence of socio-economic profile of neighborhoods but also the spatial interaction introduced by intra-urban mobility flows to account for spatial heterogeneity when using social media data.
1. Introduction
Social media platforms have enabled the generation of spatial information in an unprecedented way. Through the use of mobile phones, people are able to post messages about their experiences, feelings, and perceptions of real-world phenomena. The analysis of social media data through the intense use of social media platforms in towns and cities, has been found to be a promising way of studying human activities and natural phenomena alike. In light of this, researchers have seized on the opportunity to use social media data in a wide range of domains, such as the detection, monitoring and recognition of natural hazards (e.g. floods and typhoons), humanitarian crises (e.g. outbreaks of epidemic diseases), and to assist in urban planning (e.g. restricted mobility and traffic jams) – see Said et al. (Citation2019), Martí et al. (Citation2019), Martínez-Rojas et al. (Citation2018), Nummi (Citation2017) and Steiger et al. (Citation2015a).
Most of the empirical literature that employs social media data has focused on investigating the relationships between social media data and real-world phenomena. This involves extracting aggregated, thematic, spatiotemporal patterns from social media activity which have often been used as proxies for a variable of interest and correlated with conventional data sources (e.g. physical sensors and survey data). In other words, previous work has shown that the intensity with which people are posting/discussing in social media about a real-world phenomenon (e.g. a flooding event) is correlated with the intensity of the phenomenon as measured by conventional data sources (e.g. river level gauges, as in de Albuquerque et al. (Citation2015)). However, one challenge arising from this type of analysis in complex urban environments is that social media activity is spatially heterogeneous and influenced by several exogenous factors such as socio-economic inequalities (Shelton et al. Citation2014, Malik et al. Citation2015, Sloan Citation2017, Jiang et al. Citation2019), the complexity of the urban topology and social structures (Steiger et al. Citation2015a, Rzeszewski and Beluch Citation2017). In fact, several research studies have established that the spatial distribution of social media data in towns and cities varies in accordance with factors such as geodemographics (Li et al. Citation2013, Xiao et al. Citation2015, Longley and Adnan Citation2016) and urban mobility (Jurdak et al. Citation2015, Manca et al. Citation2017, Rodríguez et al. Citation2020). Correspondingly, the level of correlation between social media activity and an urban phenomenon of interest is likely to be spatially heterogeneous, i.e. the reliability of social media activity as a proxy for a given phenomenon may vary significantly across the urban space.
Although this spatial heterogeneity of social media activity is generally acknowledged, the quantification of the effects of specific intra-urban inequalities (e.g. socio-demographic and/or mobility profiles of neighborhoods) to a given urban phenomenon of interest is a challenging task. There is often a lack of external reference data which could be used to establish how the intensity of the relationship between social media activity and a phenomenon of interest varies across the urban space. As a result, there is a risk that spatial patterns extracted from social media as a proxy for urban phenomena may be significantly biased in favor of more wealthy and digitally inclusive areas of cities (Sloan Citation2017) when these data are used for applications such as urban planning, crisis and emergency management, and real-time urban modeling (Imran et al. Citation2015, Nummi Citation2017, Smith et al. Citation2017).
In seeking to address this important knowledge gap around the use of social media as a proxy to study real-world phenomena, this article quantifies the spatial heterogeneity of social media activity with regard to intra-urban inequality. We adopt a broad perspective of intra-urban inequalities that includes intra-urban mobility flows (i.e. regular journeys made by residents from one city area to another), so as to understand the urban dynamics that influence social media activity. This adds to the conventional geodemographic factors (e.g. census data) used in previous studies, which are restricted to night-time residency (i.e. locations where people live in the sense of a night-time census). Our approach is based on the assumption that the use of intra-urban mobility flows can enable us to take into account the ‘daytime mobility’ of social media users within an urban area and thus provides a good estimation of inner-city connectivity in terms of ‘exchange of people’, which in turn influences the spatial distribution of social media activity. Previous empirical research have shown that social media users leave digital footprints while they post messages from different locations, including functional and residential areas and workplaces (Steiger et al. Citation2015b, Lansley and Longley Citation2016). This suggests that the spatial distribution of social media activity can be explained in function of urban mobility patterns such as regular journeys between different neighborhoods.
To investigate how these kinds of intra-urban inequalities can influence the extent to which social media data accurately reflects a phenomenon of interest, we take the thematic activity related to rainfall as a reference point. This choice has a threefold rationale: first, the fact that rainfall is a physical phenomenon enables us to use reference data from weather radars to provide reliable reference data that is fairly granular across urban space. Second, previous work (de Andrade et al. Citation2017, Citation2018, Restrepo-Estrada et al. Citation2018) provides evidence that there is a significant level of activity in social media directly and indirectly related to rainfall in a number of scenarios (i.e. in a synchronized and unsynchronized way with extreme rainfall episodes). Third, an understanding of the responses to rainfall in social media can offer us useful insights into people’s digital practices which can be used to assist in flood risk management (e.g. early warning and response systems for disasters caused by extreme rainfall events). This can be particularly useful in data-scarce urban environments where accurate and granular rainfall data may be unavailable.
This study thus raises the following research questions:
i) To what extent do thematic, spatiotemporal patterns of social media activity reflect rainfall events in different intra-urban areas?
ii) Can socio-economic indicators (e.g. population and income) and intra-urban mobility flows explain the spatial heterogeneity of the spatiotemporal social media responses to rainfall events?
To address these questions, this paper conducts an analysis of the Twitter activity related to rainfall in the city of São Paulo, Brazil, where there is an urban environment with a high degree of intra-urban inequality between different neighborhoods (Haddad and NedovićBudić Citation2006). We derive time series datasets from Twitter and compare them with rainfall radar data. The effects of intra-urban inequality are investigated by adapting a spatial autoregressive model with socio-economic indicators as covariates and the number of incoming/outgoing journeys as spatial weights.
The remainder of this paper is structured as follows: Section 2 provides an overview of the literature on the heterogeneous nature of social media activity; Section 3 describes the study area and datasets; Section 4 outlines our analytical framework to determine the spatial heterogeneity of the social media response to rainfall events; Section 5 reports the results, followed by a discussion (Section 6); finally, Section 7 summarizes the conclusion.
2. The heterogeneous nature of social media activity
Spatial heterogeneity is a key factor in spatial analysis that is related to ‘the lack of stability over space of […] relationships under study […] and this implies that functional forms and parameters vary with location and are not homogeneous throughout the dataset’ (Anselin Citation1988). This kind of spatial variation may have a greater degree of complexity in social media data than is the case with other datasets. The reason for this may be that a part of the spatial heterogeneity here is the result of bias in the way social media users handle their data. Their practices vary in different types of social media platforms and over time as well as depending on the user, and means that even data within confined areas might be non-stationary with regard to means, variances, and acquisition scales (Westerholt et al. Citation2015, Citation2016, Westerholt Citation2018, Rzeszewski Citation2018). The spatial distribution of social media activity is thus uneven across the study area and varies between places that are nearby because of local factors, such as topography, demographics, and socio-economic status (Li et al. Citation2013, Ballatore and De Sabbata Citation2020).
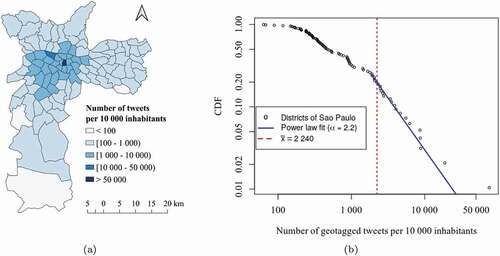
shows the spatial distribution that is mapped by Twitter data in different districts of São Paulo. It is feasible to have an uneven spatial distribution by following a power law as a possible model for describing the frequency of geotagged tweets in the districts ()). From an inter-district analysis, this means there are much more districts with few geotagged tweets than districts with a lot of geotagged tweets. Geotagged tweets here correspond to those that have GPS (Global Positioning System) coordinates attached from the user’s mobile device. As can be seen from ), only 19% of the districts contain tweet counts greater than or equal to the mean of the distribution (), while 81% of the districts contribute below average. Similar probability distributions have been described in many social media studies (Jiang and Miao Citation2015, Wang et al. Citation2018, Rzeszewski Citation2018, Arthur and Williams Citation2019).
Figure 1. Overview of the tweets analyzed in this article. The tweets originate from Sao Paulo, Brazil, and cover the period from 7 November 2016 to 14 June 2017. (a) The density of geotagged tweets per 10000 inhabitants aggregated into districts. (b) The power law distribution of the density of geotagged tweets per 10000 inhabitants. The coefficient of the distribution () was estimated by the maximum likelihood estimation (MLE) as described in Gillespie (Citation2015) and available in
R package. CDF corresponds to the cumulative distribution function. The black circles, blue line and red dotted line represent the city districts, the power law fit and the mean of the distribution, respectively
However, the power law probability distribution does not explain the spatial heterogeneity of social media activity since it is neither able to diagnose nor quantify the (dis)contiguity of the districts that share similar frequencies of geotagged tweets. One common approach to spatial heterogeneity is to assess the spatial autocorrelation between adjacent areal units. Spatial autocorrelation quantifies the second-order characteristics of a spatial process and can be based on assumptions of spatial covariance (Moran’s I), and spatial differences (Geary’s c), among others factors (Getis Citation2007). Nonetheless, spatial heterogeneity is manifested in different response functions or systematically varying parameters across space (e.g. heteroskedasticity, random spatial anisotropy, nugget effects, coefficient variation, spatially adaptive regressions, and spatial arrangement configurations) and a single-item global measure may not accurately assess outcomes at particular locations (Anselin Citation1988). To address this limitation, local spatial autocorrelation measures are used to disclose spatial heterogeneity, such as Local Moran’s I (Anselin Citation1995), Local Geary’s c (Getis and Ord Citation1992) and Local Spatial Heteroscedasticity (LOSH) (Ord and Getis Citation2012). Although these statistics only provide fragmentary evidence of spatial heterogeneity, it is still necessary to investigate why this effect occurs and what factors influence it.
Many studies report that demographic and socio-economic factors, and cultural and ethnic groups can influence social media activity. There is, for instance, a correlation between the frequency of tweets and the percentage of well-educated people possessing a postgraduate degree and earning a good salary, and Flickr data density and the percentage of Asian and white people in the United States (Li et al. Citation2013). In addition, (i) Twitter users tend to be male and are predominantly younger than the overall UK population, (ii) certain occupational groups are more likely to use Twitter than others (Longley et al. Citation2015, Sloan Citation2017); and (iii) a higher volume of tweets are reported in central urban areas than in most suburban areas (Longley and Adnan Citation2016). In general, these works provide evidence that younger, more affluent, and well-educated people, in places with a better social infrastructure, are more involved with the production of social media data. However, this is highly context-dependent, as recent research in the UK geodemographic context has showed that tweets tend to be located in denser and more deprived areas in Greater London (Ballatore and De Sabbata Citation2020).
Several cases of non-linear relationships have also been described in the literature. Xiao et al. (Citation2015) argued that there was an inverse U-shaped relationship between the number of tweets that referred to Hurricane Sandy and factors such as housing and personal income. An inverse U-shaped relationship is characterized by increasing at first before declining again when the factor reaches a peak. This suggests there is a rise in the number of social media users that corresponds to their greater affluence, although this only reaches a certain point, after which there is a decline in involvement. This can probably be attributed to the ‘digital divide’ (i.e. social and economic division between those who have access to computer technology and those who do not) and degree of motivation in different social classes (depending on their economic status). In addition to this, they show that there was a linear relationship between the number of tweets and the size of the residential community, except in the case of at landmark sites (e.g. green spaces, large public parks, and airports) where the presence of tourists and visitors is likely to increase the number of messages.
Although previous studies have advanced our understanding of the spatial distribution and heterogeneity of social media activity through demographic and socio-economic factors, these only described the social media dynamics from the standpoint of the residential population. Among these factors, population size and income have been found to be the dominant driving forces. In particular, these variables have been found to be the major determinants of intra-urban inequality in Brazilian cities such as São Paulo (Haddad and NedovićBudić Citation2006). Nonetheless, as explained in Section 1, we expect that if full account is taken of how people move around the city, this reference model that includes only geodemographic characteristics of the residential population can be improved. Moreover, a model that uses only population size and income as explanatory variables can be used as a baseline to validate our proposed model (see Section 4) that also uses intra-urban journeys obtained from mobility surveys for modeling the spatial interaction of social media activity. Another issue addressed in this work is how to take account of the increased heterogeneity attached to tweets that reflect particular topics, like rainfall. Tweets on these topics are often scattered over urban space. In view of this, we have designed a spatial autoregressive model that takes full account of the spatial nature of the phenomenon under study and investigates the heterogeneous distribution of rainfall-related patterns extracted from Twitter data, where these patterns reflect precipitation events.
3. Materials
3.1. Study area
The study area is the city of São Paulo, which often experiences flash floods, inundations, and flooding caused by excessive rainfall during the rainy season/warmer months (from December to March). São Paulo is an important political and economic center that is home to more than 12 million inhabitants from different ethnic and social backgrounds (IBGE Citation2010), making it the most densely populated city in Brazil and a reasonable site for geodemographic and socio-economic studies. More important, is the availability of reliable open access data about inter- and intra-zonal population flows and rainfall rates within the city. While the inter/intra-zonal flows allow us to study human dynamics at the level of traffic zones (i.e. the fluctuating movement of commuters within the city), the rainfall rates allow us to compare rainfall-related social media activity with data about actual rainfall phenomena. In addition, São Paulo features one of the largest Twitter communities in South America, which is another factor that benefits our study.
3.2. Datasets
3.2.1. Demographic and socio-economic data
The socio-economic and demographic data were taken from the Brazilian Census (Citation2010), which is upgraded by the Brazilian Institute of Geography and Statistics every 10 years. The survey tracks 320 census tracts within the city of São Paulo with regard to more than 400 demographic and socio-economic variables, including qualitative and quantitative information (e.g. population, income, education and well-being). Census tracts are polygonal areas designed by the IBGE to improve the reporting of statistics for small areas in Brazil. They range in size and shape in accordance with a methodology that defines administrative and political boundaries, urban and rural districts, and environmental protection areas, in addition to operational factors such as the data collection process.
3.2.2. Mobility data
The mobility data were taken from the Metrô Origin & Destination Survey (Citation2017) – São Paulo Metropolitan Region, which, since 1967, has been regularly conducted every 10 years Metro2017. The mobility dataset used in our study is derived from a cross-sectional survey taken in the year of 2017, which is openly available. Although this survey is conducted by the public company responsible for subway lines (Metro), it covers a broad range of transport modalities and motives by dividing the metropolitan area of São Paulo into 460 traffic zones and surveying residents in these areas about their regular travel habits. The dataset includes more than 42 million mobility flows which are characterized by origin and destination zones, reason for the trip (e.g. business or education) and the modality of travel (e.g. motorized or non-motorized, using public or private transport, including details on the mode of transportation such as walking, cycling, subway, etc.). In our study, account is taken of all the reasons for trips and modes of travel, i.e. all the mobility flows available. Since the Origin-Destination (OD) survey is an instrument designed for characterizing urban dynamics, these flows can also provide a better understanding of the influence of intra-urban mobility in the social media activity.
3.2.3. Twitter data
The Twitter data used in this study includes a sample of 21 521 713 million public and unique tweets collected through the Twitter Streaming API from two bounding boxes ([−46.96, −23.62, −46.26, −23.21)], [(−46.96,-24.11, −46.26, −23.62]) during the period from 7 November 2016 to 14 June 2017 (with some daily gaps in the data collection caused by technical issues like server downtimes). The two bounding boxes used cover the entire city of São Paulo. The number of geotagged tweets (i.e. those that have GPS coordinates) corresponds to 7.65% of the total number of tweets sampled (1 648 398 geotagged tweets), of which only 1 214 611 geotagged tweets were contained within the city of São Paulo. Although it is only a small fraction of the geotagged tweets within the city (5.64%), other recent studies on urban social media analytics report a similar percentage of geotagged messages (Li et al. Citation2013, Arthur and Williams Citation2019). Still, for the purpose of our case study, the number of geotagged tweets was substantially reduced by applying a keyword-based filtering approach as described in Section 4.
Twitter data is susceptible to bots that automatically produce a vast number of tweets and retweets. The identification of bots is complex since the boundary between human-like and bot-like behavior is increasingly fuzzy. Several debatable criteria and algorithms to discriminate bots from humans have been proposed in literature. Ferrara et al. (Citation2016) suggest ‘bots retweet more than humans and have longer user names, while they produce fewer tweets, replies and mentions, and they are retweeted less than humans’. Arthur and Williams (Citation2019) argued bots can be identified by anomalously high levels of messages (e.g. user accounts whose activity makes up more than 1% of the total number of tweets). We took these two criteria into account and performed an analysis of the 88 263 user profiles contained in our dataset. No potential bot was found. Nonetheless, sophisticated bots may emulate human behavior so as to elude these criteria, so there is a residual threat that tweets from such bots may be present in our dataset.
3.2.4. Rainfall data
Rainfall data based on weather radar measurements were supplied by the Water and Power Department and the Hydraulics Technology Foundation Center (Brazil) at the Polytechnic School of the University of São Paulo. The weather radar, which is located about 70 km from the city of São Paulo, operates by giving continuous estimates of rainfall rates by means a 250-meter spatial resolution that has an azimuthal width of 1 degree and a temporal resolution of 5 min (Selex Citation2015). However, instead of using the polar rain yields, we used a radar product known as Surface Rain Intensity, which is designed in a cartesian coordinate of a 500 × 500 meter scale. This provides a better alignment of the rainfall-related responses to weather data taken from Twitter.
4. Methodology
shows an overview of the analysis framework that we use to investigate the spatial heterogeneity of the social media response to rain events. The framework comprises five main analysis routines and one validation procedure, all of which are described below.
Figure 2. Overview of the analysis framework to investigate the spatial heterogeneity of the social media response to rainfall events from Twitter activity. Boxes with solid frames represent the main analytical steps, while the dashed line boxes represent the validation procedure. The arrows represent the data flows
4.1. Filtering rain-related geotagged tweets
The geotagged tweets were filtered on the basis of the following Brazilian keywords related to rainfall: ‘chuva’, ‘chove’, ‘chuvoso’, ‘chuvosa’, and ‘chuvarada’. These general keywords are less spatially and temporally volatile than more local and idiosyncratic terms specifically related to the city of São Paulo (e.g. ‘garoa’ and ‘tempestade’). Our selected keywords thus have the potential to retrieve a sufficient number of true-positive (but only a few true-negative) Twitter messages (de Andrade et al. Citation2018). True-positive tweets are referred to as those that contain at least one keyword whose meaning is linked directly to the rainfall phenomenon; otherwise, if the textual content of tweets shares one or more keywords where none of the meanings is linked to rainfall, the tweets are referred to as true-negative.
Furthermore, our filtering strategy prioritizes precision over recall, since those Twitter messages related to rainfall that do not share any of the keywords used go unnoticed within the filtering process. For example, the message ‘pé d’água’ does not contain any of the keywords, but Brazilians refer to it as a waterspout or storm. In fact, more messages could be retrieved by including further keywords in our filtering strategy, or using more sophisticated methods such as natural language processing (Liu et al. Citation2018, de Bruijn et al. Citation2020). Despite the uncertainty about which (and how many) keywords to use in a keyword-based filtering approach, the chosen keywords achieved very good degree of precision based on our previous work (de Andrade et al. Citation2018). After applying our filtering strategy, a total number of 4 238 geotagged rainfall-related tweets are left for our analysis, which corresponds to a 0.34% share of all the tweets harvested within the city.
4.2. Determining an areal unit of analysis
Since the Twitter activity is not confined within political and administrative boundaries, the study area was partitioned into 30-km2 hexagonal grid cells. This type of areal unit was chosen on the basis of our previous work, where a multicriteria optimization framework was used to reduce the variance in the strength of spatial patterning found within geotagged tweets that reflect rainfall (de Andrade et al. Citation2020). Other areal unit shapes are certainly possible, such as square shapes. Nonetheless, hexagonal units reduce the visual field bias when compared with the squared units (Carr et al. Citation1992). As a result, it was found that a hexagonal grid achieved more consistent results than other possible choices of spatial units. We have used the same multicriteria optimization framework with 1 000 resamplings, each with a replacement, to assess units of hexagonal shapes of 5 km2, ranging from 10 to 100 km2 every 10 km2, and 200 km2 and determine the most suitable scale for our analysis. In this way, we found that the 30-km2 grid size was better than the other choices with regard to recurrence within the Pareto principle applied to spatial autocorrelation indexes. There are other methods that can determine an areal unit (Fotheringham Citation1989, Dark and Bram Citation2007). However, our approach attenuates the impact of the well-known Modified Areal Unit Problem (MAUP), which is why we have decided to apply the framework outlined above. MAUP is a statistical biasing effect that occurs for all quantitative studies involving data aggregation into areal units (Dark and Bram Citation2007). Nonetheless, even with our approach, MAUP cannot be avoided completely. All the results should thus be interpreted with a degree of caution.
4.3. Spatial data harmonization and time series
The use of 30-km2 hexagonal grid cells requires us to harmonize the different datasets employed in this study. This harmonization step included both a spatial and temporal alignment, and all the individual steps needed to achieve this are outlined below.
4.3.1. Deriving time series
Two times series (formed on the basis of the rain-related geotagged tweets, as well as the weather radar measurements) are derived for each areal unit of 30 km2 on a one-day scale (). The relative daily frequency of rain-related geotagged tweets is placed beside the frequency of rainfall events using
Figure 3. A sample of daily rainfall (top) and the frequency of rain-related tweets (bottom) from 7 November 2016 to 14 June 2017 for a particular areal unit located in the city center (k = 46)
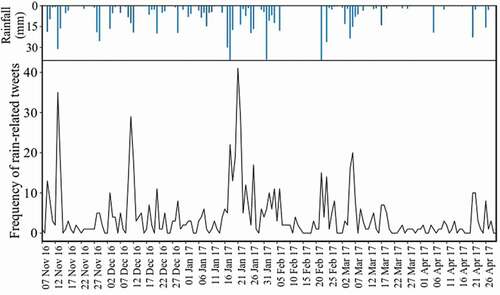
whereby corresponds to the number of geotagged tweets related to a rainfall event that fall into the spatial unit
. Likewise,
refers to the total number of geotagged tweets in the spatial unit
. Corresponding hexagonal grids are calculated for each day. The
measurement is thus the relative daily frequency of geotagged tweets related to rainfall events that occured within the spatial unit
on a particular day of the observation period.
The daily rainfall time series for each spatial unit of 30 km2 was expressed by EquationEquation (2)(2)
(2) .
where corresponds to the sum of the rainfall estimates of point-matrix that overlaps the
area,
is the number of points that overlap the
area, and
is the daily rainfall estimate within the spatial unit
. The mean value was used instead of spatial interpolation since the distance between the measurement points is equidistant (Selex Citation2015).
4.3.2. Aggregating incompatible areal data
The traffic zones, census tracts, and areal units of 30 km2 are incompatible zoning systems (). Furthermore, spatial data harmonization suffers from the polygonal overlay problem (Markoff and Shapiro Citation1973, Gotway and Young Citation2002). For these reasons, the estimated values for the hexagonal areal units are weighted by the area of overlap. This areal weighting approach is often applied when transferring a dataset from one zoning system to another, and where the latter is not nested hierarchically with the former and the boundaries between them do not coincide. For example, Markoff and Shapiro (Citation1973) correlated spatial data on the old regime in France, originally presented by different and incompatible zoning systems, into a common zoning system.
Figure 4. Polygonal overlay problem between the areal units of 30 km2 and (a) census tracts and (b) traffic zones
The aggregation of the census tracts is achieved by
where is some source value,
is the area of overlap between the source areal unit
and some target areal unit
, and
is the estimated value for areal unit
.
An interesting case arises with the mobility data since the intra-urban mobility flows (influx/outflux) are designed to produce an asymmetric matrix. In this case, we establish two weights that stand for the area of overlap of the origin and destination, respectively. EquationEquation (4)(4)
(4) shows the particular harmonization needed for our mobility data:
whereby is the estimated flow value with origin
and destination
for the areal unit of 30 km2,
is the flow value with origin and destination in the traffic zones
and
, respectively,
and
are the inflow and outflow weights, respectively, and correspond to the area of overlapping spatial units. The
and
variables correspond to the number of spatial units of the original and reshaped zoning systems, respectively. Appendix illustrates EquationEquation (4)
(4)
(4) using a simple example.
4.4. Calculating the degree to which rainfall events are reflected in Twitter
We quantified the statistical relationship between the time series of the frequency of geotagged tweets related to rainfall events and corresponding rainfall measurements to investigate how similar they are. The similarity rate was calculated for each hexagonal spatial unit of 30 km2, as previously defined. We chose cross-correlation as a suitable measure for the similarity of both time series because it focuses on lags in terms of peaks and valleys instead of point-to-point alignments. The latter are adopted in many other similarity measures, such as dynamic time warping (Kruskal and Liberman Citation1999). Even though cross-correlation is a simple measure, it clearly describes the systematic time differences observed between the timestamps of the filtered tweets and related rainfall measurements (de Andrade et al. Citation2017, Restrepo-Estrada et al. Citation2018).
The cross-correlation measure is used to investigate similarities of two times series as a function of the displacement of one relative to the other (Bacchi and Kottegoda Citation1995). The alignment between them can occur in a synchronized (with no lag period) or unsynchronized manner (with a positive or negative lag period). In general, owing to the need for averaging, high correlations with synchronism are likely to be observed in coarse-grained temporal scales (e.g. a day or more), while fine temporal scales (e.g. an hour or less) often lead to high correlations with a positive or negative lag period. This means that statistical estimates such as correlations are affected by changes in the numbers of time bins of a time series (Cheng and Adepeju Citation2014). In the case of the social reflection of rainfall patterns, we run our cross-correlation analysis with a one-day granularity so that the similarity between the two time series can be investigated in a synchronized way (lag period equal to zero).
A precipitation time-varying ‘structure’ is often as unexpected as it is unpredictable because it depends on in-site factors, i.e. geographical coordinates, topography, land use cover, and dynamic and transitory features, i.e. weather patterns, human-induced micro-climate or even traffic-jam pollution bubbles. One alternative way to communicate the degree of trust and uncertainty in rainfall predictions, is to issue forecasts of likely precipitation (Blöschl et al. Citation2019) and encourage intergovernmental cooperation for hydrometry (Dixon et al. Citation2020). However, the rapid time-variable nature of rainfall fields, especially between 5 min to 6 hours, have significant implications for extreme conditions (Fava et al. Citation2020). In subtropical urban areas like the São Paulo Metropolitan Region (SPMR), on the one hand, examples of sudden urban heat islands before rapid convective storms (Silva Dias et al. Citation2013), or boundary layer effects which have an impact on the vertical air moisture gradient (Nair et al. Citation2004), do typically affect spatiotemporal rainfall ‘structures’ for intervals longer than 6–10 hours. On the other hand, changing aerodynamic resistance caused by heterogeneous heights of urban housing estates (Oke et al. Citation2017) within or adjacent to urban districts also entails more complex spatiotemporal conditions for rainfall structure monitoring in periods lower than 24 hours. In this way, the process of social marginalization with the uncontrolled growth of shanty towns close to skyscrapers (de Lima and Magaña Rueda Citation2018), that are representative of subtropical metropolitan areas like SPMR, makes it difficult to find single structures or even time-invariant rainfall patterns. Hence, the spatiotemporal and hydrometeorological patterns ranging from minutes to hours, or even from pair meters to various urban squares, make urban rainfall ‘structures’ scale-dependent (Mendiondo and Tucci Citation1997) and requires the concept of multifractality, generalized scale invariance and complexity (Schertzer and Lovejoy Citation2011).
In light of the previous explanation, the temporal scale of one-day granularity allows us to avoid what might be a hardly justifiable approach that involves using some arbitrary detailed scale, though some filtered tweets may indeed appear lagged before or after rainfall events. It should also be made clear that this work aims at explaining how social media activity can provide a response to rainfall events. We are also interested in the influence of the demographic, socio-economic, and human mobility factors in this area. Thus, the daily cumulative time series approach seems more suitable than the finer temporal granularities that are required to study potential lags between time series (de Andrade et al. Citation2017).
4.5. The conceptual specification model
The degree to which rainfall events are reflected in Twitter data can be investigated through a spatial autoregressive model (SAR). Prior checking using ordinary least squares (OLS) has revealed a noticeable spatial autocorrelation in the residuals, which makes the use of an explicitly spatial model compulsory. Moreover, a spatial lag effect was also diagnosed by applying the LM test, as suggested by Anselin (Citation1988), who recommends the use of SAR instead of the alternative spatial error specification.
It can be assumed that in line with other studies outlined in Section 2, areal units characterized by high levels of population size and income are likely to more accurately reflect rainfall events in Twitter data. In addition, these variables explain a significant proportion of the intra-urban inequalities in São Paulo (Haddad and NedovićBudić Citation2006, Haddad Citation2009). Nonetheless, the structure of spatial dependence among the areal units cannot be modelled or represented directly by population and income, since these variables only address the question of where people live in the sense of a night-time census but do not show the spatial interaction between the units used. Spatial interaction here refers to how locations interact with each other in terms of the movement of people, and this has contributed to understanding how different locations are functionally interdependent (Calafiore et al. Citation2021). For example, the places that afford similar human activities can make areas ‘more proximal’ than the traditional adjacency in the administrative divisions (McKenzie et al. Citation2020). With regard to the question of how certain people move around the city, intra-urban mobility flows are used as a basis for designing a spatial weights matrix and modeling the hypothesized structure of spatial dependence in the study area. It can thus be assumed that intra-urban mobility flows influence the spatial patterns of Twitter activity. This assumption is based on the regularizing of relationships between geographically disjointed areal units that share similar population dynamics in terms of pendular movements.
The SAR model specification reads as follows.
whereby is the degree to which rainfall events are reflected in Twitter data across the areal units defined,
is the number of people who live in those areal units,
corresponds to their average income,
is the mobility flow-based spatial weight matrix,
is the autoregressive coefficient,
are the estimated model parameters for the independent variables, and
is the error term. The
is asymmetric and expressed by EquationEquation (6)
(6)
(6) .
where is the flow that arrives at the target areal unit
from the source areal unit
weighted,
is the value of the origin-destination matrix described in Section 3.2,
is the population size at the source areal unit
and
refers to the 30-km2 hexagonal areal units. Non-zero diagonal weights are possible and it denote the self-influence of the areal units.
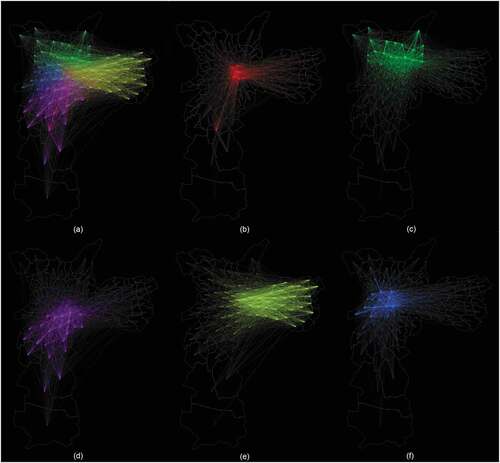
Using mobility flows to model the potential for interaction between different parts of the city is one of the major methodical innovations of this study. Oftentimes, researchers retract to simpler forms of spatial weights like binary contiguity or distance-based weights. By using mobility flows, we aim to achieve a more realistic modeling of intra-urban, everyday connectivity in the sense of the modeling task at hand. Our assumption is that the mobility flows are more realistic depictions of the day-to-day exchange of people between intra-urban areas than simple binary or other weights. This is useful, since we want to acknowledge that people do not only tweet from their homes or move only between adjacent districts, but instead show a more complex moving behavior as we have shown in . These urban mobility patterns between districts of São Paulo () are reflected in generalized form in the spatial weights approach we applied.
Figure 5. Mobility flows patterns between districts of the city of Sao Paulo coloured according to the zone of their district of origin (red = centre, green = north zone, purple = south zone, yellow = east zone, blue = west zone). (a) Flows from all districts. (b) Flows departing from the districts of the central area. (c) Flows departing from from the districts of the north zone. (d) Flows departing from the districts of the south zone. (e) Flow departing from the districts of the east zone. (f) Flows departing from the districts of the west zone
Certainly, other spatial weight schemes are possible such as weights based on adjacent boundaries and distance. In order to provide evidence on the effects of mobility flows on rainfall-related tweets, we compare our spatial model using the mobility flow-coding scheme with the binary contiguity scheme that is commonly used for modeling structural dependence in urban spatial analytics. In addition, it is of note to observe that gender may play an important role in the commuting patterns that we use for spatial modeling. However, since we are lacking in-depth information and data about the different gender patterns of intra-urban flows at the district-level, we leave this kind of stratification for possible follow-up research.
5. Results
5.1. Assessing the social media response to rainfall events in different areas of the city
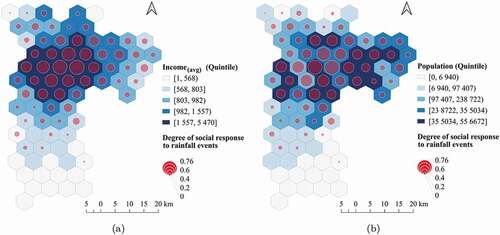
In response to our first research question, shows the spatial distribution of the degree to which rainfall events are reflected in Twitter data, i.e. it depicts the quality of the rainfall signal extracted from Twitter vis-à-vis the spatial distribution of socio-economic variables (income and population size). The map confirms our hypothesis that the degree to which the Twitter activity reflects rainfall varies considerably across different areas of the city. Furthermore, the map reveals that the spatial pattern of the rainfall signal derived from Twitter has a concentric structure, in which the central areal units of the map show high cross-correlation values that decrease towards the outskirts of the city. This shows that Twitter data from the areal units around the city center reflect stronger rainfall events than the outer areal units. When the map in ) is examined, we can see a striking visual coincidence between the spatial distribution of the degree of social response to rainfall events and the income variable. Indeed, the areal units that comprise degrees of social response to rainfall events equal to, or greater than, 0.6 are co-located with the city’s greatest concentration of wealth. In contrast, the majority of the population tends to be concentrated in the eastern areas where the income is bounded by the fourth and fifth quintiles of the income distribution ()). The areal units where the degree of social response to rainfall events is very low or null, correspond to either environmental protection or sparsely inhabited areas.
Figure 6. Maps of the degree to which rainfall events are reflected in Twitter data during the period from 7 November 2016 to 14 June 2017. (a) Quintile map overlapping with the average income variable. (b) Quintile map overlapping with the population variable
5.2. Modeling the effect of intra-urban mobility flows in the social media response to rainfall events
Addressing our second research question, shows the results of the two baseline models we are using (OLS and SAR using binary contiguity) alongside our proposed SAR model with spatial interaction based on intra-urban mobility flows. In line with the conceptual specification model presented in Section 4, all the estimated coefficients are positive and statistically significant, i.e. they are positively correlated with the dependent variable. The positive estimators of population () and income (
) indicate that areal units that host a large population and high average incomes are more likely to reflect rainfall patterns in Twitter data. However, the effect of the variable income (
) is higher than the population variable (
), and this difference is considerably higher in the SAR models as compared to the baseline OLS model. The stronger effect of income in the degree to which rainfall is reflected in Twitter activity is an expected result and confirms our assumptions that the socio-economic profile of a neighborhood has a larger influence than its population size on the quality of the rainfall signal extracted from social media. This influence is even more pronounced when accounting for mobility flows in the SAR model.
Table 1. Statistic results of the baseline models and our proposed model
Most notably, the SAR model using a mobility flow-based spatial weights matrix outperformed the OLS model and the SAR model using a binary contiguity scheme with an adjusted r-square and Akaike of 0.80 and −115.3, respectively. This suggests that our spatial weights model, which connects the different parts of the city based on mobility flows, is useful to explain the spatial heterogeneity of Twitter usage within São Paulo. Using human mobility data has thus increased the explanatory power of our model. Furthermore, the residual spatial distribution is random in the geographic space and slightly skewed to the left. The Global Moran’s I coefficient of the residuals using a mobility flow-based spatial weights matrix based on first-order rook contiguity, reveals a small and non-significant negative spatial correlation of −0.01 (p-value of 0.4987).
6. Discussion
Recent studies have linked socio-economic indicators of neighborhoods such as population and income to the production of social media data (Li et al. Citation2013, Xiao et al. Citation2015, Longley and Adnan Citation2016, Sloan Citation2017). Our study makes a contribution to this body of knowledge by providing quantitative evidence on how these demographic and socio-economic variables also significantly influence thematic activity in social media, as seen in our case study of rainfall-related tweets. In this manner, we were able to show that the response of social media to rainfall events is not homogeneous across urban space; rather, its spatial heterogeneity is strongly and significantly linked to the problem of intra-urban inequalities. Our results show that the strength of the rainfall-related Twitter activity follows a radial socio-spatial segregation pattern found in related works about the city of São Paulo (Haddad and NedovićBudić Citation2006, Haddad Citation2009), thus providing evidence of the fact that there is a persistent ‘digital divide’ between wealthy people living in central urban areas – with access to information and communication technologies – and poor people living in peripheral areas with more limited access to technology.
Furthermore, while previous studies have found correlations between socio-demographic factors and general social media activity, they usually rely upon classic night-time census data which is not able to account for the regular movements of people within the cities to investigate the heterogeneity of social media activity across urban space (see Section 2). Thus, these previous studies are limited in so far as they assume that social media activity only occurs where people live (or in fact where they most likely sleep).
Our work is based on the hypothesis that social media activity is influenced by population dynamics in the sense of how people regularly move between different areas of cities (Section 4.2), and this is confirmed by the resulting improvements achieved by our spatial model (Section 5.2). The results highlight the fact that the spatial autoregressive model using a mobility flow-based spatial weights matrix statistically outperformed the ordinary least squares model and the autoregressive model using a row-standardized spatial weights matrix. Therefore, intra-urban mobility flows are likely to improve spatial models that use distance-based or boundary-based spatial weights also in other applications of urban social media analytics. This is an evidence that mobility flow patterns exert a significant influence on the structure of social media messages, and that human mobility data can act as a form of ‘spatial regularization’ to reveal the spatial distribution of social media data. Clearly, this should be further investigated for other geographic locations, periods and topics before any unconditional generalizations can be made, but we believe that the impressive results achieved here are likely to be more widely applicable, and particularly in the case of urban environments with sharp inequalities.
Although the precise coefficients obtained in our model may vary for other scenarios, the fact that intra-urban inequality factors (i.e. socio-economic variables and mobility flows) exert a significant effect on the quality of the information derived from social media to serve as a proxy for a given urban variable, suggests they are likely to have a more general application. This is an important finding which results from a major innovation in our modeling approach: by taking explicit account of intra-urban movement with our spatial weights matrix, we were able to connect the socio-economic profiles of areas given by night-time census data (i.e. the origin of mobility flows) to the influence the residents of these areas have during the day in the social media activity generated for the areas where they travel to (i.e. the destination of mobility flows). In other words, people ‘carry’ their characteristics and habits with them when they travel through the urban space, which are in turn related to the socio-economic profile of their residential areas. Thereby, we have provided evidence that the (night-time) socio-economic indicators of urban areas originating the mobility flows significantly influence the daytime patterns of the social media activity taking place in destination areas. For instance, our modeling approach has enabled us to capture the fact that some urban areas (e.g. the central area of São Paulo in ) receive a substantial daytime influx of people who live in other, predominantly residential areas (e.g. east and south zones of Sao Paulo in ), and thereby the social media patterns of the former are significantly influenced by the socio-economic profiles of the latter.
Thus, our study has important implications for research into urban analytics and practices where social media data is applied in areas such as early warning systems for natural hazards, humanitarian response schemes, and urban planning (e.g. mobility and traffic jams) (Steiger et al. Citation2015a, Nummi Citation2017, Martínez-Rojas et al. Citation2018, Said et al. Citation2019, Martí et al. Citation2019). Since many of the current methods applied in this field do not fully account for factors related to intra-urban inequalities and population dynamics, there is a risk that they may produce knowledge that is strongly biased in favor of more affluent and digitally included areas of cities, whereas deprived and ‘offline’ urban areas risk being systematically neglected. For this reason, it is imperative for future social media urban studies to be more aware of the need for critically assessing the ‘spatial fairness’ of their methods and findings. Our study provides useful initial pointers to determining factors that can influence the uneven spatial distribution and different spatial regimes of social media activity for particular applications and locations in future work.
While we believe our results can make a significant research contribution to improving our understanding of the spatial distribution of social media data, there are a number of limitations that should be addressed in future research endeavors. First, there is the danger of bias (and other limitations in the case study) owing to missing data and the potential lack of representativeness of the population, as well as the keyword-based filtering approach. The limitations of the Twitter API Streaming (e.g. rate limits, bot tagging to distinguish between human and bot accounts, and technical issues such as connection drops) or unavailability of weather radar data caused by failures in server maintenance, might have had some influence on our results. Nonetheless, it is unlikely that these kinds of problems have changed the nature of the strong statistical relationships observed between rain-related tweets and rainfall data. Another limitation is that we only used geotagged tweets. There are also non-geotagged tweets related to rainfall that were not taken into account, and strategies such as geocoding should be employed to increase the sample size in future studies. Furthermore, Twitter’s latest policies have focused on user privacy, favoring a vaguer place-location tagging on messages (e.g. cities and landmark sites) at the expense of GPS-location.
Second, the time of day and day of the week can affect the spatiotemporal patterns of Twitter activity. The highest rates of geotagged tweets, for instance, are more likely to occur between 8 am and 12 am in Los Angeles (Li et al. Citation2013). In view of this, dividing the Twitter activity into temporal slices (e.g. day/night, week/weekend, and office hours/non-office hours) or using panel data models instead of cross-sectional data models, are practices that should be further investigated in the future. Nonetheless, spatiotemporal patterns derived from social media data can diverge between different platforms and data acquiring cultures and interfaces employed by these platforms (McKenzie et al. Citation2020).
Third, the aggregation of point-based measures (e.g. frequency of rain-related tweets and rainfall measurements) can inevitably lead to the MAUP (Fotheringham and Wong Citation1991, Dark and Bram Citation2007). Thus, the hexagonal areal units of 30 km2 may be suitable within the scope of this case study, but other units might be required for other study areas depending on a city’s urban structure, the data sources used, and time periods involved. Appropriate areal units should be chosen on the basis of clearly defined criteria that describe the case study and keep cohesive regions together. We applied a multicriteria optimization framework (de Andrade et al. Citation2020) which reduces the variance in strength of spatial patterning found within geotagged tweets reflecting rainfall, but the literature provides other possible strategies for dealing with MAUP (Fotheringham Citation1989, Dark and Bram Citation2007, Jiang and Miao Citation2015, Lee et al. Citation2016). Finally, the ecological fallacy can also affect our results since it is inherent to aggregated spatial data analysis. Nonetheless, we focused on rainfall patterns (that are spatially aggregated in nature) derived from Twitter data and, thus, is unlikely the individual activity of social media users leads to false conclusions about these patterns. Also, we do not attempt to draw conclusions about individuals but remain at the regional level.
7. Conclusion
There is a mechanism underlying the spatial distribution of social media data which must be fully understood before it can be properly employed. Understanding this mechanism can enable us to characterize the places more effectively and know in advance whether thematic spatiotemporal patterns reflect particular phenomena with precision, like rainfall in our work. Demographic and socio-economic factors should be investigated to understand how social media data are produced in urban areas, although these factors do not track how people’s movements around the city in terms of determining their actual whereabouts. In this article, we show that mobility flows can act as a ‘regularization relationship’ that can improve our understanding of the spatiotemporal patterns of rainfall-related social media activity. This improvement that takes the intra-urban movement in the modeling is essentially a bridge between night-time censuses and daytime whereabouts, based on the fact that people carry with them their habits and socio-economic characteristics to where they travel during the day.
This factor raises the need for further investigation of how mobility data can provide a fuller understanding/explanation of thematic spatiotemporal patterns extracted from social media data, especially in modern urban centers where the size of the social media population is very large and social media dynamics can be used to infer the inter and intra-zonal population flows. In future studies, our spatial autoregressive regression modeling approach should be evaluated in other case studies and related scenarios (e.g. other topics and cities) to obtain generalized results, for instance, by combining the different spatial topology of catchment-driven boundaries with subdaily time-varying intervals of geotagged tweets. Further, it will be informative to extend our work to non-georeferenced tweets, for instance, through georeferencing place names identified in tweets. Our present work only makes use of georeferenced tweets and is thus reflective of a certain sub-group of Twitter users, which is a limitation of our results obtained. This can pave the way for employing urban analytics methods and applications that are more sensitive to spatial urban inequalities and thus able to strive for a just and equitable future for the urban environment.
Acknowledgements
This article is partially funded by the project T2S Waterproofing Data which is financially supported by the Belmont Forum and NORFACE Joint Research Programme on Transformations to Sustainability (https://www.norface.net/program/transformations-to-sustainability/), co-funded by DLR/BMBF (Federal Ministry of Education and Research), ESRC/Global Challenges Research Fund (ES/S006982/1), São Paulo Research Foundation (FAPESP) and the European Commission through Horizon 2020. The authors would like to express their gratitude to the Center for Mathematical Sciences Applied to Industry (CeMEAI) [grant number 2013/07375-0] and Center for Artificial Intelligence (C4IA), funded by FAPESP, for providing the computing resources and to DAEE/FCTH for making the weather radar data available for this study. The authors are also grateful to the anonymous reviewers for their helpful suggestions.
Data and codes availability statement
The data and code that support the findings of this study are available in ‘figshare.com’ with the identifier https://doi.org/10.6084/m9.figshare.12921974.
Disclosure statement
No potential conflict of interest was reported by the author(s).
Additional information
Funding
Notes on contributors
Sidgley Camargo de Andrade
Sidgley Camargo de Andrade is a Professor at Federal University of Technology – Paraná and his research interests are focused on spatial data mining, spatiotemporal data analysis and social media analysis applied to urban problems.
João Porto de Albuquerque
João Porto de Albuquerque is a Professor and the Director of the Institute for Global Sustainable Development at University of Warwick, and his research interests are focused on urban analytics, geographic information science and global sustainable development.
Camilo Restrepo-Estrada
Camilo Restrepo-Estrada is a Professor at University of Antioquia and his research interests are focused on hydrology, social media analysis, data assimilation, statistics and machine learning.
René Westerholt
René Westerholt is a Juniorprofessor and the Director of the Spatial Modelling Lab at TU Dortmund University, and his research interests are focused on geographic information science and spatial statistics.
Carlos Augusto Morales Rodriguez
Carlos Augusto Morales Rodriguez is a Professor at University of São Paulo and his research interests are focused on remote sensing of the atmosphere.
Eduardo Mario Mendiondo
Eduardo Mario Mendiondo is a Professor at University of São Paulo and his research interests are focused on prediction in ungauged basins, observations from under-represented sensors, and unsolved problems in hydrology.
Alexandre Cláudio Botazzo Delbem
Alexandre Cláudio Botazzo Delbem is a Professor at University of São Paulo and his research interests are focused on evolutive algorithms and multi-criteria decision analysis.
References
- Anselin, L., 1988. Spatial econometrics: methods and models. Dordrecht: Kluwer Academic Publishers.
- Anselin, L., 1995. Local indicators of spatial associationlisa. Geographical Analysis, 27 (2), 93–115. doi:https://doi.org/10.1111/j.1538-4632.1995.tb00338.x
- Arthur, R. and Williams, H.T.P., 2019. Scaling laws in geo-located twitter data. PLOS ONE, 14 (7), 1–20. doi:https://doi.org/10.1371/journal.pone.0218454
- Bacchi, B. and Kottegoda, N.T., 1995. Identification and calibration of spatial correlation patterns of rainfall. Journal of Hydrology, 165 (1), 311–348. doi:https://doi.org/10.1016/0022-1694(94)02590-8
- Ballatore, A. and De Sabbata, S., 2020. Los angeles as a digital place: the geographies of user-generated content. Transactions in GIS, 24 (4), 880–902. doi:https://doi.org/10.1111/tgis.12600
- Blöschl, G., et al., 2019. Twenty-three unsolved problems in hydrology (uph) a community perspective. Hydrological Sciences Journal, 64 (10), 1141–1158. doi:https://doi.org/10.1080/02626667.2019.1620507
- Calafiore, A., et al., 2021. A geographic data science framework for the functional and contextual analysis of human dynamics within global cities. Computers, Environment and Urban Systems, 85, 101539. doi:https://doi.org/10.1016/j.compenvurbsys.2020.101539
- Carr, D.B., Olsen, A.R., and White, D., 1992. Hexagon mosaic maps for display of univariate and bivariate geographical data. Cartography and Geographic Information Systems, 19 (4), 228–236. doi:https://doi.org/10.1559/152304092783721231
- Cheng, T. and Adepeju, M., 2014. Modifiable Temporal Unit Problem (MTUP) and Its Effect on Space-Time Cluster Detection. PLOS ONE, 9 (6), 1–10.
- Dark, S.J. and Bram, D., 2007. The modifiable areal unit problem (MAUP) in physical geography. Progress in Physical Geography: Earth and Environment, 31 (5), 471–479. doi:https://doi.org/10.1177/0309133307083294
- de Albuquerque, J.P., et al., 2015. A geographic approach for combining social media and authoritative data towards identifying useful information for disaster management. International Journal of Geographical Information Science, 29 (4), 667–689. doi:https://doi.org/10.1080/13658816.2014.996567
- de Andrade, S.C., et al., 2017. Mining rainfall spatio-temporal patterns in twitter: a temporal approach. In: A. Bregt, et al., eds. Societal Geo- innovation. Cham: Springer International Publishing, 19–37.
- de Andrade, S.C., et al., 2018. Does keyword noise change over space and time? A case study of social media messages. In: XIX Brazilian Symposium on Geoinformatics – GeoInfo 2018, 5–7 December. Campina Grande, PB, Brazil, 116–121.
- de Andrade, S.C., et al., 2020. A multicriteria optimization framework for the definition of the spatial granularity of urban social media analytics. International Journal of Geographical Information Science, 35(1), 43–62. doi:https://doi.org/10.1080/13658816.2020.1755039
- de Bruijn, J.A., et al., 2020. Improving the classification of flood tweets with contextual hydrological information in a multimodal neural network. Computers & Geosciences, 140, 104485. doi:https://doi.org/10.1016/j.cageo.2020.104485
- de Lima, G.N. and Magaña Rueda, V.O., 2018. The urban growth of the metropolitan area of sao paulo and its impact on the climate. Weather and Climate Extremes, 21, 17–26. doi:https://doi.org/10.1016/j.wace.2018.05.002
- Dixon, H., et al., 2020. Intergovernmental cooperation for hydrometry – what, why and how? Hydrological Sciences Journal, 1–15. doi:https://doi.org/10.1080/02626667.2020.1764569
- Fava, M.C., et al., 2020. Improving flood forecasting using an input correction method in urban models in poorly gauged areas. Hydrological Sciences Journal, 65 (7), 1096–1111. doi:https://doi.org/10.1080/02626667.2020.1729984
- Ferrara, E., et al., 2016. The rise of social bots. Communications of the ACM, 59 (7), 96–104. doi:https://doi.org/10.1145/2818717
- Fotheringham, A.S. and Wong, D.W.S., 1991. The Modifiable Areal Unit Problem in Multivariate Statistical Analysis. Environment and Planning A: Economy and Space, 23 (7), 1025–1044. doi:https://doi.org/10.1068/a231025
- Fotheringham, S., 1989. Scale-independent spatial analysis. In: M. Goodchild and S. Gopal, eds. The accuracy of spatial databases. London: Taylor & Francis, 144–149.
- Getis, A., 2007. Reflections on spatial autocorrelation. Regional Science and Urban Economics, 37 (4), 491–496. doi:https://doi.org/10.1016/j.regsciurbeco.2007.04.005
- Getis, A. and Ord, J.K., 1992. The analysis of spatial association by use of distance statistics. Geographical Analysis, 24 (3), 189–206. doi:https://doi.org/10.1111/j.1538-4632.1992.tb00261.x
- Gillespie, C.S., 2015. Fitting heavy tailed distributions: the powerlaw package. Journal of Statistical Software, Articles, 64 (2), 1–16.
- Gotway, C.A. and Young, L.J., 2002. Combining incompatible spatial data. Journal of the American Statistical Association, 97 (458), 632–648. doi:https://doi.org/10.1198/016214502760047140
- Haddad, M.A., 2009. Examining the spatial distribution of urban indicators in São Paulo, Brazil. In: M.J. Sirgy, R. Phillips, and D.R. Rahtz, eds. Community quality-of-life indicators: best cases iii. Dordrecht: Springer Netherlands, 99–121.
- Haddad, M.A. and NedovićBudić, Z., 2006. Using spatial statistics to analyze intraurban inequalities and public intervention in São Paulo, Brazil. Journal of Human Development, 7 (1), 85–109. doi:https://doi.org/10.1080/14649880500502102
- IBGE, 2010. Censo demográfico 2010. Rio de Janeiro: Brazilian Institute of Geography and Statistics.
- Imran, M., et al., 2015. Processing social media messages in mass emergency: a survey. ACM Computing Surveys, 47 (4), 67:1–67:38. doi:https://doi.org/10.1145/2771588
- Jiang, B. and Miao, Y., 2015. The evolution of natural cities from the perspective of location- based social media. The Professional Geographer, 67 (2), 295–306. doi:https://doi.org/10.1080/00330124.2014.968886
- Jiang, Y., Li, Z., and Ye, X., 2019. Understanding demographic and socioeconomic biases of geotagged twitter users at the county level. Cartography and Geographic Information Science, 46 (3), 228–242. doi:https://doi.org/10.1080/15230406.2018.1434834
- Jurdak, R., et al., 2015. Understanding human mobility from twitter. PLOS ONE, 10 (7), 1–16. doi:https://doi.org/10.1371/journal.pone.0131469
- Kruskal, J.B. and Liberman, M., 1999. The symmetric time-warping problem: from continuous to discrete. In: D. Sankoff and J.B. Kruskal, eds. Time warps, string edits, and macro- molecules - the theory and practice of sequence comparison. Stanford, CA: CSLI Publications, Ch. 4, 327329.
- Lansley, G. and Longley, P.A., 2016. The geography of twitter topics in london. Computers, Environment and Urban Systems, 58, 85–96. doi:https://doi.org/10.1016/j.compenvurbsys.2016.04.002
- Lee, Y., et al., 2016. Method for determining appropriate clustering criteria of location- sensing data. ISPRS International Journal of Geo-Information, 5 (9), 151. doi:https://doi.org/10.3390/ijgi5090151
- Li, L., Goodchild, M.F., and Xu, B., 2013. Spatial, temporal, and socioeconomic patterns in the use of twitter and flickr. Cartography and Geographic Information Science, 40 (2), 61–77. doi:https://doi.org/10.1080/15230406.2013.777139
- Liu, Y., Jiang, C., and Zhao, H., 2018. Using contextual features and multi-view ensemble learning in product defect identification from online discussion forums. Decision Support Systems, 105, 1–12. doi:https://doi.org/10.1016/j.dss.2017.10.009
- Longley, P.A. and Adnan, M., 2016. Geo-temporal Twitter demographics. International Journal of Geographical Information Science, 30 (2), 369–389. doi:https://doi.org/10.1080/13658816.2015.1089441
- Longley, P.A., Adnan, M., and Lansley, G., 2015. The geotemporal demographics of twitter usage. Environment and Planning A: Economy and Space, 47 (2), 465–484. doi:https://doi.org/10.1068/a130122p
- Malik, M.M., et al., 2015. Population bias in geotagged tweets. Papers from the 2015 ICWSM Workshop on Standards and Practices in Large-Scale Social Media Research. ICWSM-15 SPSM, 18–27.
- Manca, M., et al., 2017. Using social media to characterize urban mobility patterns: state-of- the-art survey and case-study. Online Social Networks and Media, 1, 56–69. doi:https://doi.org/10.1016/j.osnem.2017.04.002
- Markoff, J. and Shapiro, G., 1973. The linkage of data describing overlapping geographical units. Historical Methods Newsletter, 7 (1), 34–46.
- Martí, P., Serrano-Estrada, L., and Nolasco-Cirugeda, A., 2019. Social Media data: challenges, opportunities and limitations in urban studies. Computers, Environment and Urban Systems, 74, 161–174. doi:https://doi.org/10.1016/j.compenvurbsys.2018.11.001
- Martínez-Rojas, M., del Carmen Pardo-Ferreira, M., and Rubio-Romero, J.C., 2018. Twitter as a tool for the management and analysis of emergency situations: a systematic literature review. International Journal of Information Management, 43, 196–208. doi:https://doi.org/10.1016/j.ijinfomgt.2018.07.008
- McKenzie, G., Janowicz, K., and Keßler, C., 2020. Uncovering spatiotemporal biases in place- based social sensing. AGILE: GIScience Series, 1, 14.
- Mendiondo, E. and Tucci, E.M., 1997. Escalas Hidrológicas I: conceitos. Revista Brasileira De Recursos Hídricos, 2 (2), 59–79.
- Nair, K.N., et al., 2004. Dynamics of urban boundary layer over são paulo associated with mesoscale processes. Meteorology and Atmospheric Physics, 86 (1), 87–98. doi:https://doi.org/10.1007/s00703-003-0617-7
- Nummi, P., 2017. Social media data analysis in urban e-planning. International Journal of E-Planning Research, 6 (4), 18–31. doi:https://doi.org/10.4018/IJEPR.2017100102
- Oke, T.R., et al., 2017. Urban climates. Cambridge: Cambridge University Press.
- Ord, J.K. and Getis, A., 2012. Local spatial heteroscedasticity (losh). The Annals of Regional Science, 48 (2), 529–539. doi:https://doi.org/10.1007/s00168-011-0492-y
- Restrepo-Estrada, C., et al., 2018. Geo-social media as a proxy for hydrometeorological data for streamflow estimation and to improve flood monitoring. Computers & Geosciences, 111, 148–158. doi:https://doi.org/10.1016/j.cageo.2017.10.010
- Rodríguez, L., et al., 2020. Analyzing urban mobility paths based on users’ activity in social networks. Future Generation Computer Systems, 102, 333–346. doi:https://doi.org/10.1016/j.future.2019.07.072
- Rzeszewski, M., 2018. Geosocial capta in geographical research – a critical analysis. Cartography and Geographic Information Science, 45 (1), 18–30. doi:https://doi.org/10.1080/15230406.2016.1229221
- Rzeszewski, M. and Beluch, L., 2017. Spatial characteristics of twitter userstoward the understanding of geosocial media production. ISPRS International Journal of Geo-Information, 6 (8), 236. doi:https://doi.org/10.3390/ijgi6080236
- Said, N., et al., 2019. Natural disasters detection in social media and satellite imagery: a survey. Multimedia Tools and Applications, 78 (22), 31267–31302. doi:https://doi.org/10.1007/s11042-019-07942-1
- Schertzer, D. and Lovejoy, S., 2011. Multifractals, generalized scale invariance and complexity in geophysics. International Journal of Bifurcation and Chaos, 21 (12), 3417–3456. doi:https://doi.org/10.1142/S0218127411030647
- Selex, 2015. Selex meteor manual. Selex.
- Shelton, T., et al., 2014. Mapping the data shadows of hurricane sandy: uncovering the sociospatial dimensions of ‘big data’. Geoforum, 52, 167–179. doi:https://doi.org/10.1016/j.geoforum.2014.01.006
- Silva Dias, M.A.F., et al., 2013. Changes in extreme daily rainfall for são paulo, brazil. Climatic Change, 116 (3), 705–722. doi:https://doi.org/10.1007/s10584-012-0504-7
- Sloan, L., 2017. Who tweets in the united kingdom? profiling the twitter population using the british social attitudes survey 2015. Social Media + Society, 3 (1), 2056305117698981. doi:https://doi.org/10.1177/2056305117698981
- Smith, L., et al., 2017. Assessing the utility of social media as a data source for flood risk management using a real-time modelling framework. Journal of Flood Risk Management, 10 (3), 370–380. doi:https://doi.org/10.1111/jfr3.12154
- SPMR, 2017. Pesquisa origem e destino de 2017. São Paulo: Metrô. Available from: http://www.metro.sp.gov.br/pesquisa-od/ [Accessed 24 Sep 2020].
- Steiger, E., et al., 2015b. Twitter as an indicator for whereabouts of people? Correlating Twitter with UK census data. Computers, Environment and Urban Systems, 54, 255–265. doi:https://doi.org/10.1016/j.compenvurbsys.2015.09.007
- Steiger, E., De Albuquerque, J.P., and Zipf, A., 2015a. An advanced systematic literature review on spatiotemporal analyses of Twitter data. Transactions in GIS, 19 (6), 809–834. doi:https://doi.org/10.1111/tgis.12132
- Wang, Z., et al., 2018. A spatial econometric modeling of online social interactions using microblogs. Computers, Environment and Urban Systems, 70, 53–58. doi:https://doi.org/10.1016/j.compenvurbsys.2018.02.001
- Westerholt, R., et al., 2016. Abundant topological outliers in social media data and their effect on spatial analysis. PLOS ONE, 11 (9), e0162360. doi:https://doi.org/10.1371/journal.pone.0162360
- Westerholt, R., 2018. The impact of the spatial superimposition of point based statistical configurations on assessing spatial autocorrelation. In: A. Mansourian, et al., eds. Geospatial Technologies for All: Short Papers, Posters and Poster Abstracts of the 21th AGILE Conference on Geographic Information Science. Lund, Sweden, 1–6.
- Westerholt, R., Resch, B., and Zipf, A., 2015. A local scale-sensitive indicator of spatial autocorrelation for assessing high-and low-value clusters in multiscale datasets. International Journal of Geographical Information Science, 29 (5), 868–887. doi:https://doi.org/10.1080/13658816.2014.1002499
- Xiao, Y., Huang, Q., and Wu, K., 2015. Understanding social media data for disaster management. Natural Hazards, 79 (3), 1663–1679. doi:https://doi.org/10.1007/s11069-015-1918-0
Appendix
This appendix shows an example of the polygonal overlay problem between two incompatible zoning systems ().
Figure A1. Two incompatible zoning system ( and A,B) with
and
, respectively (see EquationEquation (4))
(4)
(4)
The original influx/outflux matrix (i.e. origin-destination matrix) is
The weights matrix based on the overlap among the areas units is
The reshaped matrix using EquationEquation (4)(4)
(4) is given as follows