
 ?Mathematical formulae have been encoded as MathML and are displayed in this HTML version using MathJax in order to improve their display. Uncheck the box to turn MathJax off. This feature requires Javascript. Click on a formula to zoom.
ABSTRACT
Volunteered Geographic Information (VGI), defined as geographic information contributed voluntarily by individuals, has grown exponentially with the aid of ubiquitous GPS-enabled technologies. VGI projects have generated a large amount of geographic data, providing a new data source for scientific research. However, many scientists are concerned about the quality of VGI data for research, given the lack of rigorous and systematic quality control procedures. This study contributes to the improvement of quality control procedures by proposing a Cross-Volunteer Referencing Anomaly Detection (CVRAD) method to filter anomalous data, using the crowdsourced Safecast radiation data as a case study. The anomaly detection method is validated using two data sets: (1) an official radiation survey data set collected by the KURAMA car-borne system, (2) a set of anomalous Safecast measurements filtered by Safecast moderators. The validation results show that the proposed CVRAD method outperformed the 1.5 IQR benchmark method in minimizing the overall measurement error and detecting abnormal imports of Safecast measurements, thus demonstrating the effectiveness of the proposed method in improving the overall accuracy of crowdsourced radiation measurements.
1. Introduction
The increasing availability of GPS-enabled smart devices and Web 2.0 technologies has boosted the voluntary collection, organization, and sharing of geographic information from the public. This type of geographic information is commonly referred to as Volunteered Geographic Information (VGI) (Goodchild Citation2007). The availability of large volumes of VGI data has drawn considerable attention from researchers, particularly in circumstances where the massive quantity of data can compensate for the lack of expert quality (Trumbull et al. Citation2000, Bonney et al. Citation2014). But, researchers are presented with particular challenges in using the VGI data for scientific investigation (Sui et al. Citation2013). Among all the challenges a significant barrier of utilizing VGI data is the varied data quality, particularly uncertainty about errors or malicious data entries in the contributions (Goodchild and Li Citation2012, Bordogna et al. Citation2016, Basiri et al. Citation2019).
Apart from tackling the inherent difficulties in implementing a systematic order to gather a large quantity of data, some VGI projects are trying to improve their quality of data as well. A common strategy has been to organize physical or online workshops for volunteers to equip them with the necessary skill set to operate the data collection devices (Safecast Citation2017, Bird Academy Citation2018). This strategy not only prepares the volunteers for the project but also ensures a higher quality of data by increasing the level of understanding of the observed phenomenon (Goodchild Citation2007, Antoniou and Skopeliti Citation2017). However, a large number of VGI projects do not require any prerequisite experience or skills from the volunteers to contribute to the data collection process (Haklay Citation2013). Additionally, these VGI projects tend to adopt straightforward data collection protocols to maximize the number of participants, thereby making the data collected prone to observational error and bias (Minghini et al. Citation2017). Furthermore, several VGI-based projects have suffered from the lack of authoritative reference data to validate the data gathered (Antoniou and Skopeliti Citation2015, Haklay et al. Citation2014). These challenges have motivated an increasing number of researchers to assess the data quality of various VGI projects to enrich our understanding of the current state of the quality of VGI, develop innovative methods to address the quality issues, and efficiently harness the immense amount of VGI data (Senaratne et al. Citation2017, Moreri et al. Citation2018, Severinsen et al. Citation2019).
Senaratne et al. (Citation2017) conducted an extensive review of the state-of-the-art quality assessment methods for VGI. According to their survey, the majority of the existing VGI evaluation methods follow the three approaches proposed by Goodchild and Li (Citation2012): the crowd-sourcing approach, the social approach, and the geographic approach. The crowd-sourcing approach refers to the ability of a group to validate and correct errors that one individual might make, and the ability of the crowd to converge on the truth. The social approach relies on trusted individuals to serve as gatekeepers. The geographic approach makes use of the existing body of geographic knowledge to validate the volunteered geographic information. While most of the reviewed papers focused on the quality assessment of map-based, text-based, and image-based VGI, little attention has been given to participatory sensing projects. Participatory sensing is a type of VGI that uses mobile sensor networks formed by humans, vehicles, or animals for data collection (Pon et al. Citation2005, Burke et al. Citation2006). In the past decade, a growing number of participatory sensing applications have been deployed successfully in various domains, including environmental monitoring (Rana et al. Citation2010, Méndez et al. Citation2011, Hasenfratz et al. Citation2012, Brown et al. Citation2016), transportation monitoring (Eriksson et al. Citation2008, Mohan et al. Citation2008), and urban sensing (Miluzzo et al. Citation2011, Al-Husain et al. Citation2013). The omission of participatory sensing VGI projects in the 56 studies reviewed by Senaratne et al. (Citation2017) clearly shows a lack of attention in geography outlets to addressing the quality issues of participatory sensing data.
Nevertheless, participatory sensing data provide an unprecedented opportunity to the science community to understand the dynamic phenomena of the environment (Pon et al. Citation2005, Abdelzaher et al. Citation2007). Through a pervasive mobile sensor network formed by citizens, millions of environmental measurements are collected in near real-time. In addition to these measurements, data collected in participatory sensing often come with GPS coordinates and timestamps. The majority of the studies on measuring, controlling, and improving the data quality of participatory sensing projects have been conducted in the fields of pervasive computing and sensor networks (Ganeriwal et al. Citation2008, Huang et al. Citation2010, Mashhadi and Capra Citation2011). Detecting anomalous data entries is the focus of multiple studies due to the broad application of anomaly detection methods in practice (Golle et al. Citation2004, Talasila et al. Citation2010, Barnwal et al. Citation2016).
An anomaly or outlierFootnote1 is ‘an observation that deviates so much from other observations as to arouse suspicion that it was generated by a different mechanism’ (Hawkins Citation1980, p. 1). From a probability distribution perspective, outlier detection methods are directed to finding data points that deviate from a standard distribution. An example of using a distribution-based model to detect outliers for participatory sensing data is presented by Barnwal et al. (Citation2016). The authors used a Bayesian probabilistic model to detect false traffic reports in Waze, a GPS navigation app, and automatically assign a confidence score to the crowdsourced reports. In addition to the distribution-based methods, other approaches include a spatial proximity approach – validating a submitted report using nearby reports (Talasila et al. Citation2010), and consistency checking – validating the spatial or logical consistency of data to flag malfunctioning devices (Golle et al. Citation2004).
However, these methods are designed for discrete observations to detect malicious nodes. Many mobile environmental sensing tasks have continuous measurements along traveling paths that are sampled at a high temporal resolution. These continuous observations capture a gradual change of an environmental phenomenon, such as the concentration of air pollutants or radioactive materials. Meanwhile, continuous measurements pose new challenges in detecting anomalies since the data are oversampled along the paths while also having large gaps from one path to another. This study presents an anomaly detection method for participatory sensing data, with Safecast data as a case study. Inspired by the crowd-sourcing approach and geographic approach proposed by Goodchild and Li (Citation2012), the key idea of the anomaly detection method is that data measured in close spatial and temporal proximity are similar, therefore can be used to cross-validate each other and identify errors in the measurements at a fine spatiotemporal granularity.
The rest of the paper is organized as follows: Section 2 explains the case study data set and validation data sets. Section 3 describes the methodology developed in the study. Section 4 presents the validation process and the results. Section 5 concludes the paper and summarizes guidelines for implementing the proposed anomaly detection method.
2. Data
2.1. Case study data: Safecast data
The citizen science project Safecast was launched shortly after the 2011 Fukushima Nuclear Accident with the goal to encourage citizens to collect radiation measurements and publicly share the data online using a mobile radiation detector called bGeigie (Brown et al. Citation2016). The project attracted hundreds of volunteers across Japan and eventually evolved into a global campaign. By August 2020, the radiation measurements collected through the Safecast project have surpassed 150 million data points.Footnote2 In this study, data from 2011 to 2016 were used to make it comparable with the reference data set, a car-borne survey data collected by the Kyoto University RAdiation MApping system (KURAMA). The number of Safecast volunteers and total radiation measurements per year are shown in .
Figure 1. Comparison between the entire Safecast global data set versus data collected in Japan from 2011 to 2016: (a) the number of Safecast volunteers, (b) the number of Safecast measurements
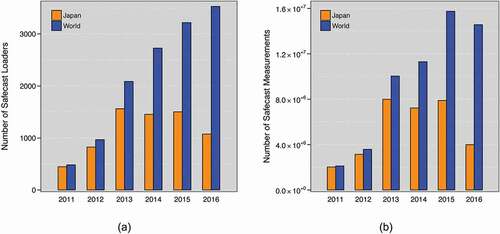
Although the number of volunteers in countries other than Japan has grown consistently from 2011 to 2016, as the birthplace of Safecast, Japan still has the most substantial Safecast radiation data set (). In addition to the Safecast project, many government agencies, professional organizations, and individuals launched radiation surveys in Japan after the nuclear accident. These independent efforts made it possible to validate the anomaly detection method proposed in this study. Given those factors, the case study used Safecast measurements collected in JapanFootnote3 from 23 April 2011 to 8 November 2016 to evaluate the anomaly detection method, with more than 57 million radiation measurements in total.
Currently, the most used Safecast radiation detector unit is the bGeigie Nano kit, developed in late 2012 (Safecast Citation2013). The device is a geo-tagged mobile sensor for ionizing radiation with internet data sharing capacity. The bGeigie Nano measures alpha, beta, and gamma radiation. According to the Safecast organization’s online report, the device has been ‘put through stringent calibration test and has a quality control standard as minimum ± 15% accuracy for gamma radiation from the Barium-137m daughter of Caesium-137, which is the primary source of gamma radiation from the Fukushima-Daiichi accident’ (Safecast Citation2015). Given the stable performance of the bGeigie Nano kit (Walsh et al. Citation2019), it is believed that ‘human error is usually a greater source of measurement inaccuracy than minor variances in hardware’ (Safecast Citation2015).
The bGeigie Nano is designed for mounting on the outside of a car window but can also be used on other modes of transportation or for static/spot radiation detection. In logging mode, the detector takes radiation measurements every 5 s. In addition, it also records the GPS coordinates and timestamps at the time of measure. Users can submit their mobile radiation measurements to the Safecast online mapping systemFootnote4 to share the data publicly.
The majority of Safecast volunteers use bGeigie Nano as a mobile radiation detector rather than a fixed radiation monitor and carry their bGeigie Nanos with them while traveling. These sequential radiation records uploaded by each volunteer therefore also documented the travel trajectories of volunteers which provide valuable information to understand their measurement activities. Utilizing the trajectory information, the study proposes an anomaly detection method to improve the accuracy of the radiation measurements.
Since the anomaly detection method is designed for mobile sensing applications, static sensors are therefore removed from the Safecast data set during the analysis. In this study, static sensors are defined as devices that moved less than 100 m in the course of use. One hundred devices were recognized as static sensors and removed from the analysis, which corresponds to 1.46% of total devices. The analysis of travel speed shows that 80.5% of Safecast measurements in the data set were collected while driving. Hence, an official car-borne radiological survey data set collected through the KURAMA system was used for validation to reduce the discrepancy between different measuring systems.
2.2. Validation data 1: KURAMA car-borne survey data
The official car-borne radiological survey data set published by the Japan Atomic Energy Agency (JAEA) was a result of a series of surveys on radioactive substances conducted by the Ministry of Education, Culture, Sports, Science and Technology (MEXT), and the Secretariat of the Nuclear Regulation Authority. The survey used the KURAMA gamma-ray survey system with a GPS tracking function (Tanigaki Citation2014). Early versions of the KURAMA system use calibrated NaI scintillation survey meters or ionization chamber-type survey meters for air radiation dose rate monitoring. Since 2012 the upgraded KURAMA-II system uses CsI scintillation detectors instead.
The survey was conducted periodically from 2011 to 2016, 13 times in total. Since values measured in winter tend to be smaller than the actual values due to the shielding effect of snow (Nursal et al. Citation2016, JAEA Citation2019), six surveys conducted in summer were used as the primary validation data set to reduce errors caused by the survey process. One survey conducted in winter, December 2011, was also included to test the effect of snow. In total, seven surveys were used in the study for validation. The original survey IDs, survey dates, and the number of records for each survey are listed in . The radiation level is measured in microsieverts per hour (). The conversion between
and counts per minute (cpm) used by the Safecast data follows the equation
(Walsh et al. Citation2019).
Table 1. KURAMA survey data used in the validation
The published values of the measurement points have been averaged into 100 m by 100 m grids by MEXT to reduce statistical variation (JAEA Citation2019). Each record represents the average air dose rate measured in a grid during the survey period. Decay correction is not considered in this data set since the decrease of air dose rate caused by the decay of Caesium during the survey period is only about 1–2%, which is smaller than the errors of the measuring instruments (JAEA Citation2019).
2.3. Validation data 2: rejected measurements by the Safecast moderation process
Besides the official car-borne radiation survey data collected through the KURAMA system, a data set containing anomalous bGeigie measurements filtered by Safecast moderators was also used to validate the anomaly detection method. These measurements were rejected by a rule-based automatic checking process and a manual verification process by Safecast moderators.Footnote5 The auto-approval process currently has five rules to check the validity of the measurementsFootnote6: (1) no zero radiation values, (2) radiation value is less than or equal to 120 cpm for non-cosmic radiation measurements, (3) GPS validity reaches a minimum threshold, (4) the bGeigie device makes frequent contributions and has more than 10 approved measurement imports in the past, and (5) the bGeigie device has no rejected measurements in the past year. Failure to pass one of the rules will flag the measurement import as an anomaly and put the data into the manual verification process waiting for approvals of moderators.
3. Methodology
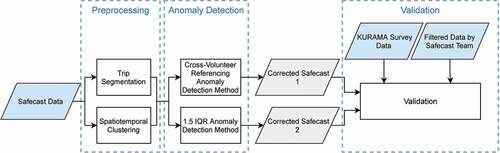
The methodology developed in this study consists of three modules: a data preprocessing module, an anomaly detection module, and a validation module. The data preprocessing module includes a spatiotemporal clustering step and a trip segmentation step. The anomaly detection module uses two methods to identify and filter anomalies in Safecast data, a Cross-Volunteer Referencing Anomaly Detection (CVRAD) method developed in this study and a benchmark method 1.5 Interquartile Range (1.5 IQR) (Tukey Citation1977). Lastly, in the validation module, the filtered Safecast data are compared with the KURAMA car-borne official survey data and the filtered anomalous measurements by Safecast moderators to evaluate the performance of the CVRAD method. A workflow of the methodology is presented in .
Figure 2. A flowchart of the methodology
3.1. Data preprocessing
3.1.1. Spatiotemporal clustering
To leverage the crowd-sourcing approach, we first need to cluster data with similar measurements so that the measurements within one cluster could cross-validate each other. In this section, Safecast data measured in close spatial and temporal proximity were clustered into space-time cubes. To find proper spatial and temporal aggregation units that minimize the variability of Safecast data within each space-time cube, a space-time variogram was used to calculate the variations in the Safecast measurements at various spatial distances and temporal intervals (Pebesma Citation2004, Cressie and Wikle Citation2015). Fifteen spatial bins with a bin width of 20 m and 13 temporal bins with a bin width of one week were used in generating the variogram, which calculates the pair-wise semivariance at a high spatiotemporal resolution. Since the computational time of the space-time variogram grows exponentially as the data size increases, two strategies were adopted to reduce the overall computational time: (1) Only the 2011 Safecast data within the region of the first KURAMA survey were used in the calculation, which approximates 1.03 million Safecast measurements. The 2011 Safecast data set was used because it has the highest level of variation. Therefore, an optimal clustering unit calculated using the 2011 data applies to data collected in later years, where the variation gradually decreases over time due to the decay effect of radioactive materials. (2) Parallel computing techniques were employed to reduce the computational time of generating the space-time variogram. The Safecast data were separated into batches of 1 km 1 km grids for parallel computing. The 1 km unit is much larger than the target maximum spatial distance of 300 m (
), therefore the error margin is negligible when splitting the data into 1 km
1 km grids. The calculated grid-level variograms were further aggregated to estimate the global variogram ().
Figure 3. Space-time variogram map for 2011 Safecast radiation measurements (cpm). Each interval on the x-axis represents 20 m and each interval on the y-axis represents one week
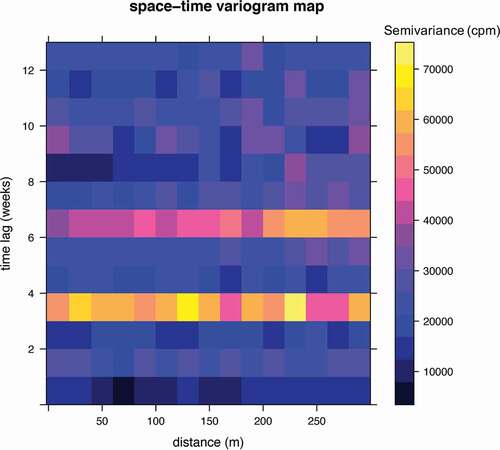
Each cell in the space-time variogram represents the semivariance of data measured in a spatially and temporally lagged window. The dark blue colour indicates a low variation and the bright yellow colour indicates a high variation. The variogram shows that within a 120 m distance and 3 weeks, the variability of the data is relatively small and stable. As the spatial distance or the time lag increases, the semivariance does not constantly increase as what would be expected from a typical variogram. This is because the variability in radiation values is not only influenced by the distance apart but also the topology. The radioactive materials can be blocked by mountain ranges during the dispersion and transmission process, causing the accumulation of radioactive materials on one side of a mountain range (Yasunari et al. Citation2011). Besides, the Safecast measurements are not evenly sampled in space and time since they are collected in an uncoordinated manner by volunteers, which further increases the variability in the pair-wise semivariance. For example, abnormally high values are observed at four-week and seven-week intervals which are caused by periodic measurements by certain Safecast users near the Fukushima region with elevated radiation levels. Since the semivariance is relatively small within 120 m distance and the KURAMA validation data set has a spatial resolution of 100 m 100 m, the Safecast measurements were aggregated into the same 100 m
100 m grids for comparison ().
Figure 4. Spatial clustering of Safecast measurements (black points) by 100 m 100 m grids used in the KURAMA car-borne survey data
After the spatial clustering, data within each spatial grid were segmented further into temporal intervals using the Density-Based Spatial Clustering of Applications with Noise (DBSCAN) method (Ester et al. Citation1996). The DBSCAN algorithm is used in this study to account for the different sampling densities of Safecast data over time. The algorithm searches for the closest neighbouring measurements for each data point. If the time difference between two data points is less than a temporal window, denoted as epsilon, these two data points form a group. The algorithm runs iteratively for each Safecast measurement and separates all data points into groups. A group of points is considered a cluster if the number of points is above a threshold value. In the case study, the threshold was set as 10 to ensure sufficient points for the anomaly detection process. The optimal value of the temporal window epsilon was selected using the Davies-Bouldin index (Davies and Bouldin Citation1979).
Since the semivariance of Safecast measurements within 3-week interval is relatively small, we set the upper temporal interval as 3 weeks which approximates an epsilon of 10 days. To examine the performance of the DBSCAN method with different epsilons, values ranging from 3 to 10 were tested using the Davies-Bouldin Index. This index quantifies the average similarity between each cluster and its most similar cluster
. The similarity measure
between two clusters
and
are calculated using the equation
, where
is the average distance between each point in cluster
and the centroid of that cluster,
is the distance between centroids of clusters
and
. In this study, all clusters are aligned chronologically, thus adjacent clusters are considered most similar to each other. The Davies-Bouldin index is defined as
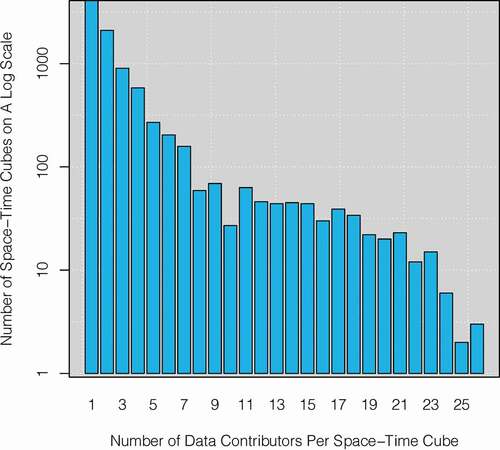
. A lower value of DBI indicates a lower similarity between clusters, thus a better cluster partition. The result of the Davies-Bouldin measure shows that an epsilon value of 7 days produced the best partition of DBSCAN clusters (), which is chosen as the epsilon of the DBSCAN method for the following analysis. After running the spatiotemporal clustering, similar Safecast data were grouped into space-time cubes. A statistic of the number of volunteers per space-time cube shows that many space-time cubes have a few volunteers, and as the number of volunteers increases, the number of space-time cubes drops quickly (). This pattern is consistent with the long-tail distribution observed in other VGI projects (Ma et al. Citation2015).
Figure 5. Result of the Davies-Bouldin Index for DBSCAN clustering method with different epsilons
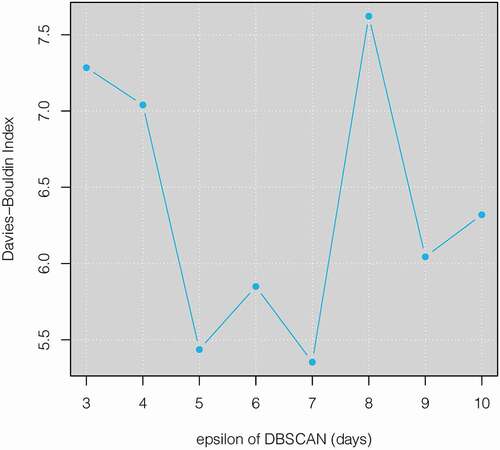
Figure 6. The number of space-time cubes with different numbers of volunteers
3.1.2. Trip detection of Safecast volunteers
For each volunteer, the stream of data collection is usually not continuous. Gaps exist in the data collection due to the volunteer’s inactive participation. During this inactive period, the accuracy of the same device could change due to changes in device settings, unexpected malfunction of the unit, incorrect operations, or malicious manipulations. Given the potential discrepancy in device accuracy, it is important to detect the start and the end points of each measurement activity. Since most of the data that have been collected are during times of travel, in this paper, measurement activities are separated by trips.
A trip was marked by start and end stops. Since the radiation measurements were sampled at the rate of every 5 s, a start or end stop will have a noticeably longer temporal gap than 5 s to its adjacent records. Due to occasional loss of GPS signals, the gaps between consecutive measurements can be longer than 5 s sometimes, but the majority of the temporal gaps fall in the range of 5 s to 1 min in the data set. A two-minute gap is considered an apparent gap between continuous measurements and was therefore chosen in the case study to separate trips of a volunteer, i.e. measurement activities. This two-minute threshold separates trips at very high granularity. For other similar tracking-based environmental sensing data, the threshold should be adjusted to fit the temporal sampling rate of the input data.
3.2. Anomaly detection method
3.2.1. CVRAD method
Many researchers have argued that with a large volume of observations contributed by multiple independent sources, VGI could potentially provide reliable data quality (Haklay Citation2010, Elwood et al. Citation2012, Goodchild and Li Citation2012). One assumption behind the argument is that errors could be corrected through cross-validation between data contributors with enough independent observers or contributors. Based on this assumption, an anomaly detection method called CVRAD is proposed to filter outliers for mobile sensing VGI projects.
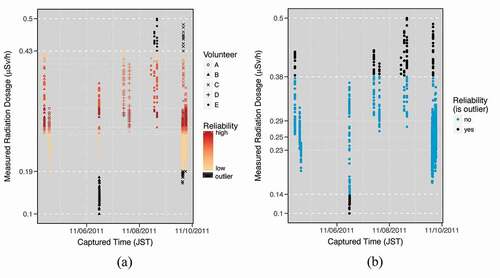
The CVRAD method first finds the local value range of each measurement activity and the global value range of all measurements in a space-time cube by extracting the lowest and highest values respectively. For instance, the global range is for data shown in . All local highest and lowest values are used to cut the global range into small segments. Those dividing lines are indicated by horizontal white dash lines in . Within each segment of values, the number of independent volunteers is considered a reliability score of the data measured in that segment. If a segment has a reliability score that is lower than a threshold (denoted by
), all measurements within the segment will be considered as outliers.
means that less than three independent volunteers will be considered as outliers. presents an example of
, where segments with a value above 0.43
or below 0.19
are contributed by less than three volunteers and marked as outliers. In addition, the reliability score of the non-outlier segments is represented by a colour ramp from red to orange, with the red colour indicating a high reliability and the orange colour indicating a low reliability.
Figure 7. (a) Illustration of the CVRAD method, (b) illustration of the benchmark 1.5 IQR anomaly detection method
The threshold value has an important influence on the performance of the CVRAD method. A higher value of
will remove more data points than a lower value of
, therefore achieving a higher level of accuracy. However, removing more data points will inevitably cause greater information loss. Meanwhile, to avoid labelling outliers when there are few volunteers in the space-time cube, a space-time cube has to have at least
number of volunteers to be considered in the outlier filtering process. For space-time cubes that do not satisfy this requirement, data points in those space-time cubes are assigned an ‘unknown’ label and will not enter the anomaly detection process. If none of the measurements in a space-time cube have a sufficient reliability score, it means these measurements do not have enough overlaps to generate a trustworthy range. As a result, these measurements will not be considered outliers but assigned an ‘unknown’ label instead. To understand the influence of the threshold on the filtering result,
values ranging from 2 to 7 were tested, and the result is shown in the Validation and Results section.
3.2.2. The 1.5 IQR method
The benchmark method used to validate the proposed method is 1.5 IQR, which filters outliers based on the distribution of the data in each space-time cube. Outliers are defined as radiation values that lie outside of a range that is 1.5 times the difference between the first quartile and the third quartile of the measurements. The 1.5 IQR is calculated using the formula , where
is the third quartile of the data set and
is the first quartile of the data set. A data point is considered as an outlier by this method if its value falls outside of the range
. shows an example of the 1.5 IQR outlier filtering results.
Compared to the 1.5 IQR approach, the CVRAD method weights more on the concurrency of different data contributors. For example, in data points that fall into the value range 0.38–0.43 were filtered as outliers according to the 1.5 IQR criterion. However, this segment of values is not considered outliers by the CVRAD method, since four out of the total five volunteers contributed observations to this value range, which makes 0.38–0.43
a valid range under the threshold of
.
4. Validation and results
The study evaluated the effectiveness of the CVRAD method through two validations. The first validation tests whether the Safecast measurements are closer to the official KURAMA radiation survey data after being corrected by the CVRAD method compared to the 1.5 IQR method. The second validation tests if the CVRAD method can successfully detect abnormal values using measurements rejected by Safecast moderators.
4.1. Validation by the KURAMA radiation survey data
In the first validation, the CVRAD method and the 1.5 IQR method were compared on their performance to filter Safecast anomalies. The Safecast data set was joined with the KURAMA survey data based on the same spatial grids and temporal extent. Spatial grids with anomalies identified by both methods were selected and the number of spatial grids is shown in . The difference between the Safecast measurements and the official KURAMA survey data is quantified by the mean absolute error (MAE). A decrease in MAE indicates an increase in the accuracy of Safecast data. The MAE of all grids is used to compare the accuracy of the Safecast data corrected by the CVRAD method, the Safecast data corrected by the 1.5 IQR method, and the uncorrected Safecast data (). The CVRAD method was tested with six values,
.
Figure 8. The mean absolute error between the Safecast data and the official KURAMA survey data. The figure compares the mean absolute error between the Safecast data corrected by the CVRAD method (orange line), Safecast data corrected by the 1.5 IQR method (blue line), and the original non-corrected Safecast data (black line)
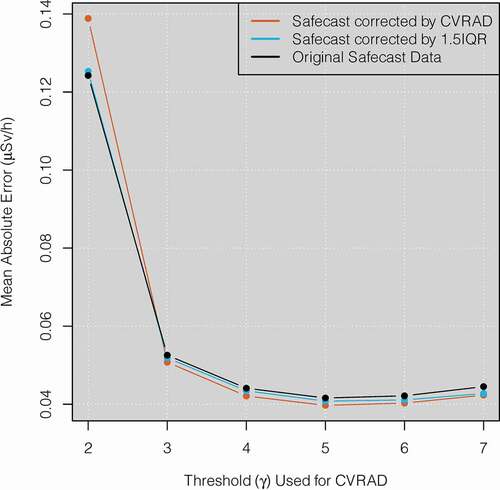
Table 2. Number of grids corrected by both CVRAD and 1.5 IQR methods
The comparison shows that when the gamma value is less than three, the MAE from the CVRAD method is larger than the 1.5 IQR method and uncorrected Safecast data (). In contrast, when the gamma value is greater than or equal to three, the CVRAD starts to show its advantage and yields the smallest MAE compared to the 1.5 IQR method and the uncorrected Safecast. However, the decrease in MAE (i.e. increase in accuracy) resulting from the CVRAD method is marginal. The same pattern is also observed for the standard deviation of error where the CVRAD method slightly outperforms the 1.5 IQR method when the gamma value is greater than or equal to three. The marginal improvement by the CVRAD method when the gamma value is greater than or equal to three is partially because a larger gamma value requires a spatial grid to have more volunteers to enter the filtering process. Grids that satisfy this requirement are mostly in populated places and have low radiation values. For example, when the gamma value is three, the mean air dose rate of the 351 spatial grids is 0.151 (). Thus, when the small radiation values are corrected by the anomaly detection methods, the decrease in errors becomes even smaller. Besides, the Safecast data have been pre-filtered by Safecast moderators which rejected the most impactful anomalies that would introduce large errors.
When the gamma value equals two, many grids with relatively high radiation values enter the anomaly detection process and increase the variability of radiation values. This resulted in an MAE value of 0.124 for uncorrected Safecast data at
which is more than twice the value of MAE for
. The relationship between gamma values and the mean air dose rate of the grids can be seen in .
4.2. Validation by the rejected Safecast measurements
In the second validation, the rejected Safecast measurements are used to test if the CVRAD method can detect unusually high radiation values on the raw measurements. In this validation, the preprocessing step of the workflow is modified to an online approach to allow the detection of anomalies in real-time. After receiving a new data import, the pipeline will identify the GPS point with the highest radiation value and use this point as the centre to retrieve historical data within a spatiotemporal radius. These retrieved data are used as the reference data to check if any anomalies exist in the data import.
Since the CVRAD method is not designed to check the GPS validity and relies on the GPS location to retrieve neighbouring measurements, only rejected measurements with valid GPS data accuracy and abnormally high radiation values were used, resulting in a total of 60 rejected measurement imports. For each rejected measurement import, neighbouring accepted Safecast data within a search radius of 7 days and 100 m are retrieved using the Safecast API. If no neighbouring data are found within this range, the spatial radius is expanded to 500 m to increase the likelihood of getting neighbouring reference data. To implement the CVRAD method, the retrieved data must come from at least one other volunteer apart from the one that contributed the rejected measurements.
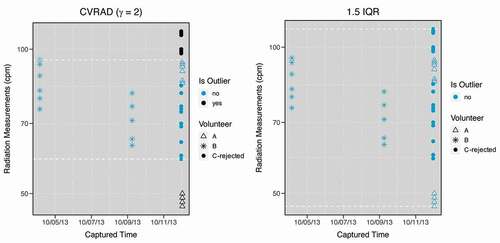
The data retrieval process showed that only two rejected measurement imports had valid neighbouring data returned from the Safecast API. These two rejected measurement imports are combined with their respective neighbouring data as two data groups to validate the effectiveness of both CVRAD and 1.5 IQR methods. The result shows that the CVRAD method successfully identified the rejected measurements in both data groups, whereas the 1.5 IQR method failed to flag any anomalies (). This difference in results can be explained by the mechanism of the two anomaly detection methods. The 1.5 IQR method filters outliers based on the distribution of data. If many measurements are anomalies, the median value will lean towards these anomalous values, thus the 1.5 IQR method will fail to identify anomalies. In contrast, the CVRAD method is based on the majority vote of unique value ranges and is not influenced by the number of contributions from a particular volunteer. Compared to a constant threshold (120 cpm) currently used by Safecast moderators to filter high radiation values, the CVRAD method can adjust the threshold automatically based on the data.
Figure 9. A comparison between the CVRAD method (γ = 2) and the 1.5 IQR method on detecting the first rejected measurement import. The rejected measurement import is contributed by volunteer B and marked in solid triangles. Users are anonymized and represented as letters to protect Safecast user’s privacy
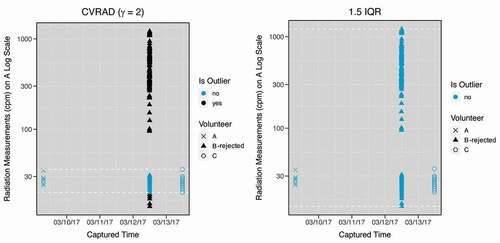
Figure 10. A comparison between the CVRAD method (γ = 2) and the 1.5 IQR method on detecting the second rejected measurement import. The rejected measurement import is contributed by volunteer C and represented in solid dots. Users are anonymized and represented as letters to protect Safecast user’s privacy
5. Conclusion
The study presents an anomaly detection method, CVRAD, to improve the overall accuracy of participatory environmental sensing data. The CVRAD method was implemented on a crowdsourced radiation data set collected through the Safecast project. Successful validation of the method was performed using both official KURAMA car-borne survey data and filtered measurements by Safecast moderators. The validation results demonstrate that the anomaly detection method can successfully identify abnormal values and reduce errors in the VGI data when sufficient volunteers are present; thereby increasing the overall accuracy of the data.
The proposed anomaly detection method is an intrinsic evaluation method that is independent of an external reference data set. Although reference data sets are used to validate the feasibility of the anomaly detection method, the implementation of the anomaly detection method itself does not require an external data set. The proposed method enables the validation of VGI data sets when an authoritative counterpart data set is not available or inconsistent for comparison.
The application of the proposed anomaly detection method can be extended to a broader range of participatory environmental sensing projects, such as air pollution monitoring, temperature sensing, and noise monitoring. The method best fits data with two characteristics: (1) the data are a continuous numerical variable and (2) the data have independent concurrent observations. For environmental measurements with continuous GPS tracking data, the concurrency of measuring activities of independent volunteers can be derived using GPS records coupled with the spatiotemporal clustering and trip segmentation process presented in this paper.
Researchers who plan to use the CVRAD method need to consider two factors: (1) threshold value, , used to define the minimum number of volunteers required for non-outliers, and (2) spatiotemporal unit used to cluster data.
First, the parameter of the cross-volunteer referencing method needs to be adjusted according to the specific requirements of a study. A high
value indicates a low tolerance for outliers and will filter out more outliers than a low
value. In addition, the
value also controls the number of data groups to be examined by the anomaly detection method (in this study, the data are grouped by space-time cubes). A low
value will include more data groups than a high
value. In this case study, the
value needs to be greater than or equal to three for the CVRAD method to outperform the distribution-based 1.5 IQR method at an aggregated level. As the
value increases, the reliability of corrected data also increases. However, a high
value requires VGI projects to have a large group of participants and concurrent measurements at the same time and location. A future research direction to improve the CVRAD method is to develop an automatic selection of the
parameter based on the characteristics of the input data.
Second, the spatial and temporal units used for aggregating the data must account for the local heterogeneity of the crowdsourced environmental data. In cases where limited domain knowledge is available, a space-time variogram can be used to test the variability of the data. Since environmental sensing data are often directly associated with the land use type, future research could cluster mobile environmental sensing data based on the underlying spatial context, for example, clustering sensing data by road segments.
Participatory environmental sensing projects often collect valuable data at a significantly higher granularity and frequency than traditional surveying methods. However, many challenges still exist in ensuring the quality of crowdsourced environmental data which calls for innovative methods to automatically detect anomalous data entries and improve data accuracy. This paper contributes to this direction by developing a CVRAD method that successfully detected anomalies in crowdsourced radiation measurements. This study aims to draw researchers’ attention to improving the data quality of participatory environmental sensing data.
Data and codes availability statement
The Safecast data set used in the case study is freely downloadable from the Safecast official website: https://blog.safecast.org/data/. The KURAMA care-borne survey data set used for validation is openly available on the JAEA official website: https://emdb.jaea.go.jp/emdb/en/portals/b1010202/. The rejected Safecast measurements used in validation can be retrieved from the Safecast API: https://api.safecast.org/en-US/bgeigie_imports?utf8=%E2%9C%93&by_user_name=&by_user_id=&uploaded_before=&uploaded_after=&q=&status=rejected&rejected_by=&by_status=&commit=Filter. The code developed to support the findings of the paper is available in figshare.com with the identifier: https://doi.org/10.6084/m9.figshare.11660046.v1.
Acknowledgements
I would like to thank the editors, anonymous reviewers, Dr Alan MacEachren, and Dr Tony Smith for their valuable and constructive comments. I would also like to thank all staff and contributors of the Safecast project that made the data set publicly available.
Additional information
Notes on contributors
Yanan Xin
Yanan Xin is a postdoctoral researcher at the Mobility Information Engineering Lab, Institute of Cartography and Geoinformation, ETH Zurich. Her research interests are computational mobility analysis, mobility-based anomaly detection, interpretable machine learning, and spatial statistics.
Notes
1. Anomaly and outlier are used interchangeably in this paper.
2. 150, 000, 000 Data Points, the Safecast Blog. URL: https://safecast.org/2020/09/150000000-data-points/
3. The geographic coordinates of the bounding box used for Japan: the minimum longitude is 126.45073, the maximum longitude is 145.58229, the minimum latitude is 26.18840, and the maximum latitude is 45.52232.
4. The Safecast API. URL: https://api.safecast.org/.
5. Notes about the moderation process, Safecast. https://safecast.org/faq/notes-about-the-moderation-process/
6. Code of the Safecast automatic rule-based anomaly checking. URL: https://github.com/Safecast/safecastapi/blob/4f6d4d1c2ff0346319cba24927b2d47d26be7047/app/models/bgeigie_import.rb#L410-L421
References
- Abdelzaher, T., et al., 2007. Mobiscopes for human spaces. IEEE Pervasive Computing, 6 (2), 20–29. doi:10.1109/MPRV.2007.38.
- Al-Husain, L., Kanjo, E., and Chamberlain, A., 2013. Sense of space: mapping physiological emotion response in urban space. In: Proceedings of the 2013 ACM conference on Pervasive and ubiquitous computing adjunct publication - UbiComp ’13 Adjunct. Presented at the the 2013 ACM conference. Zurich, Switzerland: ACM Press, 1321–1324.
- Antoniou, V. and Skopeliti, A., 2015. Measures and indicators of VGI quality: an overview. ISPRS Annals of Photogrammetry, Remote Sensing and Spatial Information Sciences, II-3/W5, 345–351. doi:10.5194/isprsannals-II-3-W5-345-2015
- Antoniou, V. and Skopeliti, A., 2017. The impact of the contribution microenvironment on data quality: the case of OSM. In: G. Foody, L. See, S. Fritz, P. Mooney, A.-M. Olteanu-Raimond, C. C. Fonte, and V. Antoniou, eds. Mapping and the citizen sensor. London: Ubiquity Press Ltd., 165–196
- Barnwal, R.P., et al., 2016. Enhancing reliability of vehicular participatory sensing network: a Bayesian approach. In: 2016 IEEE International Conference on Smart Computing (SMARTCOMP), 18–20 May 2016, St. Louis, MO, USA. IEEE, 1–8
- Basiri, A., et al., 2019. Crowdsourced geospatial data quality: challenges and future directions. International Journal of Geographical Information Science, 33 (8), 1588–1593. doi:10.1080/13658816.2019.1593422.
- Bird Academy, 2018. eBird Essentials [online]. Bird Academy, The Cornell Lab. Available from: https://academy.allaboutbirds.org/product/ebird-essentials/ [Accessed 22 June 2019].
- Bonney, R., et al., 2014. Next steps for citizen science. Science, 343 (6178), 1436–1437. doi:10.1126/science.1251554.
- Bordogna, G., et al., 2016. On predicting and improving the quality of volunteer geographic information projects. International Journal of Digital Earth, 9 (2), 134–155. doi:10.1080/17538947.2014.976774.
- Brown, A., et al., 2016. Safecast: successful citizen-science for radiation measurement and communication after Fukushima. Journal of Radiological Protection, 36 (2), S82. doi:10.1088/0952-4746/36/2/S82.
- Burke, J.A., et al., 2006. Participatory sensing. Proceedings of the World Sensor Web Workshop, ACM Sensys 2006, Boulder, Colorado, 117–134
- Cressie, N. and Wikle, C.K., 2015. Statistics for spatio-temporal data. New Jersey: John Wiley & Sons
- Davies, D.L. and Bouldin, D.W., 1979. A cluster separation measure. IEEE Transactions on Pattern Analysis and Machine Intelligence, PAMI-1 (2), 224–227. doi:10.1109/TPAMI.1979.4766909.
- Elwood, S., Goodchild, M.F., and Sui, D.Z., 2012. Researching volunteered geographic information: spatial data, geographic research, and new social practice. Annals of the Association of American Geographers, 102 (3), 571–590. doi:10.1080/00045608.2011.595657.
- Eriksson, J., et al., 2008. The pothole patrol: using a mobile sensor network for road surface monitoring. In: Proceeding of the 6th international conference on Mobile systems, applications, and services - MobiSys ’08. Presented at the proceeding of the 6th international conference. Breckenridge, CO: ACM Press, 29.
- Ester, M., et al., 1996. A density-based algorithm for discovering clusters in large spatial databases with noise. In: E. Simoudis, J. Han, and U. Fayyad, eds. Proceedings of the 2nd International Conference on Knowledge Discovery and Data Mining, 2–4 August 1996, in Portland, Oregon, USA. AAAI Press, 226–231
- Ganeriwal, S., Balzano, L.K., and Srivastava, M.B., 2008. Reputation-based framework for high integrity sensor networks. ACM Trans. Sen. Netw, 4 (3), 15: 1–15:37. doi:10.1145/1362542.1362546.
- Golle, P., Greene, D., and Staddon, J., 2004. Detecting and correcting malicious data in VANETs. In: Proceedings of the 1st ACM international workshop on vehicular Ad Hoc networks. New York, NY: ACM, 29–37.
- Goodchild, M.F., 2007. Citizens as sensors: the world of volunteered geography. GeoJournal, 69 (4), 211–221. doi:10.1007/s10708-007-9111-y.
- Goodchild, M.F. and Li, L., 2012. Assuring the quality of volunteered geographic information. Spatial Statistics, 1, 110–120. doi:10.1016/j.spasta.2012.03.002
- Haklay, M., 2010. How good is volunteered geographical information? A comparative study of OpenStreetMap and ordnance survey datasets. Environment and Planning B: Planning and Design, 37 (4), 682–703. doi:10.1068/b35097.
- Haklay, M., 2013. Citizen science and volunteered geographic information: overview and typology of participation. In: D. Sui, S. Elwood, and M. Goodchild, eds. Crowdsourcing geographic knowledge: Volunteered Geographic Information (VGI) in theory and practice. Dordrecht: Springer Netherlands, 105–122.
- Haklay, M., et al., 2014. Crowdsourced geographic information use in government. London: World Bank
- Hasenfratz, D., et al., 2012. Participatory air pollution monitoring using smartphones, 5.
- Hawkins, D.M., 1980. Identification of outliers. London: Chapman & Hall
- Huang, K.L., Kanhere, S.S., and Hu, W., 2010. Are you contributing trustworthy data?: The case for a reputation system in participatory sensing. In: Proceedings of the 13th ACM international conference on modeling, analysis, and simulation of wireless and mobile systems. New York, NY: ACM, 14–22.
- JAEA, 2019. Summary of survey. Vehicle-borne survey in the distribution survey of radioactive substances (KURAMA) conducted by the Ministry of Education, Culture, Sports, Science and Technology, and the Secretariat of the Nuclear Regulation Authority from FY 2011 to FY 2016 [online]. Available from: https://emdb.jaea.go.jp/emdb/en/portals/b1010202/ [Accessed 31 December 2019].
- Ma, D., Sandberg, M., and Jiang, B., 2015. Characterizing the heterogeneity of the OpenStreetMap data and community. ISPRS International Journal of Geo-Information, 4 (2), 535–550. doi:10.3390/ijgi4020535.
- Mashhadi, A.J. and Capra, L., 2011. Quality control for real-time ubiquitous crowdsourcing. In: Proceedings of the 2Nd international workshop on ubiquitous crowdsouring. New York, NY: ACM, 5–8.
- Méndez, D., et al., 2011. P-Sense: a participatory sensing system for air pollution monitoring and control. In: 2011 IEEE International Conference on Pervasive Computing and Communications Workshops (PERCOM Workshops), 21–25 March 2011, Seattle, WA, USA. IEEE, 344–347
- Miluzzo, E., et al., 2011. Tapping into the Vibe of the city using VibN, a continuous sensing application for smartphones. In: Proceedings of 1st international symposium on From digital footprints to social and community intelligence - SCI ’11. Presented at the 1st international symposium. Beijing, China: ACM Press, 13.
- Minghini, M., et al., 2017. The relevance of protocols for VGI collection. In: Mapping and the Citizen Sensor. London: Ubiquity Press Ltd.
- Mohan, P., Padmanabhan, V.N., and Ramjee, R., 2008. Nericell: rich monitoring of road and traffic conditions using mobile smartphones. In: Proceedings of the 6th ACM conference on embedded network sensor systems. New York, NY: ACM, 323–336.
- Moreri, K.K., Fairbairn, D., and James, P., 2018. Volunteered geographic information quality assessment using trust and reputation modelling in land administration systems in developing countries. International Journal of Geographical Information Science, 32 (5), 931–959. doi:10.1080/13658816.2017.1409353.
- Nursal, W.I., Okuda, T., and Yamada, T., 2016. Potential of crowdsourcing approach on monitoring radioactivity in Fukushima prefecture. Global Environmental Research, 20, 111–118.
- Pebesma, E.J., 2004. Multivariable geostatistics in S: the gstat package. Computers & Geosciences, 30 (7), 683–691. doi:10.1016/j.cageo.2004.03.012.
- Pon, R., et al., 2005. Networked Infomechanical Systems (NIMS): next generation sensor networks for environmental monitoring. In: IEEE MTT-S international microwave symposium digest, 2005. Presented at the IEEE MTT-S international microwave symposium digest, 2005. Long Beach, CA: IEEE, 373–376.
- Rana, R.K., et al., 2010. Ear-phone: an end-to-end participatory urban noise mapping system. In: Proceedings of the 9th ACM/IEEE international conference on information processing in sensor networks. New York, NY: ACM, 105–116.
- Safecast, 2013. bGeigie Nano [online]. Safecast. Available from: https://blog.safecast.org/bgeigie-nano/ [Accessed 17 June 2019].
- Safecast, 2015. About Calibration and the bGeigie Nano [online]. Safecast. Available from: https://blog.safecast.org/faq/about-calibration-and-the-bgeigie-nano/ [Accessed 17 June 2019].
- Safecast, 2017. A long Safecast weekend [online]. Safecast. Available from: https://blog.safecast.org/2017/10/a-long-safecast-weekend/ [Accessed 22 June 2019].
- Senaratne, H., et al., 2017. A review of volunteered geographic information quality assessment methods. International Journal of Geographical Information Science, 31 (1), 139–167. doi:10.1080/13658816.2016.1189556.
- Severinsen, J., et al., 2019. VGTrust: measuring trust for volunteered geographic information. International Journal of Geographical Information Science, 33 (8), 1683–1701. doi:10.1080/13658816.2019.1572893.
- Sui, D., Elwood, S., and Goodchild, M., eds., 2013. Crowdsourcing geographic knowledge: Volunteered Geographic Information (VGI) in theory and practice. Dordrecht: Springer
- Talasila, M., Curtmola, R., and Borcea, C., 2010. LINK: location verification through immediate neighbors knowledge. In: P. Sénac, M. Ott, and A. Seneviratne, eds. Mobile, and ubiquitous systems: computing, networking, and services. Berlin: Springer, 210–223
- Tanigaki, M., 2014. Development of a Carborne survey system, KURAMA. In: S. Takahashi, ed. Radiation monitoring and dose estimation of the Fukushima nuclear accident. Tokyo: Springer Japan, 67–77.
- Trumbull, D.J., et al., 2000. Thinking scientifically during participation in a citizen-science project. Science Education, 84 (2), 265–275. doi:10.1002/(SICI)1098-237X(200003)84:2<265::AID-SCE7>3.0.CO;2-5.
- Tukey, J.W., 1977. Exploratory data analysis. Reading, Massachusetts: Addison-Wesley Pub. Co.
- Walsh, J., Kelleher, K., and Currivan, L., 2019. Assessment of Safecast bGeigie Nano Monitor. Radiation Environment and Medicine: Covering a Broad Scope of Topics Relevant to Environmental and Medical Radiation Research, 8 (1), 1–8.
- Yasunari, T.J., et al., 2011. Cesium-137 deposition and contamination of Japanese soils due to the Fukushima nuclear accident. Proceedings of the National Academy of Sciences, 108 (49), 19530–19534. doi:10.1073/pnas.1112058108.