
 ?Mathematical formulae have been encoded as MathML and are displayed in this HTML version using MathJax in order to improve their display. Uncheck the box to turn MathJax off. This feature requires Javascript. Click on a formula to zoom.
Abstract
The use of social media and location-based networks through GPS-enabled devices provides geospatial data for a plethora of applications in urban studies. However, the extent to which information found in geo-tagged social media activity corresponds to the spatial context is still a topic of debate. In this article, we developed a framework aimed at retrieving the thematic and spatial relationships between content originated from space-based (Twitter) and place-based (Google Places and OSM) sources of geographic user-generated content based on topics identified by the embedding-based BERTopic model. The contribution of the framework lies on the combination of methods that were selected to improve previous works focused on content-location relationships. Using the city of Lisbon (Portugal) to test our methodology, we first applied the embedding-based topic model to aggregated textual data coming from each source. Results of the analysis evidenced the complexity of content-location relationships, which are mostly based on thematic profiles. Nonetheless, the framework can be employed in other cities and extended with other metrics to enrich the research aimed at exploring the correlation between online discourse and geography.
1. Introduction
Cities are multi-layered systems, hosting complex human-environment interactions in the form of activities, functions, flows, places and meanings embedded into the surrounding urban landscape (Gao et al. Citation2017, Iranmanesh et al. Citation2022). Today, the widespread use of online platforms through mobile phones and location-based services provides fast and voluminous georeferenced data in urban areas. Geospatial big data from user-generated content (UGC) are a major data source for urban studies, with applications such as identifying regions of interest (Shang et al. Citation2016), examining urban perception and functional structure (Hu et al. Citation2021), unraveling mobility patterns, mapping sentiments, among many others (Belcastro et al. Citation2021, Gao et al. Citation2021). When location is attached to published content, users are regarded as social sensors and their footprints are often used as a spatial proxy for obtaining place-based information (Goodchild Citation2007, Papadakis et al. Citation2020). Therefore, exploring the degree of correlation between space-based thematic information and the surrounding place-based information is crucial when geo-tagged UGC is an ubiquitous source of data in the literature.
Platforms such as Twitter, with approximately 200 million daily active users and more than 500 million tweets per day (Jay Citation2022), provide extensive location-based data in densely populated areas. Textual information linked to geographic coordinates, however, do not necessarily reflect the thematic signatures associated with the geographic context from where the user has posted (McKenzie and Adams Citation2017). Another widely exploited type of location-based UGC data in the literature is represented by points of interest (POI), sourced from platforms such as OpenStreetMap (OSM), Foursquare and Yelp (Niu and Silva Citation2020). Attributes such as thematic tags, user reviews and number of check-ins are more enriched in place-based information and better mirror the encompassing spatial context, portrayed by place names, functions and affordances (Psyllidis et al. Citation2022). The discrepancies between content and location are naturally more evident in geo-tagged activity from social networks (eg Twitter and Instagram), where relationships between what is said and where it is said are not obvious.
Previous research has addressed the content-location relationships through different lenses. One such avenue is the inference of geography in both non-georeferenced and geo-tagged textual content by extracting topononyms, geocoding as well as investigating ‘geo-indicativeness’ – the degree to which lexica semantically indicates geographic features (Adams and Janowicz Citation2021, Melo and Martins Citation2017, Qiu et al. Citation2022). In place semantics, natural language processing (NLP) methods have been applied to geo-tagged UGC to obtain thematic and cognitive dimensions of places (Hu Citation2018a, Citation2021). In NLP, efforts to incorporate location into topic modeling algorithms are examples of how researchers have acknowledged that location is not just another attribute, but is often intertwined with content (Bo and Martin Citation2013, Wang et al. Citation2020). However, studies that focus specifically on addressing the extent to which location and content are related in geo-tagged social media activity are still scarce. In addition, most of the works employing topic modeling rely on the latent Dirichlet allocation (LDA), which has been outperformed by more recent algorithms, making room for improvements regarding the NLP methods of choice (Egger and Yu Citation2022).
The extent to which everyday conversation in social networks is geo-indicative may vary depending on temporal and spatial scales, as well as the thematic signatures of the text (Gao et al. Citation2017, Fu et al. Citation2018). As these data sources continue to support research in urban studies, we need to outline reproducible and straightforward steps aimed at assessing the correlation between text and the urban environment for a given city (de Oliveira and Painho Citation2021). Limitations found in previous works include employing outdated topic models, relying on manual classification steps, performing content analysis based on individual point-based short-text activity and restricting context information to place types (Hahmann et al. Citation2014, Herfort et al. Citation2014, McKenzie and Adams Citation2017). Furthermore, traditional bag of words topic models, such as LDA, do not consider the syntactic and semantic relationships between words within a document, but recent algorithms are supported by methods that enable the contextualized representation of words (Yang et al. Citation2023). As content-location correlations are the bridge between spatial context and the content of online activity, the efforts to investigate these relationships should invest in up-to-date topic modeling techniques.
In this paper, we introduce a framework for modeling and comparing similar thematic signatures derived from space-based and place-based online activity. The content-location relationships are better represented as the relations between topics originated from geo-tagged social media text and those from POI reviews and tags. Since georeferenced social media data reveals information that is attached to space while not necessarily being thematically related to it, we refer to these sources as space-based. In contrast, POI information and reviews are considered place-based sources as they are better at disclosing urban functions, affordances and perceptions that describe and are related to space. Our contribution relies on providing a methodological framework that can be employed in other cities to enhance the content-location discussions and that is based on more recent methods for topic modeling which have not been applied for this task, more specifically the Bidirectional Encoder Representations from Transformers topic model (BERTopic, Grootendorst (Citation2022)). We also attempt to improve previous efforts by aggregating textual content based on a grid, extracting statistically significant thematic regions, using metrics to objectively assess spatial and thematic similarity, as well as using place reviews as our proxy of the urban landscape. The framework is employed using geo-tagged Twitter posts as our space-based source and reviews and names from Google Places and OpenStreetMap as our place-based reference. All platforms provide large datasets from extensive activity in the majority of urban regions across the globe, including the city of Lisbon (Portugal), where we chose to test the framework.
The remainder of this paper is organized as follows. In Section 2, we present the literature that covers theoretical and methodological aspects of our study. Sections 3 and 4 bring forward our data and methods respectively, from which we obtained our results, found in Section 5. Section 6 is dedicated to our interpretation and discussion of the findings, and lastly, we present our concluding remarks in Section 7.
2. Background and related work
2.1. The relationships between content and location in social networks
Natural language in explicitly geo-tagged social media activity can either disclose information about a place or merely from a place (Hu Citation2018b). In both cases, content may be influenced or caused by features and events from users’ origins at different scales, such as the locale, neighborhood, city and country. This is particularly exploited in previous works that analyze geo-tagged social media data for situational awareness and emergency response in natural disasters including floods, earthquakes and typhoons (Herfort et al Citation2014, Huang and Xiao Citation2015, Suwaileh et al. Citation2022). Although extreme circumstances might generate a higher correlation between content and location, geo-tagged user-generated content can also reflect everyday urban life. In GIScience, these have become common sources for spatially assessing urban thematic characteristics derived from websites, digital gazetteers, social media (Twitter, Foursquare, Instagram, Flickr), Wikipedia, among others (Hobel et al. Citation2015, Citation2016, Chen et al. Citation2019, Twaroch et al. Citation2019, Belcastro et al. Citation2021, Gao et al. Citation2021). In social media, textual content can act as location-based proxies for urban life in regard to activities (eg shopping, working, eating out, recreation) and functions (eg commercial, transportation, residential) that cities can support in different places and regions (Gao et al. Citation2017). However, we need to be aware of the limitations in relying on social media posts with coordinates, as its attachment to space might not necessarily indicate correlation with the neighboring settings (Fu et al. Citation2018).
The vast number of works that explore urban dynamics from geo-text data is evidence that correlation between content and location is generally assumed to be high. Using tweets and POI classes, Hahmann et al. (Citation2014) demonstrated that content-location correlation is often low and varies according to place types, arguing that studies should acknowledge this relationship in their applications while also discussing the need to critically consider the link between a piece of information to a pair of coordinates. With that in mind, McKenzie and Adams (Citation2017) used place labels from Foursquare in a supervised topic modeling of geo-text data from social media platforms, showing that content related to built-up places seem to have a lower correlation while content characterized by physiographic features exhibit a higher alignment between data sources. Their theoretical underpinnings stem from the discussion between space and place, which is in fact fundamental in content-location relationships. Other similar examples in the literature seem to focus on the space-based aspects, such as extracting user positions based on tweet meta-data and matching to correspondent locations found in GeoNames and OSM data (Zohar Citation2021). More place-oriented approaches for discussing the relationships between content and location are timid: while Lansley and Longley (Citation2016) revealed the influence of land-use and urban activities on the content of tweets, Yu et al. (Citation2022) standpoint was to consider POI reviews as adequate spatial proxies of place-based information. Therefore, content-location relationships must be seen through an extended perspective, where comparisons are based not only on positions but also on meanings, functions, activities and affordances of the urban landscape.
2.2. Natural language processing and geo-tagged user-generated content
NLP consists in several techniques that aims at structuring, extracting information and making sense of human natural language (Lamurias and Couto Citation2019). As geo-tagged UGC carries information on people’s in-space activities, opinions and experiences, it provides discursive information that can be used to explore different thematic attributes related to the urban landscape (Dunkel Citation2015, Martí et al. Citation2019). According to Twaroch et al. (Citation2019), UGC does reflect people’s experiences, focus, opinions and interests to a significant degree, and therefore NLP is a crucial tool to find relevant patterns in unstructured text data. The most prevalent NLP method found in the literature is topic modeling, which is able to reduce the complexity of massive geo-text datasets to extract thematic signatures linked to places, activities and perceptions (Fu et al. Citation2018).
From the wide range of available topic models, the LDA algorithm became pervasive in the literature (Liu et al. Citation2019). LDA is an unsupervised probabilistic model based on word co-occurrences (Blei et al. Citation2003, Jenkins et al. Citation2016). Some of the countless examples include extracting cognitive regions of Northern and Southern California (Gao et al. Citation2017); identifying urban functional regions in cities with check-in information (Gao et al. Citation2017); estimating geographic regions from unstructured text (Adams and Janowicz Citation2021); as well as the previously mentioned works of Lansley and Longley (Citation2016), McKenzie and Adams (Citation2017) and Yu et al. (Citation2022). Nonetheless, research on topic modeling methods has empirically demonstrated the disadvantages of LDA, including careful tuning of hyper-parameters for generating cohesive topics, the requirement of detailed assumptions, overlapping topics, user-defined number of topics and restrictions in assessing the correlation between topics as word correlations are ignored (Egger and Yu Citation2022).
Although LDA has been one of the best-known and widely used models, other methods for text representation have been developed in the last years. In particular, algorithms that use word or sentence embeddings have been applied in more recent topic models such as the Top2Vec (Egger Citation2022). Word embeddings are vector representations of text data that enable semantic properties to be encoded whereby similar pieces of text information are nearer in vector space (Naseem et al. Citation2021). Therefore, by embedding words in a continuous vector space, words with similar semantic and syntactic meaning can be mapped to nearby points (Comber and Arribas-Bel Citation2019). Embeddings have been used within GIScience for tasks such as address geocoding, fine-scale land-use identification from POI data and even for building algorithms aimed at reasoning the complex spatial semantics of place types (Place2Vec), among others (Yao et al. Citation2017, Yan et al. Citation2017, Zhang et al. Citation2022). However, works in the field that employ topic models supported by word embeddings are still not commonplace, especially for exploring location-content relationships.
As embedding-based models are able to generate contextual representations, relationships that emerge in the vector space might be related to context emerging from the geographic space. Therefore, even without inserting spatial variables, the use of embedding-based topic modeling is more effective in unraveling latent geographic topics of interest and in the separation of geographic and non-geographic clusters (Yang et al. Citation2023). Among recent algorithms, Grootendorst (Citation2022) has developed the BERTopic, a model that combines BERT embeddings (Bidirectional Enconder Representations From Transformers, developed by Devlin et al. (Citation2019)) and other methods that enable higher flexibility for different use cases. The model works by first creating embeddings that use a pretrained language model, followed by reducing the dimensionality of documents and grouping semantically similar documents into clusters that represent distinct topics. Lastly, the model employs a class-based TF-IDF (term frequency-inverse document frequency) to compare the importance of terms and retrieve the most representative words per topic (Grootendorst Citation2022, Egger and Yu Citation2022).
BERTopic has been employed in social media text analysis such as investigating public sentiments regarding the monkeypox outbreak (Ng et al. Citation2022) and detecting cognitively distorted thinking patterns in Twitter (Alhaj et al. Citation2022). BERT embeddings have also been implemented in methods aimed at extracting geospatial information and toponyms in unstructured text (Chu et al. Citation2022, Berragan et al. Citation2023). In addition to outperforming other topic models, BERTopic is able to generate more interpretable topics, allows multilingual analysis and automatically finds the number of topics (Egger and Yu Citation2022, Egger Citation2022). In this paper, we have opted for implementing the model not only because the vector space might reflect the spatial context better than traditional approaches such as LDA, but also because the use of BERTopic in exploring location-content relationships in UGC has not been carried out in the literature.
3. Data and preprocessing
Using the Twitter Search API, we retrieved all georeferenced tweets posted roughly within the metropolitan area of the city of Lisbon, Portugal. Our search query collected tweets that lay within a 40 km radius around the centroid of Lisbon’s municipality without time constraints. The following filtering and selection are exemplified in .
Figure 1. Twitter data filtering and preprocessing steps prior to topic modeling.
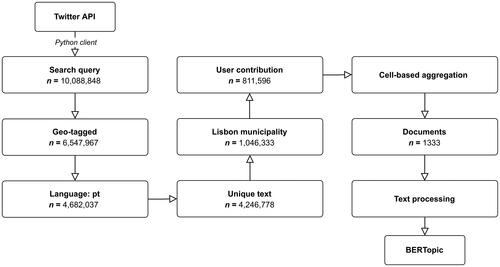
First, tweets without explicit coordinate-based geo-tagging were removed to best represent users’ active location sharing. Then, we selected those tweets whose assigned language field was Portuguese as the high number of tourists in the city might influence the data distribution. The next steps were to remove tweets with duplicated text entries to reduce contamination of spams, followed by clipping the data to Lisbon’s municipality extent. Based on a 200 m-spaced hexagonal grid, we filtered user contribution in space by allowing up to 10 tweets per user per cell with the objective of reducing users that might skew data distribution in specific locations. The chosen spatial unit of analysis has an area of approximately 0.03 km2, which is able to embed most city blocks but not enough to cover neighborhoods. We believe that this resolution is reasonable for our analysis based on the city’s urban fabric and similar grid-based implementations (Andrade et al. Citation2020). As for limiting user contribution, our goal was to reduce the effects of potential dominating spatial bias from the most active users (Gao et al. Citation2017). We also removed the cells containing less than the median value of tweets per cell across the study area. In combination, the previous tasks were aimed at both spatially leveraging user contribution and ensuring that areas with reduced user activity would not contribute to the topic modeling. Since there are no standards on these procedures, our choice of thresholds per cell was done arbitrarily both for the cell removal and for limiting user contribution.
The publishing dates of filtered tweets ranged from 2010 to 2021 and thus we assume that more than a decade of space-based online activity might have substantially contributed to shaping thematic information regarding different aspects of the city. After obtaining the final tweet distribution, we spatially aggregated their textual within each cell of the hexagonal grid covering the city. Therefore, each hexagonal cell represented a document in our topic modeling analysis. Throughout the paper, we will use the word ‘document’, ‘hexagon’ and ‘cell’ interchangeably depending on the context, although they are the same in our analysis. Lastly, we processed the text for the model by removing unwanted text such as special characters, emojis, urls and stop words.
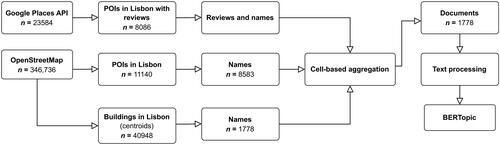
Representing the thematic place-based counterpart, we sourced data from Google Places API and OSM (). We gathered all POI from Google Places within the city, as well as POI and building centroids across Lisbon from OSM. Features extracted from Google Places consisted of user reviews and place names, whereas we retrieved non-empty place names from OSM. We opted not to use place type tags from both sources as we intended to mainly focus on textual information generated by users (place reviews) and place names that act as specific information linked to places. Place type tags not only might not represent specific locations in the city but also are not necessarily defined by users. Following feature extraction, we aggregated the text-based data based on the previous hexagonal grid, succeeded by the same text processing prior to topic modeling. Most text data originated from users’ reviews on Google Places, where publishing dates ranged from 2011 to 2022.
Figure 2. Google Places and OSM data filtering and preprocessing steps prior to topic modeling.
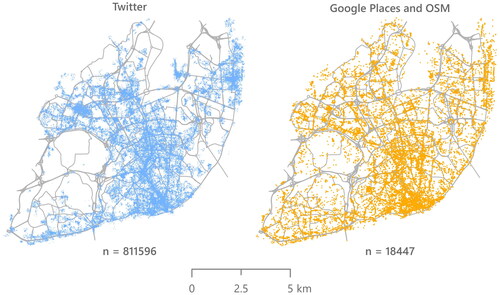
By having similar temporal distributions, both datasets from Twitter and Google may thematically reflect consolidated place-based urban dimensions, even though POI might appear or cease to exist. shows the data distribution of instances from the space-based and place-based data sources prior to cell-based aggregation.
Figure 3. Point locations of data instances from Twitter, Google Places and OSM prior to hexagonal cell aggregation.
4. Methods
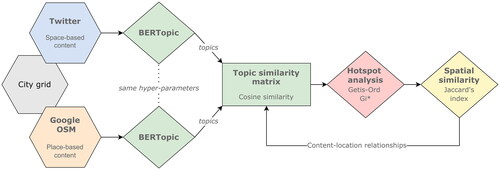
The framework we introduce is visually described in . Our spatial unit of analysis are the cells that compose the hexagon-based grid across the city. The main components of the framework include: setting the aggregated textual data from Twitter and place-based sources (Google and OSM); employing the BERTopic transformer-based topic modeling for each source; comparing topics emerged from each source using the cosine similarity metric; carrying out Getis-Ord hotspot analysis for retrieving statistically representative topic-based cells; applying the Jaccard similarity index aimed at ultimately comparing thematic and spatial similarities that support the discussion on content-location relationships for the case study.
Figure 4. Methodological framework developed in the study.
4.1. Topic modeling
In order to extract thematic signatures from our space-based and place-based sources of textual information, we applied the BERTopic algorithm developed by Grootendorst (Citation2022). Each cell of our hexagonal grid covering the city of Lisbon contained aggregated text-based data, acting as our documents for topic extraction. The BERTopic algorithm uses pre-trained transformer models, rooted in neural network architectures and able to encode words in vector-based representations (Saidi et al. Citation2022). In addition, it merges machine learning approaches to both reduce dimensionality through UMAP (Uniform Manifold Approximation and Projection for Dimension Reduction) and cluster similar embeddings for topic identification through HDBSCAN (Hierarchical Clustering and Density-Based Spatial Clustering of Applications with Noise).
We employed the BERTopic model for each data source independently, although we have set the same hyper-parameters to reduce any model-driven variations in the originated topics. Whereas most parameters were kept as default given the lack of similar frameworks that use BERTopic, we did modify others for our implementation. For the HDBSCAN hyper-parameters, we set the minimum cluster size to 10 documents while keeping the minimum number of samples as 5 to potentially minimize the number of outliers (Grootendorst Citation2022). Since topics are generated through density-based clustering, documents are not forced to fit clusters and hence those that fail to belong to a topic are considered outliers, which helps reducing noise and generating more meaningful topics (Egger and Yu Citation2022). In addition, this also means that although hyper-parameters can be tuned to reduce outliers or change the minimum number of documents for topic generation, there is no prior selection regarding the number of topics. The embedding-based model reduces the dimensions and clusters documents into an optimal number of topics given the input parameters and data.
As for the UMAP, we set the number of neighboring sample points to 5 to constrain local neighborhood size and focus on local as opposed to global patterns. Increasing the number of neighbors provides a more global view of the embedding structure whereas lower values output a more local perspective (Grootendorst Citation2022). As UMAP is stochastic in nature, we also set a random state to guarantee the reproducibility of the model. For each topic, we retrieved the top 15 words that contributed the most in representing the information for the topic cluster. Lastly, we chose a multilingual embedding model, as not only Google Places reviews might be in different languages, but also in tweets, as languages assigned by Twitter are not always accurate. For each data source, the final output is the topic probability distributions across the grid cells, which are the input of the hotspot analysis, whereas word probability distributions for each topic are compared using the cosine similarity between topics.
4.2. Cosine similarity
To objectively compare the topics identified in the model between data sources, we used the cosine similarity metric. The similarity metric represents the angle between vectors. As the output topic information from BERTopic consists of the 15 most important words that form the topic cluster and their respective values of importance or probability, we treated topics as 15-dimensional vectors. The smaller the angle between vectors, the more similar the topics are in the vector space (Liu et al. Citation2019). The cosine similarity is defined as follows:
(1)
(1)
Where A and B are vectors, and similarity is given by calculating the product between vectors divided by the cross product of their lengths (Fu et al. Citation2018). With values ranging from 0 to 1, we computed the cosine similarity for all topics retrieved from Twitter against those from the place-based sources. We then filtered the output pairwise matrix to select the highest values for each Twitter-based topic, showing the most similar corresponding place-based topics within the vector space. Following the selection, we assess the spatial relationship between corresponding topics to characterize and visualize the content-location relationships.
4.3. Getis-Ord 
The last two steps consist in assessing the spatial relationship between the space-based and place-based topics across the city, ultimately aimed at providing insights regarding the content-location relationships. In the first stage, we carried out a hotspot analysis to retrieve statistically significant cells in regard to topic distributions, represented by the probability values assigned to documents or hexagons of belonging to each topic retrieved by the algorithm. For this task, we chose to calculate the Getis-Ord Gi* statistic, part of the G family of statistics developed by Getis and Ord (Citation2010) aimed at characterizing pronounced local clusters of high and low values. In a study area with n points and measurements, and assuming weights
to be defined between all pairs of points i and j (for all
), the Getis-Ord
is denoted as:
(2)
(2)
Where is the mean of all measurements and S is the standard deviation of all measurements (Kumar and Parida Citation2021). In our implementation, we ran the hotspot analysis for all topics extracted in the previous stage and identified cells with z-scores higher than 1.65, which are samples with standard deviations that have 90% or higher confidence or significance in regard to not responding to a random spatial distribution (Rossi and Becker Citation2019).
4.4. Jaccard index
In the second stage, we computed the Jaccard index metric for the identified hotspot areas corresponding to the pairwise comparison of similar topics derived from space-based and place-based sources. In other words, after selecting significant spatial distributions of the topics that yielded higher values of cosine similarity between sources, we computed the spatial similarity between these distributions. The metric is defined as:
(3)
(3)
Where the result corresponds to the intersection divided by the unions of two sets A and B. Ranging from 0 to 1, the metric measures the similarity of two sets, represented in our case by the hotspot areas computed previously, similar to the approach of Heikinheimo et al. (Citation2020). More precisely, sets A and B are the areal extent composed by cells identified as hotspots with z-scores higher than 1.65 from each source respectively. We then discussed the spatial and thematic similarities between the topics derived from Twitter and the corresponding ones derived from POI names and reviews.
5. Results
5.1. Topics
As described in the previous section, we ran the BERTopic algorithm using the same hyper-parameters for the cell-based documents derived from our space-based (Twitter) and place-based (Google and OSM) data sources. While Twitter data yielded 31 topics with 376 outlier documents, Google and OSM data yielded 35 topics with 381 outliers. We present a selection of interesting topics, their words and probabilities as well as word translations from the space-based and place-based sources in and respectively. We have listed all identified topics and their information in the appendix (–), including the ones we do not mention or discuss throughout the paper. The topic order is based on the descending count of documents (hexagonal cells) that were assigned by the algorithm as belonging to the topics. Topic belonging corresponds to the dominant topic of each hexagon or the topic with the highest probability for the document, as each cell yielded probability values ranging from 0 to 1 for all topics. In addition, topic information also includes the corresponding number of instances that were originally aggregated in the documents: tweets, OSM features and Google Places POI. In total, the 31 Twitter topics were modeled based on the aggregated text of 610,593 tweets and the 35 topics of place-based sources originated from 11,392 Google and OSM instances.
Table 1. Selected sample of interesting topics from Twitter.
Table 2. Selected sample of interesting topics from Google Places and OSM.
Alfama, a historic neighborhood in Lisbon known for Fado – a famous style of Portuguese folk music (Cocola-Gant and Gago Citation2021) – was the theme identified in Topic 4. The words thematically characterize the neighborhood as common in-situ activities include concerts (fado music) and dining out. Words that build the football topic (Topic 2) include mostly references to the two largest stadiums in Lisbon and their respective football teams, Benfica and Sporting (Borges Citation2019). The location-specific airport topic (Topic 22) mainly consists of references to Lisbon’s airport, whereas the university topic (Topic 28) contains words that are both generally related to higher education as well as specific faculties of the University of Lisbon. Overall, interpretable topics emerged from the social media network yielded thematic profiles mostly related to neighborhoods, locations and areas of interest, rather than general place-mediated activities.
Interesting topics from the place-based perspective included health (Topic 4), education (Topic 7), shopping mall (Topic 18) and sports (Topic 30). Topics originated from documents based on Google Places and OSM also contained words related to specific places and areas within the city, yet overall to a lesser extent in comparison with topics from Twitter.
5.2. Topic similarity
We computed the cosine similarity for all Twitter topics against those originated from Google and OSM data. For each topic, we selected the highest value of similarity using the pairwise matrix to obtain the most similar corresponding place-based topic. In , we listed each Twitter topic and their matching topics alongside their cosine similarity values.
Table 3. Most similar topic pairs based on the highest cosine similarity values yielded when comparing Twitter topics against those from Google Places and OSM.
In , we highlighted the highest values of similarity that represent the most similar comparisons in the vector space. The most similar topics (0.9527) were represented by the football topic from Twitter (Topic 2) and Topic 19 from Google and OSM, whose thematic signatures are related to football as well as Lisbon-based football teams and stadiums. The second highest similarity (0.9451) did not yield easy interpretations regarding the topics’ semantic relationships. While Topic 3 from Twitter is mostly related to landmarks and POI located in downtown Lisbon, the corresponding Topic 29 thematic signatures are characterized by shopping-related activities. However, the topic from Twitter has ‘comércio’ (business or commerce) as its first representative word, although likely related to a main landmark in the city named ‘Praça do Comércio’ (Comércio plaza).
The third highest similarity (0.9396) was measured for the comparison between Topic 19 from Twitter, which refers to landmarks in two different neighborhoods, and Topic 6, from which words did not point towards a discernible thematic profile. Apart from the outlier, we noticed that three particular place-based topics were associated with Twitter topics in six different comparisons. Topic 6, with no specific thematic profile; Topic 29 (shopping activities); and Topic 5, which is vaguely related to general services in the city.
5.3. Spatial similarity
Based on the previous identified topics, we ran the Getis-Ord hotspot analysis to seek the local high values of the topic distribution. For each output, we selected the cells with z-scores denoting 90% confidence or higher. Cell-based hotspot areas are better at depicting the relevant regions in regard to the original distributions of topics, which oftentimes are spread across the city. Then, for each topic pair we computed the Jaccard index based on the distribution of the selected cells as shown in . The three highest outputs are highlighted.
Table 4. Jaccard indices between selected hotspot areas of similar topic pairs from space-based and place-based sources.
With their thematic profiles linked to Lisbon’s airport, the Jaccard index between the Topic 22 (Twitter) and Topic 15 (Google Places and OSM) scored the highest value (0.18). Terms in the topics include ‘departures’, ‘arrivals’ and ‘taxi’ as well as references to the name of the airport. Another instance of similar themes in the geographic space is represented by the football topic pair, which yielded the third-highest Jaccard index (0.15).
The second highest measurement was yielded by the Topic 5 and 29 pair (0.16). By itself, the topic from Twitter does not point towards a specific thematic profile, however, the place-based topic is strongly related to shopping activities in the city. Therefore, the high spatial relationship suggest that the uncertain thematic profile might also be linked to shopping, even though the topic is polluted with noise.
5.4. Content-location relationships
The core of this study lies at providing a framework to extract thematic and spatial relationships between content generated from space-based and place-based sources, ultimately enriching the discussion on content-location relationships within a given city. Since it is not feasible to discuss about all relationships in regard to comparisons between the topics’ vector and geographic space, we brought forward visualizations of topic pairs selected on the basis of their spatial and thematic similarities. In and , we display the high-value hotspot distributions from the two most similar topic pairs according to cosine similarity and Jaccard index, respectively.
Figure 5. Hotspot distribution and Jaccard index of the two most similar topic pairs (top and bottom) based on the cosine similarity.
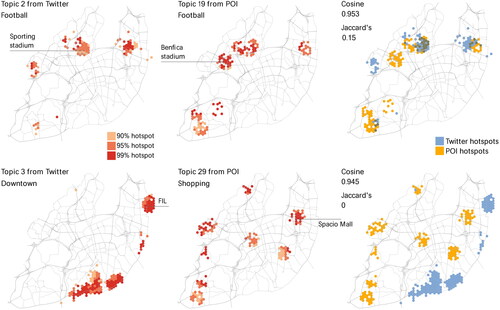
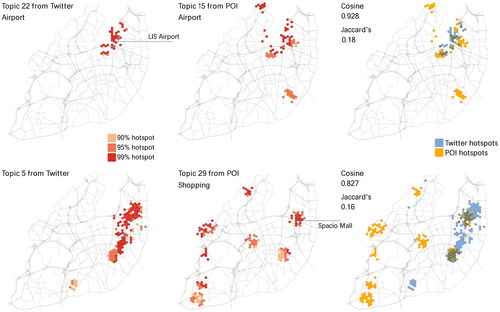
Figure 6. Hotspot distribution and Jaccard index of the two most spatially similar topic pairs (top and bottom) based on the Jaccard index.
The football theme is represented by the topic pair with the highest similarity in the vector space as well as significant spatial overlap. Visual inspection allow us to observe their similar hotspot distribution. The output suggests the content-location correlation for this thematic profile is high. This is not the case for the second most similar topic pair, which had no spatial overlap whatsoever. The topic from the social network mainly revealed landmarks of Lisbon’s downtown, while it also contained words linked to the ‘FIL’ exhibition center. Although identified as part of the same topic, these two thematic signatures are related to distinct regions. The lack of spatial correlation indicate that despite having high cosine similarity, their thematic profiles are distinct, as its corresponding place-based topic consisted of shopping-related words.
As for the most spatially similar topic pair, the airport thematic profile evidences a high content-location correlation between Twitter and the place-based counterparts. This might suggest that when users geo-tag content related to airports, they are most likely engaging in activities afforded by the airport location. However, content-location relationships become blurry when comparing the distribution of the second-highest spatially similar topic pair. Contaminated with noise, the topic from Twitter does not indicate a clear thematic profile, yet the comparison with the corresponding place-based shopping theme shows a significant spatial correlation. We selected place-based topics based on the highest cosine similarity against each Twitter topic, yet this pair had yielded the lowest value from all topic pairs. In we present two final examples of topic pairs to complement our discussion.
Figure 7. Hotspot distribution and Jaccard index of two topic pairs (top and bottom).
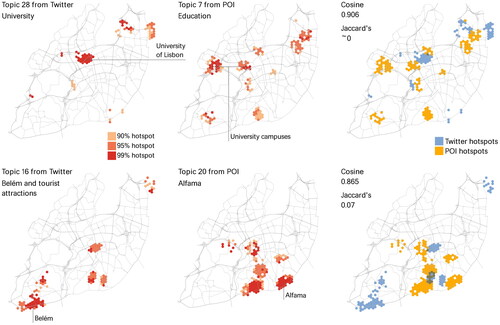
Similar thematic profiles regarding education showed negligible spatial overlap across the city. The topic from Twitter was mainly linked to instances related to higher education and universities, whereas the place-based topic also contained words related to education in general. While we identified university campuses in both distributions, they pointed towards different areas in the city resulting in significantly low overlap. In this case, one can argue that content-location correlation is low as the spatial similarity is close to zero. However, the geo-tagged content from Twitter collectively refers to the location of the University of Lisbon. The intricate relationship between thematic and spatial similarities between geo-tagged activity and the corresponding place-based content is also exemplified in the last topic pair. Despite being linked to different neighborhood and landmarks, evidenced by a weak cosine similarity, their spatial overlap is mostly located in a historic and touristic region. Both Belém and Alfama are historic districts in Lisbon, enclosing important landmarks and attractions.
6. Discussion
The information we harvested from space-based and place-based sources of unstructured text were collectively analyzed in the form of topics. Both sources yielded thematic profiles that described locations, activities and functions of the urban landscape. The steps of our framework are able to quantitatively compare topics derived from geo-tagged social media activity with the most similar topics emerged from place-based sources (Google Places and OSM). However, elucidating content-location relationships based on thematic and spatial correlations depend on careful interpretations of the results.
Although we applied the embedding-based BERTopic without others models for comparison, the topic clusters showed that the algorithm was able to output many coherent and interpretable topics, including geo-indicative topics of interest that are related to specific activities, functions and affordances of different regions within the city. The algorithm is freely available to the public and does not require substantial text preprocessing. In addition, the algorithm yields an optimal number of topics according to cluster parameters and hence does not force instances to belong to topics, which is a better option for oftentimes noisy or incomplete data. Therefore, studies that source data from geo-tagged online activity should not only take advantage of the advances in embedding-based models, but also compare with other traditional and novel topic models
On the other hand, topics with unclear thematic profiles (such as Topic 5 and 6 from place-based sources) frequently scored high values of cosine similarity with topics retrieved from Twitter. Textual data sourced from user-generated content is noisy, unstructured and messy by nature. When adding the spatial dimension, a new layer of complexity is included and researchers must be aware of the limitations of the data themselves prior to the analysis. By developing a straightforward reproducible framework using an embedding-based topic model, researchers can test thematic content-location relationships by changing model parameters, confidence levels, thresholds, preprocessing steps as well as the resolution of the spatial unit of analysis.
We observed that the degree to which geo-tagged content from social media is connected to the corresponding place-based characteristics of the city will vary depending on thematic profiles. Similar insights were found in related literature, but differences were portrayed by place types (Hahmann et al. Citation2014, McKenzie and Adams Citation2017). Here, we represent both space-based and place-based geo-text dimensions as collective topics to be objectively evaluated against each other. Although previous works have developed methods to geo-locating social media activity, we developed an approach to extend the discussion on how discursive information in intentionally geo-tagged text might be associated with urban settings and activities (Adams and Janowicz Citation2021).
Football, a topic that potentially has a high disconnect between content and location, was characterized by one of the highest interpretable correlation between sources. The relation suggests that in Lisbon, geo-tagged content linked to football is connected to locations that afford football related activities. We observed the same relationship in the airport topic, indicating that geo-tagged content thematically associated with airports is mostly generated near the airport location. However, uncertain thematic profiles and different types of categories (activities, neighborhoods and places) show that choosing topic modeling to explore content also reveals that correlations between content and spatial context is intricate and open to discussion.
We were able to identify similar topic pairs coming from space-based and place-based sources using the cosine similarity metric. The following spatial similarity analysis disclosed distinct relationships from which interpretations are not necessarily straightforward. Our results can be translated through two somewhat contrasting viewpoints. One hand, dissimilarities reinforce the limitation of using geo-tagged UGC, as it only connects spatial footprints with textual data (Papadakis et al. Citation2020). On the other hand, similarities between sources strengthen the justifications of using UGC to infer the interaction between people and places within the urban environment (Lansley and Longley Citation2016, Heikinheimo et al. Citation2020).
Furthermore, our study supports the inquisitive discussions on the reliability and accuracy of geospatial information collected or inferred from online sources, problems that are not only a product of well-known biases (Twaroch et al. Citation2019), but also of the theoretical and methodological approaches behind these practices. Although our analysis was bounded to the same limitations and biases, we hope to incite other researchers to extend analytical and conceptual frameworks aimed at validating the use of geo-tagged UGC to unravel human-centered urban dimensions.
Some limitations should be pointed out. First, both sources of user-generated content are biased regarding their users’ demographic profiles and do not fully cover the whole extent of the city, which in turn affects representativeness (Zhang et al. Citation2018, Gao et al. Citation2021). In addition, aggregating geo-tagged textual data into cells can result in biases that stem from the MAUP problem (Openshaw effect), whereby thematic and spatial relationships might differ according to cell size or scale (Goodchild Citation2022). Lastly, results also show that interpretation of thematic and spatial relationships are often constrained to prior familiarity with and knowledge about the city in regard to specific places, activities and neighborhoods. To improve interpretability as well as insights about content-location relationships, future work should consider applying spatially explicit topic models, gathering additional data from online sources as well as implementing alternative metrics and spatial and temporal units of analysis.
7. Conclusions
Geo-tagged social network data has become an extremely popular data source in urban studies as information is used to map, explore and infer the several dimensions of human-environment interactions, including human mobility, urban perception, sentiment analysis among many other activities and opinions. However, the content-location relationships in social media activity are intricate and not always clear. In this article, we introduced a methodological framework to explore the vector-space and geographic-space similarities between thematic profiles emerged from space-based (Twitter) and place-based (Google Places and OSM) sources of geographic user-generated content.
The stages included applying a transformer-based topic modeling, retrieving cosine similarity measurements between topics, running Getis-Ord hotspot analysis to extract representative topic cells as well as computing Jaccard indices to calculate spatial similarities. The results showed that content-location relationship between the surrounding urban settings and the thematic content of in-situ online activity are heavily dependent on the thematic signatures. Nonetheless, the framework can easily be implemented and extended in other cities in order to explore novel insights and support discussions on the use of geo-tagged UGC in GIScience.
Author contributions
Vicente Tang: Conceptualization, Methodology, Software, Formal analysis, Investigation, Data Curation, Writing – Original Draft, Writing – Review and Editing, Visualization.
Marco Painho: Conceptualization, Resources, Writing – Original Draft, Writing – Review and Editing, Supervision, Project administration, Funding acquisition
Disclosure statement
No potential conflict of interest was reported by the author(s).
Data and codes availability statement
The data and code that support the findings of this study are available at: https://doi.org/10.6084/m9.figshare.19307936
Additional information
Funding
Notes on contributors
Vicente Tang
Vicente Tang is a PhD candidate in Geoinformatics at the NOVA Information Management School of the NOVA University Lisbon and also a research member of the CityMe project (https://cityme.novaims.unl.pt/). His research interests include the use of user-generated content and participatory approaches within GIScience to explore places and regions in the city. Twitter: @CityMe5 @vicetang_
Marco Painho
Marco Painho is a full professor of Geographic Information Science at the NOVA Information Management School of the NoOVA University Lisbon and the scientific coordinator of the Geoinformatics and Analytics Laboratory. He holds a Master in Regional Planning from the University of Massachusetts, Amherst and a PhD in Geography from the University of California Santa Barbara. Twitter: @painho
References
- Adams, B., and Janowicz, K., 2021. On the geo-indicativeness of non-georeferenced text. Proceedings of the International AAAI Conference on Web and Social Media, 6 (1), 375–378.
- Alhaj, F., et al., 2022. Improving arabic cognitive distortion classification in twitter using BERTopic. International Journal of Advanced Computer Science and Applications, 13 (1), 854–860.
- Andrade, R., Alves, A., and Bento, C., 2020. POI mining for land use classification: a case study. ISPRS International Journal of Geo-Information, 9 (9), 493.
- Belcastro, L., Marozzo, F., and Perrella, E., 2021. Automatic detection of user trajectories from social media posts. Expert Systems with Applications, 186, 115733.
- Berragan, C., et al., 2023. Transformer based named entity recognition for place name extraction from unstructured text. International Journal of Geographical Information Science, 37 (4), 747–766.
- Blei, D.M., Ng, A.Y., and Jordan, M.I., 2003. Latent Dirichlet Allocation. The Jorunal of Machine Learning Research, 3, 993–1022.
- Bo, H., and Martin, E., 2013. Spatial topic modeling in online social media for location recommendation. RecSys ’13: Proceedings of the 7th ACM conference on Recommender systems, Hong Kong, 25–32.
- Borges, F., 2019. Soccer clubs as media organizations: a case study of Benfica TV and PSG TV. International Journal of Sport Communication, 12 (2), 275–294.
- Chen, M., Arribas-Bel, D., and Singleton, A., 2019. Understanding the dynamics of urban areas of interest through volunteered geographic information. Journal of Geographical Systems, 21 (1), 89–109.
- Chu, D., et al., 2022. A machine learning approach to extracting spatial information from geological texts in Chinese. International Journal of Geographical Information Science, 36 (11), 2169–2193.
- Cocola-Gant, A., and Gago, A., 2021. Airbnb, buy-to-let investment and tourism-driven displacement: a case study in Lisbon. Environment and Planning A, 53 (7), 1671–1688.
- Comber, S., and Arribas-Bel, D., 2019. Machine learning innovations in address matching: a practical comparison of word2vec and CRFs. Transactions in GIS, 23 (2), 334–348.
- de Oliveira, T.H.M., and Painho, M., 2021. Open geospatial data contribution towards sentiment analysis within the human dimension of smart cities. In: A. Mobasheri, ed. Open Source Geospatial Science for Urban Studies. Cham: Springer International Publishing, 75–95.
- Devlin, J., et al., 2019. BERT: pre-training of deep bidirectional transformers for language understanding. In: Proceedings of the 2019 conference of the North American chapter of the association for computational linguistics: Human language technologies, Vol. 1 (Long and Short Papers). Minneapolis, Minnesota: Association for Computational Linguistics, 4171–4186.
- Dunkel, A., 2015. Visualizing the perceived environment using crowdsourced photo geodata. Landscape and Urban Planning, 142, 173–186.
- Egger, R., 2022. Text representations and word embeddings. In: R. Egger, ed. Applied data science in tourism: interdisciplinary approaches, methodologies, and applications. Cham: Springer International Publishing, 335–361.
- Egger, R., and Yu, J., 2022. A topic modeling comparison between LDA, NMF, Top2Vec, and BERTopic to demystify twitter posts. Frontiers in Sociology, 7, 2297–7775.
- Fu, C., et al., 2018. Identifying spatiotemporal urban activities through linguistic signatures. Computers, Environment and Urban Systems, 72, 25–37.
- Gao, S., et al., 2017. A data-synthesis-driven method for detecting and extracting vague cognitive regions. International Journal of Geographical Information Science, 31 (6), 1–27.
- Gao, S., et al., 2021. User-generated content: a promising data source for urban informatics. In: W. Shi, et al., eds. Urban Informatics. Singapore: Springer, 503–522.
- Gao, S., Janowicz, K., and Couclelis, H., 2017. Extracting urban functional regions from points of interest and human activities on location-based social networks. Transactions in Gis, 21 (3), 446–467.
- Getis, A., and Ord, K., 2010. The analysis of spatial association by use of distance statistics. Geographical Analysis, 24 (3), 189–206.
- Goodchild, M.F., 2007. Citizens as sensors: the world of volunteered geography. GeoJournal, 69 (4), 211–221.
- Goodchild, M.F., 2022. The openshaw effect. International Journal of Geographical Information Science, 36 (9), 1697–1698.
- Grootendorst, M., 2022. BERTopic: neural topic modeling with a class-based TF-IDF procedure. arXiv.
- Hahmann, S., Purves, R., and Burghardt, D., 2014. Twitter location (sometimes) matters: Exploring the relationship between georeferenced tweet content and nearby feature classes. Journal of Spatial Information Science, 2014 (9), 1–36.
- Heikinheimo, V., et al., 2020. Understanding the use of urban green spaces from user-generated geographic information. Landscape and Urban Planning, 201, 103845.
- Herfort, B., et al., 2014. Exploring the geographical relations between social media and flood phenomena to improve situational awareness. In: J. Huerta, S. Schade, C. Granell, eds. Connecting a digital alati through location and place. Heidelberg: Springer International Publishing, 55–71.
- Hobel, H., et al., 2015. A Semantic region growing algorithm: extraction of urban settings. In: F. Bação, F. U. Andrew, M. Y. Santos, M. Painho, eds. AGILE 2015: geographic information science as an enabler of smarter cities and communities. Cham: Springer International Publishing, 19–33.
- Hobel, H., Fogliaroni, P., and Andrew, F.U., 2016. Deriving the geographic footprint of cognitive regions. In: S. Tapani, M. S. Yasmina, S. L. Tiina, eds. Geospatial data in a changing world. Cham: Springer International Publishing, 67–84.
- Hu, Y., et al., 2021. A framework to detect and understand thematic places of a city using geospatial data. Cities, 109, 103012.
- Hu, Y., 2018a. 1.07 – geospatial semantics. In: B. Huang, ed. Comprehensive Geographic Information Systems. Oxford: Elsevier, 80–94.
- Hu, Y., 2018b. Geo-text data and data-driven geospatial semantics. Geography Compass, 12 (11), e12404.
- Huang, Q., and Xiao, Y., 2015. Geographic situational awareness: mining tweets for disaster preparedness, emergency response, impact, and recovery. ISPRS International Journal of Geo-Information, 4 (3), 1549–1568.
- Iranmanesh, A., Cömert, N.Z., and Hoşkara, ŞÖ., 2022. Reading urban land use through spatio-temporal and content analysis of geo-tagged Twitter data. GeoJournal, 87 (4), 2593–2610.
- Jenkins, A., et al., 2016. Crowdsourcing a collective sense of place. PLOS One, 11 (4), e0152932.
- Kumar, S., and Parida, B.R., 2021. Hydroponic farming hotspot analysis using the Getis–Ord Gi* statistic and high-resolution satellite data of Majuli Island, India. Remote Sensing Letters, 12 (4), 408–418.
- Lamurias, A., Couto, F.M., et al., 2019. Text mining for bioinformatics using biomedical literature. In: S. Ranganathan, eds. Oxford: Academic Press, 602–611.
- Lansley, G., and Longley, P.A., 2016. The geography of Twitter topics in London. Computers, Environment and Urban Systems, 58, 85–96.
- Liu, Z., et al., 2019. Recommending attractive thematic regions by semantic community detection with multi-sourced VGI data. International Journal of Geographical Information Science, 33 (8), 1520–1544.
- Martí, P., Serrano-Estrada, L., and Nolasco-Cirugeda, A., 2019. Social media data: challenges, opportunities and limitations in urban studies. Computers, Environment and Urban Systems, 74, 161–174.
- McKenzie, G., and Adams, B., 2017. Juxtaposing thematic regions derived from spatial and alatial user-generated content. Proceedings of the 13th International Conference on Spatial Information Theory.
- Melo, F., and Martins, B., 2017. Automated geocoding of textual documents: a survey of current approaches. Transactions in GIS, 21 (1), 3–38.
- Naseem, U., et al., 2021. A comprehensive survey on word representation models: from classical to state-of-the-art word representation language models. ACM Transactions on Asian and Low-Resource Language Information Processing, 20 (5), 1–35.
- Ng, Q.X., et al., 2022. Public sentiment on the global outbreak of monkeypox: an unsupervised machine learning analysis of 352,182 twitter posts. Public Health, 213, 1–4.
- Niu, H., and Silva, E.A., 2020. Crowdsourced data mining for urban activity: review of data sources, applications, and methods. Journal of Urban Planning and Development, 146, 2.
- Jay, A. Number of twitter users 2022/2023: demographics, breakdowns & predictions [online]. FinancesOnline. 2022. Available from: https://financesonline.com/number-of-Twitter-users/ [Accessed 28 January 2022].
- Papadakis, E., Resch, B., and Blaschke, T., 2020. Composition of place: towards a compositional view of functional space. Cartography and Geographic Information Science, 47 (1), 28–45.
- Psyllidis, A., et al., 2022. Points of interest (POI): a commentary on the state of the art, challenges, and prospects for the future. Computational Urban Science, 2 (1), 20.
- Qiu, Q., et al., 2022. ChineseTR: a weakly supervised toponym recognition architecture based on automatic training data generator and deep neural network. Transactions in GIS, 26 (3), 1256–1279.
- Rossi, F., and Becker, G., 2019. Creating forest management units with Hot Spot Analysis (Getis-Ord Gi*) over a forest affected by mixed-severity fires. Australian Forestry, 82 (4), 166–175.
- Saidi, F., Trabelsi, Z., and Thangaraj, E., 2022. A novel framework for semantic classification of cyber terrorist communities on Twitter. Engineering Applications of Artificial Intelligence, 115, 105271.
- Shang, S., et al., 2016. Finding regions of interest using location based social media. Neurocomputing, 173, 118–123.
- Suwaileh, R., et al., 2022. When a disaster happens, we are ready: location mention recognition from crisis tweets. International Journal of Disaster Risk Reduction, 78, 103107.
- Twaroch, F.A., et al., 2019. Investigating behavioural and computational approaches for defining imprecise regions. Spatial Cognition & Computation, 19 (2), 146–171.
- Wang, B., et al., 2020. Understanding the spatial dimension of natural language by measuring the spatial semantic similarity of words through a scalable geospatial context window. PLOS One, 15 (7), e0236347.
- Yan, B., et al., 2017. From ITDL to Place2Vec: reasoning about place type similarity and relatedness by learning embeddings from augmented spatial contexts. Proceedings of the 25th ACM SIGSPATIAL International Conference on Advances in Geographic Information Systems. ACM, 10.
- Yang, J., Jang, J., and Yu, K., 2023. Analyzing geographic questions using embedding-based topic modeling. ISPRS International Journal of Geo-Information, 12 (2), 52.
- Yao, Y., et al., 2017. Sensing spatial distribution of urban land use by integrating points-of-interest and Google Word2Vec model. International Journal of Geographical Information Science, 31 (4), 825–848.
- Yu, Z., Xiao, Z., and Liu, X., 2022. A data-driven perspective for sensing urban functional images: place-based evidence in Hong Kong. Habitat International, 130, 102707.
- Zhang, C., et al., 2022. W-TextCNN: a TextCNN model with weighted word embeddings for Chinese address pattern classification. Computers, Environment and Urban Systems, 95, 101819.
- Zhang, G., Zhu, A., and Zhu, 2018. The representativeness and spatial bias of volunteered geographic information: a review. Annals of GIS, 24 (3), 151–162.
- Zohar, M., 2021. Geolocating tweets via spatial inspection of information inferred from tweet meta-fields. International Journal of Applied Earth Observation and Geoinformation, 105, 102593.
Appendix
Table A1. List of identified topics from Twitter including the ones mentioned throughout the paper (cont.): words, translations, probabilities as well as the count of documents and instances.
Table A2. List of identified topics from Twitter including the ones mentioned throughout the paper: words, translations, probabilities as well as the count of documents and instances.
Table A3. List of identified topics from OSM and Google Places including the ones mentioned throughout the paper (cont.): words, translations, probabilities as well as the count of documents and instances.
Table A4. List of identified topics from OSM and Google Places including the ones mentioned throughout the paper: words, translations, probabilities as well as the count of documents and instances.