
Abstract
We look at the structure and evolution of an information and communication technology (ICT) global innovation network (GIN) by mapping the locations of R&D centres belonging to a group of multinational ICT enterprises. We found that the number of countries and connections have increased in a very short time, and that most of the newcomers have come from Africa, Asia and South America. We show that a country’s network position affects the creation and intensity of R&D linkages with other countries in the network. This suggests that the evolution of the ICT GIN is driven by, among other things, the preferential attachment mechanism, i.e. countries tend to connect to those countries which have more links. A country’s position in the network also moderates the effect of standard determinants of innovation i, such as geographic distance. Hence, network position explains the creation of R&D linkages between such distant countries as the US, China or India.
1. Introduction
Modern high-tech firms seek knowledge sources and opportunities worldwide (Bartlett and Ghoshal Citation1990; Dunning Citation1994). They do this by, for example, locating R&D centres and sourcing technology and knowledge abroad. If we look at the location of R&D centres around the world, a global innovation network emerges (GIN) (Zander Citation2002; Ernst Citation2000; Shin, Kraemer, and Dedrick Citation2009; Barnard and Chaminade Citation2011). However, as studies of R&D internationalisation have up until now focused on the bilateral relationships between countries, the structure and workings of GINs are not fully understood (Tassey Citation2007).
This study analyses the evolution and structure of the information and communication technology (ICT) GIN during two periods of a year each, i.e. 2011 and 2015. It looks at how a country’s position in this network influences its attractiveness as a location for R&D activities. The ICT GIN is mapped using information on nearly 4500 R&D centres located worldwide belonging to multinational enterprises (MNEs) considered being the major semiconductor influencers.
The research had two steps. First, we mapped the structure and described the characteristics of the ICT GIN for the two years chosen (2011 and 2015). We tested whether the network exhibited properties of core/periphery structure and identified the country members for each of the chosen years. Second, we introduced lagged network measures into a gravity model of international R&D to assess how the position of a country in the ICT GIN influences its attractiveness as a location for R&D centres.
We chose the ICT industry because of its high level of globalisation and the unusual way its R&D is organised. Companies in this sector have perfected their capacity to combine cost reduction, speed to market and product differentiation which matches the needs of local consumers around the world. Part of their strategy has been to disperse their R&D activities across the world (Ernst Citation2002), forming what is commonly referred to as a global innovation and business network. Our study of the structure and evolution of the global system of ICT R&D activities complements existing studies on R&D internationalisation. Most of these look at the firm level (Kuemmerle Citation1999; Boutellier, Gassmann, and von Zedtwitz Citation2008) or at the relationships between individual countries (Patel and Pavitt Citation1991; Belderbos, Fukao, and Iwasa Citation2006; Nepelski and De Prato Citation2012). Our study, however, has a global focus and includes all the countries that participate in the GIN and all linkages between them. Comprehensive information on the input side of ICT R&D activity allowed us to overcome some of the problems which other measures of the internationalisation of R&D activity, such as patent data, have (Guellec and Van Pottelsberghe de la Potterie Citation2001).
We applied social network analysis in this study. This has already been used to study networks of knowledge, R&D and innovation by means of patent data (Breschi and Lissoni Citation2004; Hsueh and Wang Citation2009; Li et al. Citation2014) and bibliometric data (Kretschmer Citation2004; Glänzel and Schubert Citation2005). However, most of these studies were limited to a certain geographic area or technology and only a few attempted to map the global technological network (Graf and Kruger Citation2011; De Prato and Nepelski Citation2014; Nepelski and De Prato Citation2015).
The paper is structured as follows: Section 2 creates a conceptual framework for analysing the intensity of R&D linkages in the ICT GIN. Section 3 describes the methodology used to present globally dispersed international ICT R&D centres as a network. Section 4 introduces the data used in the study and Section 5 analyses the ICT GIN’s characteristics and the positions of countries in the network. Section 6 formulates a model of ICT R&D internationalisation and Section 7 discusses the results of empirical estimations. Section 8 offers our conclusions and points to some policy implications.
2. Research motivation and conceptual framework
The topic of R&D internationalisation has attracted a lot of attention over the last few years. A pioneer study on this subject found that the technological activities of multinational firms were concentrated in their home countries (Patel and Pavitt Citation1991). More recent studies show, however, that R&D internationalisation has increased over the last two decades (Thomson Citation2013). The current study builds on previous efforts to describe and understand the process of R&D internationalisation and its drivers. We control for a country’s position in the GIN, and add this factor to the list of internationalisation drivers. Below we present a conceptual framework that allows us to formulate testable hypotheses.
2.1. The effect of asset seeking and asset exploitation on the intensity of R&D linkages
One of the most important reasons for locating R&D centres overseas is access to location-specific resources (Dunning Citation1988, 1994). These resources include inputs to R&D activity, e.g. scientists and universities, and knowledge about customers and markets. Another reason for engaging in international R&D activities is access to the market. Thus, the two main determinants of R&D internationalisation are: economic capacity and the inventive performance of a host country (Patel and Pavitt Citation1991; Guellec and Van Pottelsberghe de la Potterie Citation2001; Dachs and Pyka Citation2010; Picci Citation2010). We expect these two elements to be reflected in the asset exploitation and asset seeking behaviour of companies when they decide where to establish their international R&D activities (Kuemmerle Citation1999). The former concerns the economic benefit of adapting and customising existing products to the needs of consumers in order to sell them on the local market, and the latter is about acquiring know-how and new technology.
Based on the above, we propose the following hypotheses on the determinants of the creation and intensity of linkages in the ICT GIN:
Hypothesis 1: The economic size of a host country has a positive impact on the creation and intensity of its R&D linkages with other countries.
Hypothesis 2: The inventive output of a host country has a positive impact on the creation and intensity of its R&D linkages with other countries.
Although we are not able to disentangle the different motives for R&D offshoring, we assume that H1 is about asset exploitation, whereas H2 is about the asset seeking motives for establishing an R&D centre in a foreign country (Dunning Citation1994).
2.2. Network position and the intensity of R&D linkages
If we consider all R&D centre locations around the world, a GIN emerges (Zander Citation2002; Ernst Citation2000; Shin, Kraemer, and Dedrick Citation2009; Barnard and Chaminade Citation2011). Although the very nature of a GIN calls for a many-to-many approach, studies of R&D and innovation internationalisation have up until now looked at pairs of countries (Gassler and Nones Citation2008; Kumar Citation2008; Pittiglio, Sica, and Villa Citation2009). Moreover, studies that take into account a large group of countries and explain technological collaboration activities between them are scarce (Patel and Pavitt Citation1991; Belderbos, Fukao, and Iwasa Citation2006; Picci Citation2010). Only a few studies explicitly investigate innovation internationalisation empirically at the global level (Niosi and Bellon Citation1994; Bartholomew Citation1997). Thus, the complexities of the GIN, e.g. the dynamics of linkages formation and their intensity, are not fully understood (Tassey Citation2007).
One of the key features of networks is that they behave like complex systems. The elements of these systems, and their structures and dynamics are driven by collective actions. This happens because the behaviour of an individual, e.g. a firm, pursuing its own interests by setting up an R&D centre in a certain location, creates externalities which affect other actors in the network. In the context of R&D internationalisation, examples of these externalities include increased competition for skilled labour, or knowledge spillovers which become available to other firms. These externalities create substitution effects between a given country pair and third parties (Anderson and van Wincoop Citation2003). Depending on the type of externalities, a location becomes more or less attractive as a base for foreign R&D activities.
Being connected globally is recognised as a crucial determinant of the position of individual locations in the global hierarchy. Being central and well-connected in the ICT networks has two implications. One concerns the nodes, i.e. individual regions or countries, and the other the entire network. If an individual location is well connected, it is exposed to a variety of information and ideas that flow to and from the nodes with which it interacts. Thus, the region is exposed to a wide range of opportunities and has potential access to resources and capabilities that can be combined with its own resources. The strength and quality of the connections of a node that plays the role of a hub influence the integrity and robustness of the entire network. This in turn, facilitates the flow of information and the combining of resources in different parts of the network. In other words, there is a reciprocal feedback effect between the node and the network.
Bearing in mind the above discussion on the role of a node’s position in the network for the intensity of interactions with other nodes, we have formulated the following hypothesis:
Hypothesis 3: A country’s centrality positively affects the creation and intensity of R&D linkages with its collaboration partners.
3. Constructing a global ICT innovation network
A straightforward way of representing international ICT R&D centres as a network is by drawing a line between two countries whenever a company based in one country owns an R&D centre in another country.Footnote1 In our analysis, each arrow goes from the country in which the controlling company is based to the country where an R&D centre is located. Thus, as we know the locations of corporate control and of the R&D center, we can build a directed network. The set of nodes, V, is made up of the countries, and the set of arcs, A, is made up of the bilateral relationships that exist whenever one country hosts an R&D centre owned by a company from a different country. In this set-up, we can define the measures of centrality for countries in the following way:
Out-degree of country i is the total number of countries in which companies based in country i maintain R&D centres abroad.
In-degree of country i is the total number of countries from which companies locate R&D centres in country i.
Out-strength is the intensity of connections that country i maintains with other countries. It complements the out-degree, defined above, by looking at the scope of R&D activity performed by country i abroad. It is measured by the total number of R&D types performed in R&D centres located abroad and owned by firms from country i.
In-strength is also the intensity of connections that country i maintains with other countries but in this case, it takes into account the scope of foreign R&D activity in country i. It complements the in-degree measure and can be proxied by the total number of R&D types performed in foreign-owned R&D centres located in country i.
Closeness centrality measures the distance of each node from other nodes in the network. It tells us how powerful a node is in terms of how short the paths from it to other actors of the network are. The closeness centrality of a node i is the number of the remaining nodes divided by the sum of all distances between that node and all the remaining ones, i.e.:
Betweenness centrality measures the number of shortest paths in a network that traverse a node. It is the proportion of all geodesic distances between pairs of other nodes that include this vertex. Formally, the betweenness centrality of V i can be expressed as:
4. Data
The data-set we used provided details of 4461 R&D centres, including their location and information on the type of ICT R&D activity performed. It was collected by Information Handling Services (IHS) Markit, a consultancy which specialises in defence and technology.Footnote2 Part of IHS Markit’s activity is the collection of data on the location of R&D activities, which is mainly done through press review and direct contact with multinational companies in science and technology-intensive industries. We had access to the 2011 and 2015 editions of HIS Markit’s company-level data-set, which gave us the location of ICT R&D (IHS-Markit Citation2011). The R&D centres included in the data-set belong to companies that are considered to be major semiconductor influencers. The objective of the IHS Markit observatory is to cover all countries in which these companies maintain any research activity.
In order to check how representative the sample is, we compared it to the R&D Scoreboard (JRC Citation2015). Of the 210 firms included in the sample, 190 are listed in the 2014 R&D Scoreboard and account for an expenditure of over 190 Billion Euro on R&D. This represents 91% of the 2014 R&D budget of ICT companies or 32% of the total R&D expenditure of the top 2500 global R&D investors. In terms of employment, they account for 20% of the total number of employees working in the 2500 firms. In 2014, the firms analysed employed 10.1 million people. Global employment in the ICT sector was 20.9 million people (PREDICT Citation2015). Hence, the sample covers nearly 50% of the global ICT sector measured by the number of people employed. Our check also shows that the database is biased towards large enterprises. For example, among the firms included in the 2014 R&D Scoreboard, the median values of sales and employment in 2014 were 5.4 Billion Euro and 30,100 employees respectively. Thus, although the data cover a large part of the ICT sector, SMEs are underrepresented.
displays the distribution of companies by their main activity sector according to the Industry Classification Benchmark (ICB Citation2010), R&D centres and the ratio of R&D centres located abroad with respect to the location of company headquarter, i.e. international R&D centres. The first five sectors, i.e. Technology Hardware & Equipment, Electronic & Electrical Equipment, Automobiles & Parts, Leisure Goods and Aerospace & Defence, account for nearly 80% of the sample in terms of the number of both firms and R&D centres. The average share of international R&D centres in the total was 58% in 2011 and 65% in 2015, though it varies across the sectors. Overall, we can observe an increase in R&D internationalisation.
Table 1. Distribution of companies’ activities, by ICB classification.
shows the distribution of R&D types performed overall and in international R&D centres. Each R&D centre can perform up to eight distinct types of R&D activity. The most common types of R&D carried out are hardware and software, which, in 2011, were performed in 62 and 47% of all R&D centres respectively. International R&D centres perform mostly hardware- and software-related research, whereas R&D activities related to components, technology and research are relatively more often performed in domestic R&D centres.
Table 2. R&D activity types.
Each centre carried out an average of 1.69 types of R&D in 2011. If we look only at international R&D centres, an average R&D facility performed 1.61 R&D types. In other words, domestic R&D centres were more R&D intensive than overseas ones. In the following paragraphs, we will use the number of R&D types as a proxy for R&D intensity. This is based on the assumption that the more types of R&D performed in an R&D centre or location, the larger the centre’s R&D scope and intensity.
Besides the IHS Markit data, in the following analysis, we use the CEPII bilateral trade data to observe the distance and common language between countries (Head, Mayer, and Ries Citation2010). Country GDP (in current US$ in 2009) and population figures come from the International Monetary Fund database on economic and financial indicators. Patent-based measures of innovation are taken from the European Patent Office (EPO) Worldwide Patent Statistical Database (known as the PATSTAT database). This database provides worldwide coverage of patent applications submitted to around 90 Patent Offices around the world. The present analysis is based on indicators built by extracting and elaborating patent application data from the April 2015 release of the PATSTAT database. This analysis takes into account priority patent applications filed at 59 Patent Offices: the EPO itself and 58 National Patent Offices including those of the 27 EU Member States, the US Patent and Trademark Office, the Japan Patent Office, and the other most active Patent Offices worldwide, including those of China and India.Footnote3
5. Characteristics of the ICT GIN
Our analysis of the ICT GIN starts with an illustration of the network in 2011 and in 2015 in . The arcs represent the existence of a relationship where a company from one country owns an R&D centre in another country. The size of the nodes is a function of the number of the out- and in-degree of countries. reveals that, in 2011, there were 20 countries with outgoing R&D connections (see also ). On the other hand, there were 52 countries in which international R&D centres were located. According to , these numbers had increased slightly by 2015. These observations allow us to conclude that the ownership or, in the language of international trade, the import of R&D services was much more concentrated than the location and performance of these activities. This means that there were more countries contributing to the R&D activities than countries which appropriated the results.
Figure 1. The ICT global innovation network in 2011.
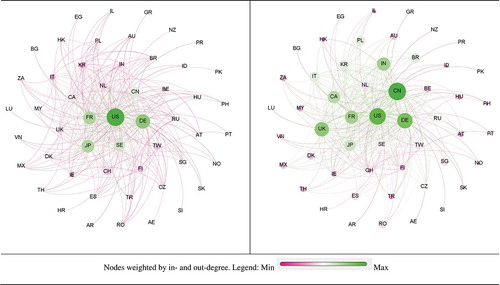
Figure 2. The ICT global innovation network in 2015.
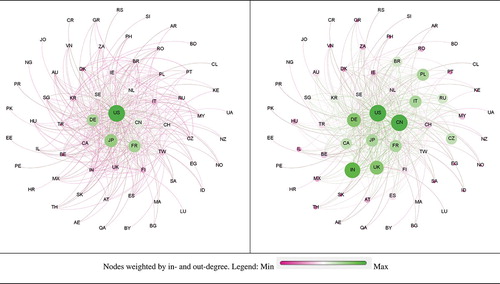
Table 3. Distribution of companies and ICT R&D centres by country of ownership, location and out- and inward internationalisation in 2011 and 2015.
The largest nodes by the number of out-going connections include the US, Japan, France, Germany, Sweden and China (see also ). The main locations of international ICT R&D include the US, China, India, Germany and the UK.
presents the distribution of R&D centres by the country of ownership and location in 2011 and 2015. In addition, we report the levels of in- and out-ward R&D internationalisation for each country in our sample. Countries are ordered by their share of ICT R&D centre ownership in total in 2015. In 2011, there were 20 countries where the firms in our sample had their headquarters. By 2015, this number had increased to 22. The largest nodes in this network include the US, Japan, France and Germany. The majority of R&D centres belong to US companies. In 2011, US firms owned 39% and, in 2015, 36% of all R&D centres. Japan and the European Union (EU) account for nearly equal shares of R&D centres (around 22%). In 2011, 52 countries hosted R&D international centres and, in 2015, 66 countries did so. The US is the main destination for foreign R&D investments. New locations for R&D include countries such as Bangladesh, Jordan and Kenya, i.e. mainly developing countries from Africa, Asia and South America.
Figures presented in show that China plays a relatively big role in the ICT GIN, in terms of ownership of international R&D centres and also as a location for foreign-owned R&D activities. Over 50% of R&D centres belonging to Chinese MNEs are located outside of China and over 80% of all R&D centres based in China belong to non-Chinese companies. This is a sign of China’s importance as an active seeker of R&D opportunities abroad, and not only as a destination for R&D investment from other countries.
The indices of network connectivity show how well the ICT GIN was connected in 2011 and 2015 (see ). The value of the network density index, i.e. a ratio of the number of existing linkages to the total number of possible connections, was 0.12 in 2011 and 0.11 in 2015, i.e. the network had 12%, or less, of all possible connections. It indicates that the network is not regular and not complete.
Table 4. ICT GIN indices.
Concerning the connectivity level of nodes, the value of the out-degree parameter is 17 (). At the same time, the average in-degree is 6.7 (). In other words, there is a consistent difference in the structure of R&D centre location and ownership connections. There are significantly more locations where R&D is performed than locations of corporate control over R&D activity.
5.1. Countries’ positions in the network
Regarding the country positions in the ICT GIN, the US comes top of nearly all the rankings presented in . This confirms its strong position as a source of control over R&D activities, as a place where foreign companies locate their R&D centres and as the hub of the ICT GIN. Concerning out-degree level, the US, Japan and European countries such as Germany and France play a key role. However, China came 5th in the out-degree ranking in 2015, indicating that Chinese companies frequently seek R&D opportunities overseas. China’s level of out-degree places it ahead of countries such as Switzerland or Canada.
Table 5. Countries’ position in the ICT GIN, 2011 and 2015.
Concerning the level of in-degree (the number of linkages with other countries), the US leads. The top 15 locations for foreign ICT R&D activity also include China (as mentioned above) and emerging countries such as India, Poland, Russia, the Czech Republic and Brazil. These countries’ relatively high ranking confirms their attractiveness as locations for high-tech R&D activities and shows how dynamic the ICT GIN has been over the last few years.
The betweenness centrality index in reflects the position of a country as a hub in the network of ICT R&D centres. The US clearly holds a strong position as a network hub. China’s move to 2nd place is however worth noting. China, and also the US and Japan can be considered as the key hubs of the ICT GIN.
5.2. Core and periphery of the ICT GIN
The observations made in the previous section concerning the betweenness and closeness centrality indices suggest that the ICT GIN may have a core/periphery structure. Thus, with a view to obtaining more information about the structure of the network and the position and role of countries in the ICT GIN, we assessed empirically whether this network exhibits a core/periphery structure. We did this for the two periods, i.e. 2011 and 2015, and compared the changes in the structure.
The notion of core/periphery is based on the fact that many real world networks can be divided into two distinct sub-groups of actors that can be identified by type and number of connections. One sub-group is referred to as the core and the others as the periphery (Laumann and Pappi Citation1977). The network core is a dense, well-connected sub-group and, conversely, the periphery consists of nodes loosely connected to each other, and also to some members of the core. In the terminology of block modelling, the core is seen as a 1-block, and the periphery is seen as a 0-block, where 1 represents the existence of a connection between two nodes and 0 the lack of it. The core/periphery structure has been found in a number of studies on, for example, scientific citations networks (Doreian Citation1985), international trade (Smith and White Citation1992) and corporate structures (Barsky Citation1999).
An empirical measure of how well the real structure approximates the ideal one, i.e. where nodes belonging to the core are connected with other nodes from the core and the periphery and nodes belonging to the periphery are only connected with some core nodes, can be defined as:
where indicates the presence or absence of a connection in the observed data, C
i
refers to the group (core or periphery) to which node i is assigned to, and
– a pattern matrix – reflects the presence or absence of a connection in the ideal image (Borgatti and Everett Citation2000). In this framework,
, i.e. the measure of core/periphery structure, achieves its maximum when, and only when, A (the matrix of
) and
(the matrix of
) are identical. In other words,
reports the results of the Pearson correlation and it can be said that a network exhibits a core/periphery structure to the extent that the correlation between the ideal structure and the data is large.
In order to detect the core/periphery structure in our data, we used a genetic algorithm to find a partition where the correlation between the data and the pattern matrix induced by the partition is maximised (Borgatti, Everett, and Freeman Citation2002). The results of the analysis are reported in .
Table 6. Core/periphery model statistics in the 2011 and the 2015 ICT GIN.
We find that the final fitness measure ρ is 0.906 for the 2011 ICT GIN and 0.827 for the 2015 ICT GIN at the significance level p < 0.001. Thus, bearing in mind that the maximum value of ρ is 1, this indicates that both ICT GINs have a core/periphery structure. This is further confirmed by the reported density measures for individual partitions. Whereas the core-core partition has a density level at 0.886 in the 2011 ICT GIN and 0.743 in the 2015 ICT GIN, the same value for the periphery–periphery partition is equal or slightly higher than zero. In other words, the nodes belonging to the core are very well connected with each other and relatively well connected with peripheral nodes. In contrast, nodes in the periphery are barely connected with each other. In conclusion, in both time periods, the ICT GIN exhibits a strong core/periphery structure.
Regarding the composition of each partition, a total of 15 countries belong to the core group in 2011 (24 in 2015), i.e. 28% (37% in 2015) of the sample, whereas the periphery consists of 39 in 2011 (41 in 2015) countries (see ). As expected, the majority of countries in the core are developed countries with a relatively high level of GDP and a sound R&D background. However, the presence of countries such as China, India or Taiwan in the core indicates that these developing countries are among the key players in the ICT GIN.
Table 7. Block membership by country in 2011 and 2015 ICT GIN.
Between 2011 and 2015 there was a change in the composition of the two blocks. 9 countries moved from the periphery to the core of the network. These countries were: Belgium, Brazil, the Czech Republic, Denmark, Ireland, Poland, Russia, Singapore, and Turkey. Thus, in 2011 the core of the network included a few, mainly developed countries, but then in 2015 it became much more heterogeneous.
6. The determinants of international R&D linkages
In order to explain the results presented in the previous sections, we must know what determines international R&D activities in terms of the structure of the ICT GIN. In order to select a set of determinants of R&D internationalisation, we relied on the existing empirical and theoretical literature on this subject (Dunning Citation1994; Kuemmerle Citation1999; Narula Citation2003; Boutellier, Gassmann, and von Zedtwitz Citation2008). As an empirical tool we used the gravity model, which is widely established in studies of international trade. (De Benedictis and Tajoli Citation2011). The gravity model has proved useful for empirical analysis of the determinants of FDI (Egger and Pfaffermayr Citation2004a, 2004b), cross-border equity flow (Portes and Rey Citation2005) and R&D internationalisation (Picci Citation2010).
The gravity model specification allowed us to formulate predictions concerning the structure of the network, i.e. the existence of trade or R&D relationships between countries. The straightforward form of the gravity equation can be expressed as:
Our analysis focused on explaining the determinants of the intensity and creation of R&D linkages between countries in the ICT GIN. The intensity of R&D linkages is proxied by the number of R&D centres located in country j and owned by a company from country i.Footnote4 This measure refers to the 2015 ICT GIN. With respect to the creation of R&D linkages between countries in the ICT GIN, we used the difference between the number of R&D centres for each pair of countries in 2015 and the number in 2011.
The dependent variables were count variables. We modelled the probability that a country i establishes a linkage with country j, i.e. , and the intensity of these linkages, i.e.
, as vectors of attributes of both countries (
), as:
The Poisson approach is often used to specify this probability function:
where ,
and
, where
and
are vectors of unknown parameters to be estimated. The Poisson estimation requires that
is both the mean and the variance. However, as we have shown in the previous section, the dependent variable controlling for the number of R&D centres per linkage may not meet these requirements. Thus, an alternative would be to select a distribution other than Poisson, which would allow the variance to be greater than the mean. The negative binomial distribution is often more appropriate in cases of over-dispersion (Cameron and Trivedi Citation1998). Thus, in order to check the robustness of the results, we ran estimations using negative binomial regression. The additional estimations did not change our results.
Our dependent variable had many zero values, which would probably have produced biased results (Martin and Pham Citation2015). Hence, although a Poisson estimation is expected to provide unbiased results even when zero values are frequent (Santos Silva and Tenreyro Citation2011), we included in our estimation all the potential linkages between countries in our sample.
We proceeded to formulate a model in which we expected the intensity of R&D linkages between countries to depend on some of its characteristics. To identify these determinants, we derived a set of factors that are used in studies which conceptualise the issue of R&D internationalisation (Dunning Citation1994; Kuemmerle Citation1999; Narula Citation2003; Boutellier, Gassmann, and von Zedtwitz Citation2008). In addition, in order to capture the effect of the network position of a country on the intensity of international R&D linkages, we included network measures which controlled for the position of countries in the ICT GIN. In order to avoid the problem of endogeneity, we estimated the effect of a country’s network measures computed for the ICT GIN in 2011 on the number and change of R&D centres. In formal terms, our function of the intensity and creation of R&D connections between countries takes the following form:
As mentioned above, we looked at the determinants of the intensity and creation of R&D linkages between countries. Hence, when speaking of the intensity of the linkages, represents the count of R&D centres located in country j and owned by a company from country i. This number refers to the year 2015. In turn, when looking at the creation of linkages,
represents the change in the number of R&D centres located in country j and owned by a company from country i. The difference is computed for the time period between 2015 and 2011. Independent variables include geographical and cultural proximity between countries, their economic size, innovative potential and positions in the ICT GIN. Network measures refer to the network in 2011.
Concerning the geographical proximity, we used a variable which controls for the distance between countries i and j, . In addition, in order to account for other frictions in inventive collaboration resulting from cultural differences, we included a dummy variable
, which indicated whether two countries shared a common official language (Mayer and Zignago Citation2011).
Regarding the economic size of countries linked through an R&D centre, information on GDP (in current US$ in 2015) for both the R&D centre host country i and the control country j is included (IMF Citation2015). These measures are intended to account for the attractiveness of a foreign market j from a perspective of a company with origin in country i. A positive sign of a coefficient would confirm the asset exploitation strategy, as defined in (Kuemmerle Citation1999).
Knowing that the size of a country may also affect the existence and intensity of R&D relationships between countries, we controlled for the size of population. As with the economic size of a country, we included information on population size for both the R&D centre host country i and the control country j. The rationale behind controlling for the size of a control country is that large countries have more firms doing R&D and hence are likely to have more linkages. In turn, including the effect of population size of a host country is related to its potential market size and hence its economic attractiveness.
In addition, we controlled for the innovation performance of an R&D-hosting and -owning country. From the perspective of a host country, j, the measure of its inventive performance indicates the inventive capacity which may attract R&D-related investments. From the perspective of an R&D-owning country, i, it indicates its inventive absorptive capacity. The innovation performance of a country is captured by the total number of patent applications made by residents of this country.
Lastly, a vector of network measures included in the above specification, N, contains the measure of in- and out-degree, closeness and betweenness centrality of country i and j in 2011. The main reason for including these measures to explain the internationalisation of R&D activities is related to the fact that standard statistical techniques treat linkages as features of single countries (Fagiolo, Reyes, and Schiavo Citation2007). Hence, a country’s decision to locate an R&D centre in a foreign country is considered in the same way as other country-specific variables, like GDP, population size or innovation capacity. However, R&D location decisions and subsequent knowledge and technology flows have to do with both the origin and the target country, and also other countries in the network. While standard measures allow us to analyse only first-order relationships (e.g. ownership/hosting of R&D centre between any pair of countries), network analysis allows us to study second- and/or higher order relationships. For example, the creation of bilateral linkages between two countries involving R&D collaboration or trade in R&D services can affect the creation of these linkages between a different pair of countries. Network measures are expected to capture externalities of this kind, which in practice are frequently treated as unobserved heterogeneity or controlled for with country effect estimators.
7. Empirical results
7.1. The determinants of R&D linkages in the ICT GIN
presents the results of the regressions where the dependent variable is the number of R&D centres per linkage in 2015. First, we reported estimations with variables controlling for countries’ geographic and cultural proximity, their economic size and their inventive performance. Subsequently, we added lagged network indices to the specification. Because some of the network measures were strongly correlated with GDP, e.g. betweenness centrality, we ran additional regressions without the variables controlling for countries’ GDP in order to check the robustness of these results.
Table 8. Estimation results of the determinants of the linkages in the GIN.
All the coefficients of the standard gravity model, i.e. distance, common language, the economy size, have the expected signs. The variables controlling for the size of countries have a negative impact on the existence of a R&D linkage between two countries. In other words, most of the relationships take place between relatively small countries. Furthermore, the coefficients related to the number of patents also reveal that innovation performance has a significant impact on the existence of R&D linkages between countries. From the perspective of country i, the positive impact of innovation performance is related to a country’s absorptive capacity and increases the probability of establishing an R&D centre abroad. A positive sign observed for country j indicates that the inventive capacity of an R&D centre-hosting country is one of the key determinants of a decision to establish such a facility. This suggests that a country’s market size and innovation capacity are important factors in the choice of a location for R&D facilities. In other words, we can accept the first and the second hypothesis formulated in Section 2.1.
Turning our attention to the core of our analysis, i.e. the impact of a country’s position in the ICT GIN on the creation of R&D linkages, we observe that relevant network measures are highly significant. For example, the out-degree of country i, i.e. a country whose companies locate R&D centres abroad, has a negative impact on the creation of R&D linkages. In contrast, the out-degree of country j, i.e. a country hosting foreign R&D centres, has a positive impact on the formation of R&D linkages. Similarly, the in-degree of country i seems to have a stronger positive effect on the creation of R&D links between countries. The negative effects of the out-degree of country i and the in-degree of country j, although the latter is statistically insignificant, can be interpreted as follows: countries which already have a high number of linkages are less likely to create new links. This rather surprising finding is consistent with, for example, the effect of a country’s in-degree on its trade linkages, i.e. where there is a decreasing marginal advantage of increasing the in-degree (De Benedictis and Tajoli Citation2011). This suggests that R&D internationalisation is subject to diminishing returns.
Finally, measures of betweenness, i.e. of the role of a hub in the network, have the strongest impact on the dependent variable. Furthermore, we observe that the closeness of country j in the network increases the likelihood of creating new R&D links. This finding is further strengthened by the relevance of the in-degree of country i and the out-degree of country j. Thus, countries that are ‘close’ to the remaining countries, i.e. those with short geodesic distances to other countries in the network, are strongly favoured over those that are on the outskirts of the network. This finding implies that R&D centre location choices have spillover effects. Furthermore, this suggests that connections in the ICT GIN are driven by the preferential attachment principle, i.e. nodes that already have many connections are more attractive as partners (Barabási and Albert Citation1999).
The inclusion of network indices also has a considerable impact on standard gravity variables, which are traditionally considered to be important drivers of international collaboration. For example, the negative effect of proximity is considerably weakened or irrelevant. This does not come as a surprise, as the position of a country in the ICT GIN can be independent of its geographical position. The intensive collaboration between, for example, the US and China or some European countries is a clear example of this. The network indices also reduce the role of GDP and increase the importance of population. In the light of the results that stem from a standard gravity model, i.e. regression (1) in , this suggests that it is the potential rather than the actual economic size of a country that influences the intensity of R&D linkages between the countries. Moreover, the results are not sensitive to the exclusion of the variable which controls for countries’ economic size (regression (6) in ).
7.2. The determinants of the change of intensity of R&D linkages in the ICT GIN
presents the results of the regressions where the dependent variable was the change in the number of R&D centres per linkage during 2011 and 2015. First we report estimations with variables controlling for countries’ geographic and cultural proximity, their economic size and their inventive performance. Subsequently, we extend these specifications by lagged network indices. As before, we ran additional regressions without the variables controlling for countries’ GDP in order to check the robustness of these results.
Table 9. Estimation results of the determinants of the change of intensity of R&D linkages in the ICT GIN.
In general, the coefficients of the standard gravity model have the expected signs. In this case also, the population size of both countries has either no impact or a negative impact on the likelihood of increasing the number of R&D connections.
Regarding the effect of a country’s position in the ICT GIN on the creation of R&D linkages, we again observe the great importance of network measures. In particular, the closeness centrality of both countries and the betweenness centrality of host countries are important drivers of the formation of R&D linkages. Of the remaining network measures, the in-degree of a country for R&D centre ownership and the out-degree of a country for R&D centre location have positive and significant signs. At the same time, the out-degree of a country for R&D centre ownership has a negative impact on the likelihood of an R&D link being created. In other words, R&D centres are mainly located in countries which usually source their R&D services from abroad. Hence, the creation of R&D linkages takes place mainly between countries that are already strongly involved in the internationalisation of R&D activity, i.e. those that are at the core of the network. This again hints at the importance of the preferential attachment principle in the evolution of the ICT GIN.
As in the previous case, the inclusion of network indices affects the standard gravity variables. The most interesting is that the coefficient controlling for the distance between two countries changes to positive. It shows that, unlike trade, the internationalisation of R&D activities is less affected by physical distance. This way, the inclusion of the network indices allows us to better understand the mechanism behind the creation of R&D linkages between distant and different countries, such as the US and China or India. Finally, the results are not affected by the exclusion of the variable controlling for the economic size of countries (regression (6) in ).
8. Conclusions
This study reveals that there is a consistent difference in the structure of R&D ownership and R&D location. Whereas global corporate ownership of R&D activity is very concentrated, its location is globally dispersed. The ICT GIN also shows signs of ‘cliquishness’, in that countries establish R&D relationships with countries that they are already connected with. This type of clustering reveals that there are strong ‘local’ linkages, which do not, however, imply geographical or cultural proximity. As a result, a strong position in the ICT GIN network has positive implications for the creation of R&D linkages with other countries. Moreover, network indices strongly affect the standard gravity model variables. For example, when controlling for a country’s position in the network, the coefficient sign of the distance variable is positive. This explains the intensive relationships between countries as distant and different from each other as the US, China or India.
One finding worth emphasising is that the number of R&D connections is negatively related to the intensity of these interactions. This is a very important point, considering that the likelihood of forming a linkage in the ICT GIN does not depend on the number of connections a country maintains with other countries, but rather on the quality of these connections. In particular, relative closeness to other countries seems to play a key role. This shows some similarities to international trade dynamics, where there is a trade-off between the number of linkages and the volume of flows. It seems that R&D exchange is also subject to decreasing marginal advantage as the number of linkages increases. This could be a result of externalities. For example, by setting up an R&D centre in a certain location, a firm creates externalities that affect other firms, e.g. increased competition for skilled labour or knowledge spillovers. This, in turn, can affect the decision of other firms to set up R&D facilities in the same place.
The GIN does not share all the properties of the trade network. The role of physical distance is not the same as it is in trade gravity models. Due to digitisation, i.e. information and knowledge is stored in digital rather than physical format, the way information and knowledge is handled, manipulated and created changes. At the aggregated level, this implies a transformation of the economic structures that rely on information and knowledge to produce goods and services. The heavy use of digitised information by the ICT sector allows it to overcome the limitations of distance. Ultimately, this makes the way the ICT GIN functions different from, for example, that of trade networks.
Regarding the methodology used in this paper, we show that network analysis can help to capture the complexity of GINs and the evolution of R&D linkages between countries. Thus, it offers a new perspective on the organisation of R&D activities and helps us to understand the process of interactions with other actors. Network analysis shows that a country’s position in the innovation network depends on its ability to develop collaboration mechanisms that support mutual co-dependencies with other countries. Managers and policy-makers need to be more alert to these mechanisms than before in order to spot opportunities and act on them. First of all, the GIN is a result of the international division of innovation processes in which countries participate and in which firms have a broader capacity to access and combine knowledge from a variety of sources (Sachwald Citation2008). Consequently, when designing R&D and innovation policies, policy-makers should give them a multinational dimension, acknowledging that whatever happens in one country affects the remaining countries and vice versa. This means that although building a strong knowledge base is a necessary condition for participating in the GIN, it may not be a sufficient condition to get the most out of this participation. Rather than designing policies driven by the notion of competition for innovation resources and the corresponding pay-offs, it may be advisable to create a mutually beneficial system of collaboration, taking into account interactions with a large number of players. Second, one of the main reasons behind the emergence of the ICT GIN is the increasing complexity of technologies. This requires both firms and countries to specialise. Thus, innovation policies should include a solid assessment of a country’s strengths and mechanisms for their enhancement, with a view to finding and maintaining a strategic position in the technological network. This point is clearly emphasised by the disproportionately high number of sources of R&D services, as compared to the number of countries procuring these services. A country’s attractiveness as a location for these R&D activities, and hence its bargaining power, both strongly depend on its technological uniqueness.
This study has some limitations. First of all, the data used cover only a selection of companies. Second, the two images of the ICT GIN in 2011 and 2015 do not allow us to draw long-term conclusions with respect to this network’s dynamics and evolution. Finally, the information on the R&D activities of the companies selected is also limited. This considerably reduces our ability to investigate the intensity and quality of R&D connections between countries (Annex).
Disclaimer
The views expressed are those of the authors and may not in any circumstances be regarded as stating an official position of the European Commission.
Disclosure statement
No potential conflict of interest was reported by the authors.
Notes
1 We focus on bilateral relationships between countries and do not take into account loops, i.e. when a company’s R&D centre and headquarter is located in the same country.
3 Altogether, these patent offices account for 99% of the total number of priority patent applications filed worldwide.
4 In order to check the robustness of the results, we ran regressions with dependent variable based on the number of R&D types. Because the results were not qualitatively different from those reported here, they were not included and are available upon request.
References
- Anderson, J., and E. van Wincoop. 2003. “Gravity with Gravitas: A Solution to the Border Puzzle.” American Economic Review 93 (1): 170–192.10.1257/000282803321455214
- Barabási, A., and R. Albert. 1999. “Emergence of Scaling in Random Networks.” Science 286 (5439): 509–512.
- Barnard, H., and C. Chaminade. 2011. Global Innovation Networks: What are they and Where Can We Find Them? Conceptual and Empirical Issues. Lund University, CIRCLE – Center for Innovation, Research and Competences in the Learning Economy.
- Barsky, N. P. 1999. “A Core/Periphery Structure in a Corporate Budgeting Process.” Connections 22 (2): 22–29.
- Bartholomew, S. 1997. “National Systems of Biotechnology Innovation: Complex Interdependence in the Global System.” Journal of International Business Studies 28 (2): 241–266.10.1057/palgrave.jibs.8490100
- Bartlett, C., and S. Ghoshal. 1990. “Managing Innovation in the Transnational Corporation.” In Managing the Global Firm, edited by C. Bartlett, Y. Doz, and G. Hedlund, 215–255. London: Routledge.
- Belderbos, R., K. Fukao, and T. Iwasa. 2006. Foreign and Domestic R&D Investment. Kunitachi: Institute of Economic Research, Hitotsubashi University.
- Borgatti, S., and M. Everett. 2000. “Models of Core/Periphery Structures.” Social Networks 21 (4): 375–395.10.1016/S0378-8733(99)00019-2
- Borgatti, S. P., M. G. Everett, and L. C. Freeman. 2002. Ucinet for Windows: Software for Social Network Analysis. Harvard, MA: Analytic Technologies.
- Boutellier, R., O. Gassmann, and M. von Zedtwitz. 2008. Managing Global Innovation: Uncovering the Secrets of Future Competitiveness. Heidelberg: Springer.10.1007/978-3-540-68952-2
- Breschi, S., and F. Lissoni. 2004. Knowledge Networks from Patent Data: Methodological Issues and Research Targets: KITeS, Centre for Knowledge, Internationalization and Technology Studies. Milano: Universita’ Bocconi.
- Cameron, A. C., and P. K. Trivedi. 1998. Regression Analysis of Count Data. Cambridge: Cambridge University Press.10.1017/CBO9780511814365
- Dachs, B., and A. Pyka. 2010. “What Drives the Internationalisation of Innovation? Evidence from European Patent Data.” Economics of Innovation and New Technology 19 (1): 71–86.10.1080/10438590903016476
- De Benedictis, L., and L. Tajoli. 2011. “The World Trade Network.” The World Economy 34 (8): 1417–1454.10.1111/twec.2011.34.issue-8
- De Prato, G., and D. Nepelski. 2014. “Global Technological Collaboration Network. Network Analysis of International Co-inventions.” Journal of Technology Transfer 39 (3): 358–375.
- Doreian, P. 1985. “Structural Equivalence in a Psychology Journal Network.” Journal of the American Society for Information Science 36 (6): 411–417.10.1002/(ISSN)1097-4571
- Dunning, J. 1988. “The Eclectic Paradigm of International Production: A Restatement and Some Possible Extensions.” Journal of International Business Studies 19 (1): 1–31.10.1057/palgrave.jibs.8490372
- Dunning, J. 1994. “Multinational Enterprises and the Globalization of Innovatory Capacity.” Research Policy 23 (1): 67–88.10.1016/0048-7333(94)90027-2
- Egger, P., and M. Pfaffermayr. 2004a. “Distance, Trade and FDI: A Hausman-Taylor SUR Approach.” Journal of Applied Econometrics 19 (2): 227–246.10.1002/(ISSN)1099-1255
- Egger, P., and M. Pfaffermayr. 2004b. “The Impact of Bilateral Investment Treaties on Foreign Direct Investment.” Journal of Comparative Economics 32 (4): 788–804.10.1016/j.jce.2004.07.001
- Ernst, D. 2000. “Global Production Networks and the Changing Geography of Innovation Systems: Implications for Developing Countries.” East-West Center Working Papers No. 9, East-West Center, Hawaii, USA.
- Ernst, D. 2002. “Digital Information Systems and Global Flagship Networks: How Mobile is Knowledge in the Global Network Economy?” East-West Center Working Papers No. 48, East-West Center, Hawaii, USA.
- Fagiolo, G., J. Reyes, and S. Schiavo. 2007. The Evolution of the World Trade Web. Pisa: Laboratory of Economics and Management (LEM), Sant’Anna School of Advanced Studies.
- Freeman, L. C. 1978. “Centrality in Social Networks Conceptual Clarification.” Social Networks 1 (3): 215–239.10.1016/0378-8733(78)90021-7
- Gassler, H., and B. Nones. 2008. “Internationalisation of R&D and Embeddedness: The Case of Austria.” The Journal of Technology Transfer 33 (4): 407–421.10.1007/s10961-007-9048-9
- Glänzel, W., and A. Schubert. 2005. “Analysing Scientific Networks through Co-authorship.” In Handbook of Quantitative Science and Technology Research, edited by H. Moed, W. Glänzel, and U. Schmoch, 257–276. Dordrecht: Springer.10.1007/1-4020-2755-9
- Graf, H., and J. Kruger. 2011. “The Performance of Gatekeepers in Innovator Networks.” Industry and Innovation 18 (1): 69–88.10.1080/13662716.2010.528932
- Guellec, D., and B. Van Pottelsberghe de la Potterie. 2001. “The Internationalisation of Technology Analysed with Patent Data.” Research Policy 30 (8): 1253–1266.10.1016/S0048-7333(00)00149-9
- Head, K., T. Mayer, and J. Ries. 2010. “The Erosion of Colonial Trade Linkages after Independence.” Journal of International Economics 81 (1): 1–14.10.1016/j.jinteco.2010.01.002
- Hsueh, C. C., and C. C. Wang. 2009. “The Use of Social Network Analysis in Knowledge Diffusion Research from Patent Data.” Paper presented at the 2009 International Conference on Advances in Social Network Analysis and Mining.
- ICB. 2010. Industry Classification Benchmark. Accessed June6, 2015, https://www.icbenchmark.com/
- IHS-Markit. 2011. Top OEM R&D Center Database. https://www.ihs.com/.
- IMF. 2015. Internaional Monetary Fund Data. https://www.imf.org/external/data.htm#data.
- JRC. 2015. The 2015 EU Industrial R&D Investment Scoreboard. Seville: European Commission, JRC.
- Kretschmer, H. 2004. “Author Productivity and Geodesic Distance in Bibliographic Co-authorship Networks, and Visibility on the Web.” Scientometrics 60 (3): 409–420.10.1023/B:SCIE.0000034383.86665.22
- Kuemmerle, W. 1999. “The Drivers of Foreign Direct Investment into Research and Development: An Empirical Investigation.” Journal of International Business Studies 30 (1): 1–24.10.1057/palgrave.jibs.8490058
- Kumar, N. 2008. “Internationalization of Indian Enterprises: Patterns, Strategies, Ownership Advantages, and Implications.” Asian Economic Policy Review 3 (2): 242–261.10.1111/aepr.2008.3.issue-2
- Li, G.-C., R. Lai, A. D’Amour, D. M. Doolin, Y. Sun, V. I. Torvik, A. Z. Yu, and L. Fleming. 2014. “Disambiguation and Co-authorship Networks of the U.S. Patent Inventor Database (1975–2010).” Research Policy 43 (6): 941–955.
- Laumann, E., and F. Pappi. 1977. “Networks of Collective Action: A Perspective on Community Influence Systems.” The Journal of Politics 39 (3): 832–833.
- Martin, W., and C. Pham. 2015. Estimating the Gravity Model When Zero Trade Flows Are Frequent and Economically Determined. Washington, DC: World Bank.10.1596/prwp
- Mayer, T., and S. Zignago. 2011. Notes on CEPII’s Distances Measures: The GeoDist Database. Paris.
- Narula, R. 2003. Globalization and Technology: Interdependence, Innovation Systems and Industrial Policy. Cambridge: Polity Press.
- Nepelski, D., and G. De Prato. 2012. “Internationalisation of ICT R&D: A Comparative Analysis of Asia, EU, Japan, US and the RoW.” Asian Journal of Technology Innovation 20 (2): 219–238.10.1080/19761597.2012.741392
- Nepelski, D., and G. De Prato. 2015. “Corporate Control, Location and Complexity of ICT R&D: A Network Analysis at the City Level.” Urban Studies 52 (4): 721–737.10.1177/0042098014534735
- Niosi, J., and B. Bellon. 1994. “The Global Interdependence of National Innovation Systems: Evidence, Limits, and Implications.” Technology in Society 16 (2): 173–197.10.1016/0160-791X(94)90028-0
- Patel, P., and K. Pavitt. 1991. “Large Firms in the Production of the World’s Technology: An Important Case of ‘Non-Globalisation’.” Journal of International Business Studies 22 (1): 1–21.10.1057/palgrave.jibs.8490289
- Picci, L. 2010. “The Internationalization of Inventive Activity: A Gravity Model Using Patent Data.” Research Policy 39 (8): 1070–1081.10.1016/j.respol.2010.05.007
- Pittiglio, R., E. Sica, and S. Villa. 2009. “Innovation and Internationalization: The Case of Italy.” The Journal of Technology Transfer 34 (6): 588–602.10.1007/s10961-009-9107-5
- Portes, R., and H. Rey. 2005. “The Determinants of Cross-border Equity Flows.” Journal of International Economics 65 (2): 269–296.10.1016/j.jinteco.2004.05.002
- PREDICT. 2015. The 2015 PREDICT Report. An Analysis of ICT R&D in the EU and beyond. 2015 Database. Seville: European Commission, JRC-IPTS.
- Sachwald, F. 2008. “Location Choices within Global Innovation Networks: The Case of Europe.” The Journal of Technology Transfer 33 (4): 364–378.10.1007/s10961-007-9057-8
- Santos Silva, J., and S. Tenreyro. 2011. “Further Simulation Evidence on the Performance of the Poisson Pseudo-maximum Likelihood Estimator.” Economics Letters 112 (2): 220–222.10.1016/j.econlet.2011.05.008
- Shin, N., K. Kraemer, and J. Dedrick. 2009. “R&D, Value Chain Location and Firm Performance in the Global Electronics Industry.” Industry and Innovation 16 (3): 315–330.10.1080/13662710902923867
- Smith, D. A., and D. R. White. 1992. “Structure and Dynamics of the Global Economy: Network Analysis of International Trade 1965–1980.” Social Forces 70 (4): 857–893.10.2307/2580193
- Tassey, G. 2007. The Technology Imperative. Cheltenham: Edward Elgar Publishing.
- Thomson, R. 2013. “National Scientific Capacity and R&D Offshoring.” Research Policy 42 (2): 517–528.10.1016/j.respol.2012.07.003
- Yoon, J., A. Blumer, and K. Lee. 2006. “An Algorithm for Modularity Analysis of Directed and Weighted Biological Networks Based on Edge-betweenness Centrality.” Bioinformatics 22 (24): 3106–3108.10.1093/bioinformatics/btl533
- Zander, I. 2002. “The Formation of International Innovation Networks in the Multinational Corporation: An Evolutionary Perspective.” Industrial and Corporate Change 11 (2): 327–353.10.1093/icc/11.2.327
Annex
Table A1. Descriptive statistics.
Table A2. Pair-wise correlations between variables.