
 ?Mathematical formulae have been encoded as MathML and are displayed in this HTML version using MathJax in order to improve their display. Uncheck the box to turn MathJax off. This feature requires Javascript. Click on a formula to zoom.
ABSTRACT
Existing research has emphasised various mechanisms for knowledge exchange in industry clusters, including inter-firm collaboration, labour mobility, and monitoring of other firms. However, these mechanisms are normally studied in isolation, and we know little about how they interrelate. This paper examines which firms collaborate within a cluster. We ask whether knowledge exchanges through other channels, specifically monitoring and labour mobility, are positively or negatively associated with collaboration. We use data from interviews with 30 firms in the subsea sector in Rogaland, Norway, representing nearly the entire population of the cluster, to examine the association between the different forms of linkages. The results from Social Network Analysis reveal an overall high degree of knowledge exchange among the organisations making up the subsea cluster. Furthermore, using Quadratic Assignment Procedure (QAP) regression analysis, we find that collaborative linkages are significantly more likely to exist between firms which share recruitment and/or monitoring linkages.
1. Introduction
Literature in economic geography and innovation studies has long been preoccupied with the co-location of firms in clusters and industrial districts, and in particular with the potential for knowledge exchange between co-located actors resulting in innovation. It is increasingly recognised that co-location does not automatically lead to knowledge exchange, and that it is therefore necessary to study bilateral exchanges between actors and the networks created by these (Boschma and Ter Wal Citation2007; Giuliani and Bell Citation2005; Morrison and Rabellotti Citation2009). Empirical studies building on social network analysis have revealed that clusters may contain very different network structures and thus different conditions for local knowledge exchange and innovation (Calignano, Fitjar, and Kogler Citation2018; Giuliani Citation2011; Sammarra and Biggiero Citation2008).
Furthermore, these knowledge exchanges may take place through a wide range of mechanisms. Some of the most frequently studied mechanisms include inter-firm collaboration on projects and products (Balland Citation2012; Schilling and Phelps Citation2007; Vicente, Balland, and Brossard Citation2011), observation and monitoring of other firms for inspiration (Malmberg and Maskell Citation2002; Martin and Moodysson Citation2013; Trippl, Tödtling, and Lengauer Citation2009), and labour mobility spreading tacit knowledge and information of other firms’ activities and procedures (Almeida and Kogut Citation1999; Casper Citation2007; Fleming and Frenken Citation2007; Kesidou and Romijn Citation2008; Power and Lundmark Citation2004; Timmermans and Boschma Citation2014).
While inter-firm collaboration has been a frequent topic of research in this field, relatively little is known about how such collaborations relate to other channels for knowledge exchange. Inter-firm collaboration does not emerge spontaneously or as a result of random encounters, but is more often than not purpose-built following careful searches (Fitjar and Rodríguez-Pose Citation2017). There is an emerging literature on the formation of collaboration networks, exploring e.g. how spatial, network and other types of distances (Autant-Bernard et al. Citation2007; Broekel and Hartog Citation2013; Ter Wal Citation2014) affect the likelihood of collaboration. However, these studies have mostly not considered the relationship between collaboration patterns and other knowledge exchange linkages between the same firms. Hence, the question of which firms choose to collaborate within clusters and, in particular, how this relates to other relationships between the firms, is still underexplored.
Geographical, cognitive and other types of distances between the firms will surely affect the prospects for knowledge exchange, regardless of whether this takes place through collaboration, monitoring or labour mobility. In each of these dimensions, firms will develop linkages based on their assessment of the relevance and importance of the knowledge that the partner possesses, and on their knowledge of and familiarity with potential partners. However, there may also be a more direct relationship between the different knowledge exchange relationships.
If a firm can already learn from a potential partner through labour mobility linkages or from monitoring, direct collaboration might be less important as the scope for additional learning is limited. Although the different channels may be more or less useful for the exchange of certain types of knowledge, there can also be overlaps in the knowledge which is accessible through different channels. From a purely utilitarian perspective, one might therefore expect a negative relationship between the different channels of knowledge exchange. However, collaborative linkages are also socially embedded, and labour mobility and monitoring might bring new information about potential collaboration partners. If this is the case, a positive relationship between the channels would be expected.
In this paper, we examine these relationships using network data from 30 firms in an industrial cluster, specifically the subsea industry in Rogaland, Norway. The study is based on personal interviews with managers in the 30 firms, representing nearly the full population of firms in the industry. The managers provided details on all firms within and beyond the cluster with whom they collaborated. They also specified from which firms they gained inspiration through monitoring, and from which firms they recruited skilled labour. The paper analyses the networks of internal and external linkages created by these knowledge exchanges. Subsequently, we analyse the relationship between the three channels with the use of quadratic assignment procedure (QAP) regression, while controlling for proximity between the firms in other dimensions. The analysis provides strong support for the idea of a positive relationship between the various mechanisms of knowledge exchange: Firms are significantly more likely to collaborate with firms from which they recruit skilled labour or which they monitor for inspiration.
In the following section, we further elaborate on the three mechanisms for knowledge exchange: collaboration, monitoring and labour mobility, and present our hypotheses about the relationships between them. In section 3, we introduce the case study and the method used. Section 4 presents the results from the Social Network Analysis and the logistic QAP regression. The final section concludes with a discussion of the results and their implications.
2. Mechanisms for knowledge exchange
Network ties between firms (e.g. between business partners, suppliers and customers) and their employees (e.g. between family, friends and colleagues) link actors in multiple dimensions and provide opportunities for the exchange of knowledge. Being embedded in networks ‘shifts actors’ motivation away from the narrow pursuit of immediate economic gains toward enrichment of relationships through trust and reciprocity’ (Uzzi Citation1996, 677). Because of this, ‘interfirm networks facilitate the creation of important economic outcomes’ (Uzzi Citation1996, 677), such as innovation.
However, firms or individuals do not automatically exchange knowledge with other actors with whom they are connected. The exchange of knowledge takes place through specific mechanisms that allow for learning, i.e. where information is transferred from one firm to another and enables a change of behaviour in the receiving firm. Such mechanisms include formal relations between firms, such as collaboration on projects where each firm provides certain knowledge inputs to solve a joint problem. However, they can also be informal relations, where knowledge transfer from the sending firm is more unintentional and takes the form of spillovers. Examples of this include recruitment of specialists, and monitoring and observation of competitors’ activities (Trippl, Tödtling, and Lengauer Citation2009). These correspond to the three main mechanisms highlighted in Malmberg and Power’s (Citation2005) review of how firms in clusters exchange knowledge: inter-organisational collaboration, observation/monitoring, and local labour mobility.
Firms’ embeddedness in such knowledge exchange networks varies. Some firms are more technologically advanced or have specific competences that make them more attractive to collaborate with, monitor and recruit from. Larger and more technologically advanced firms tend to have more linkages than smaller firms (Giuliani and Bell Citation2005), as maintaining linkages to other firms requires resources. Furthermore, networks tend to take on their own dynamics. Firms that are central in the network attract more attention and have more opportunities for knowledge exchange (Giuliani Citation2007; Tsai Citation2001). Firms also tend to develop new linkages with partners that are close to them within the network (Autant-Bernard et al. Citation2007; Ter Wal Citation2014).
The proximity between firms in other dimensions also affects the formation of linkages. Cognitive proximity makes it easier to understand and apply the knowledge gained through such linkages in the firm’s own activities (Nooteboom Citation2000; Boschma Citation2005; Balland, Boschma, and Frenken Citation2015). Geographical proximity allows for frequent face-to-face contact that helps the exchange of tacit knowledge (Katz Citation1994; Storper and Venables Citation2004). Cultural proximity reduces the barriers to communication and helps the partners understand each other due to common interpretations and routines (Knoben and Oerlemans Citation2006). Besides these utility considerations, homophily is also a well-known attribute of social networks (McPherson, Smith-Lovin, and Cook Citation2001), leading to the selection of proximate partners regardless of whether these offer the best opportunities for knowledge exchange.
These dynamics create networks which become increasingly dense over time (Leskovec, Kleinberg, and Faloutsos Citation2007). However, if the networks are too close and rigid, the learning effects may disappear. When there are too few new insights and ideas, ‘the local connectedness […] may become so excessive that fundamental renewal is not on the mindset and is even heavily contested by local network players’ (Boschma Citation2015, 11). This leads to a risk of lock-in in the industry (Martin and Sunley Citation2006).
Previous studies have usually analysed particular mechanisms for knowledge exchange, i.e. focusing typically on either collaboration or labour mobility. When different mechanisms have been included in the same study, the question has often been related to their relative importance for the exchange of knowledge (Kesidou and Romijn Citation2008; Malmberg and Power Citation2005; Trippl, Tödtling, and Lengauer Citation2009), or under which circumstances each mechanism is used (Malmberg and Maskell Citation2002; Martin and Moodysson Citation2013; Martin and Rypestøl Citation2018). However, few studies have looked at the relationship between different knowledge exchange mechanisms, i.e. on whether exchange through one mechanism can support or deter exchange through another. The exception is a limited number of studies examining the link between labour mobility and collaboration (Fleming and Frenken Citation2007).
2.1. Why and with whom do firms collaborate?
It is hard for firms to stay innovative and create new ideas in isolation. For most firms, it is fruitful or even vital to connect to other actors to get access to new knowledge, and to speed up the commercialisation of their new products and services (Chesbrough Citation2003). Firms may collaborate to gain access to complementary technologies and knowledge, speed up their innovation processes, or share and reduce the costs and risks deriving from innovation (Trippl, Tödtling, and Lengauer Citation2009). They need to find collaboration partners that will help them achieve this aim. Better understanding the process whereby firms identify useful new partners is therefore of great interest for industry and policy makers.
Firms may collaborate with different types of partners and for different reasons. They may collaborate with customers to gain better understanding about future demand. They may collaborate with suppliers to acquire knowledge about new materials, new technologies and production methods. They may also collaborate with competitors to combine skills, share knowledge and be able to obtain scale economies (Ahuja Citation2000b).
Collaboration, especially between competitors, involves a risk of collaborating partners acting opportunistically. This gives firms incentives to keep knowledge to themselves to ensure ownership rights and return on investments when creating new knowledge (Boschma Citation2005). Because the benefits of collaboration might exceed these risks, many firms nonetheless choose to collaborate. In these cases, trust and norms of collaboration are important (Ahuja Citation2000b). Social and institutional proximity (Balland Citation2012) and meeting face-to-face may increase trust and can reduce the costs of communication (Bathelt and Turi Citation2011; Storper and Venables Citation2004). The decision to continue collaborating with a partner will depend on the outcome and experience from current collaboration. In dense networks, where several actors collaborate with each other, information about firms acting opportunistically will soon reach other firms in the network. This might prevent opportunistic behaviour (Ahuja, Citation2000a).
Maintaining many collaboration linkages might be costly because relationships need to be nurtured in order to stay effective (Laursen and Salter Citation2006). Firms will therefore choose collaboration partners that will benefit them in both the short and long term. Collaborations are mostly purpose-built and rarely emerge through random encounters (Fitjar and Rodríguez-Pose Citation2017). However, firms may also have a limited search scope, meaning they will mostly consider organisations and individuals who they know and trust when selecting partners (Fitjar and Gjelsvik Citation2018). The decision on who to collaborate with is therefore based on utility considerations as well as social relations.
In either case, other linkages between the firms can be important in deciding to collaborate. Firms must research potential partner firms before initiating collaboration. Monitoring other firms and consulting with employees recruited from other firms can be part of that information gathering process and therefore contribute to future collaboration partnerships for the initiating partner. Other types of networks might also help firms to make themselves more attractive to partners with which they wish to collaborate. Furthermore, monitoring and labour mobility linkages create social connections across firms which help to build trust and awareness of each other’s strengths and potentials. This allows for deeper collaboration linkages to emerge.
2.2. Monitoring and collaboration
Monitoring is a way of getting information without directly engaging with other firms. This information can be obtained from direct observation of other firms’ products and processes, or second-hand through sources ranging from gossip to printed media (Martin and Moodysson Citation2013). The information gained from monitoring is general and unselected, and the cost of getting the information is low. In clusters, firms can ‘monitor each other constantly, closely, and almost without effort or cost’ (Malmberg and Maskell Citation2002, 439). Temporary clusters, such as trade fairs, offer similar opportunities for observing what other firms are up to (Bathelt and Gibson Citation2015). Unlike collaboration, monitoring does not require trust between the firms for learning to happen (Malmberg and Maskell Citation2002). However, firms need routines and a way of managing the information from these monitoring activities for it to be useful (Morrison Citation2008).
Monitoring in clusters is typically linked to Porter’s (Citation1990) ideas of rivalry between competitors driving innovation. Competing firms may be more reluctant to collaborate and therefore more likely to monitor each other to acquire new knowledge. Somewhat paradoxically, cluster policy frequently ignores this aspect of Porter’s argument and aims mainly at stimulating collaboration between competing firms. However, competing firms do not need to interact directly in order to affect each other (Malmberg and Maskell Citation2002). Vertically in the supply-chain, firms need to interact through market relations. In this context, it is more apparent that collaboration can be in their mutual interest, leading to thicker relationships between suppliers and customers. However, monitoring (actual or potential) suppliers and customers can also be useful. Through monitoring, firms can get information on what suppliers of technology and materials can offer. Monitoring their customers, they can prepare solutions to customers’ problems.
Through the process of monitoring, the firm will gain information to help identify with which firms it might be useful to collaborate. Some firms may be in possession of valuable resources or knowledge, which can only be accessed through collaboration. If the firm is only in need of knowledge about market trends, facts or a specific technology, monitoring or market procurement might be sufficient. However, more complex problems with unknown solutions may require closer collaboration. Monitoring can provide information about which partners can help to solve these problems. Of course, monitoring will not always lead to collaboration. Firms may obtain the information that they need through monitoring and thus have less of a need to collaborate. In some cases, for instance between rival firms, collaboration may not be an option and monitoring may be the only way to obtain information about the other firm’s activities. However, in cases where collaboration is a viable strategy and where information is too complex or too well hidden for monitoring to be sufficient for the firm to access it, monitoring may provide a first step to identify partners with whom it would be useful to collaborate.
Hence, we hypothesise that:
H1: Firms which monitor each other will be more likely to collaborate.
2.3. Labour mobility and collaboration
Labour mobility is often regarded as one of the key mechanisms for knowledge diffusion within (and between) regions and clusters. New employees bring their tacit knowledge from the sending to the receiving firm (Casper Citation2007; Kaiser, Kongsted, and Rønde Citation2015; Timmermans and Boschma Citation2014). They have acquired skills and experiences that may be complementary to those of the firm’s current staff, thus enhancing the firm’s skill portfolio (Boschma, Eriksson, and Lindgren Citation2009). This may broaden the firm’s search for new technologies and give insights to new market opportunities (Angel Citation1991). Firms with a higher replacement rate also have a higher propensity to collaborate with other firms (Herstad and Ebersberger Citation2014, 224). While labour mobility is more common within the same region and industry, inter-regional and inter-industry mobility may bring more crucial knowledge inputs (Eriksson and Rodríguez-Pose Citation2017; Simonen and McCann Citation2008). Beyond carrying their experiences from past employers with them to future ones, mobile employees also maintain social relationships from previous jobs (Agrawal, Cockburn, and McHale Citation2006). Employees who move between firms can use these personal ties to create new organisational ties. If employees keep in touch with former colleagues, it can make it easier for the firm to establish collaboration with these firms.
Cantner and Graf (Citation2006) find that the present network structures in R&D cooperation are better explained by job mobility of scientists than by past cooperation. One reason for this is that having worked together in the past creates trust between the actors. It also allows employees to spot potential complementarities in skills and resources between the organisations:
“People familiar with activities in two groups are more able than people confined within either group to see how a belief or practice in one group could create value in the other and to know how to translate the belief or practice into language digestible in the target group” (Burt Citation2004, 355)
However, on the firm level, labour poaching might also harm trust and could potentially make collaboration more difficult. The sending firm might not want to collaborate with a firm that recruits their most valuable employees. Ex-employees who are versed in the firm’s way of doing business may be seen as a threat, causing them to avoid collaboration to protect themselves from being exploited. When one of the firms in the potential relationship knows more about the other firm than vice versa, it can make for an unbalanced collaboration.
Previous studies have compared the benefits of knowledge exchange through collaboration and labour mobility for innovation (e.g. Kesidou and Romijn Citation2008; Simonen and McCann Citation2008). However, few have looked at whether labour mobility is associated with more or less collaboration between the same firms. An exception is Fleming and Frenken (Citation2007), who find that greater levels of labour mobility in Silicon Valley than in Boston are associated with more inter-organisational collaboration in Silicon Valley, leading to a more integrated inventor network. Similarly, Cantner and Graf (Citation2006) find that labour mobility of scientists can explain the cooperation network of inventors in Jena. On this basis, we hypothesise that:
H2: Firms which recruit labour from each other will be more likely to collaborate.
3. Research design and method
3.1. The subsea industry in RogalandFootnote1
In order to explore the interplay between the three channels of knowledge exchange, we conduct a case study of the subsea industry in Rogaland, Norway. The Rogaland subsea industry cluster is highly innovative and is built on intensive supplier-customer collaboration, creating a lot of interactions among the firms. It is an important supplier of goods and services to the Norwegian and international oil and gas industry, which has contributed to making it easier, safer and more profitable to extract oil and gas from deep seas.
Rogaland’s largest city Stavanger is the main hub of the Norwegian oil industry. The Petroleum Directorate and the state-owned oil company Equinor (previously Statoil) have their headquarters in the region, as do most other multinational oil companies operating on the Norwegian Continental Shelf. This includes a large and increasingly internationally oriented supplier industry providing products and services to the petroleum industry, employing 15 % of the labour force in the Stavanger region in 2013 (Rystad Energy Citation2013). The subsea sector is one such supplier industry, focusing specifically on the supply and maintenance of subsea equipment or services.
Subsea firms supply equipment and/or related services to be used between seabed and surface during offshore oil production. The industry has an internal value chain, including subcontractors, suppliers and customers. These firms collaborate and compete in developing products or services for oil extraction companies. Norway has a strong position in the global subsea industry and produces world-leading technology. The subsea firms in Rogaland operate in a wide range of activities within the industry. Some are local workshops producing smaller parts, such as screws and pipes. Others are high-technology companies providing advanced technological solutions and employing only highly skilled personnel. In addition, there are companies that tailor products and services to customer needs, instal subsea equipment, or provide vessels with remotely operated vehicles and other subsea equipment (Blomgren et al. Citation2015). If we consider the entire oil and gas value chain, several of the firms in the subsea industry are at the same horizontal level. However, they often specialise in a specific product or service which complements products or services offered by their competitors. This creates a need for collaboration in supplying final products to the oil extraction companies. When procuring, the latter furthermore often require that their suppliers include specific components or inputs from other companies as part of their solution. For different tenders, the firms can therefore take different positions in the value chain – at different times competing with, supplying to, or buying from any of the other firms in the cluster. The industry includes a combination of MNEs, local start-ups and established local companies that have moved into the subsea market by adapting their products and services (Reve and Sasson Citation2012).
We identify companies active in the Rogaland subsea industry from the Norce population database for the petroleum sector (Blomgren et al. Citation2015).Footnote2 As of January 2015, when data collection started, there were 54 subsea firms registered in Rogaland. This included head offices as well as subsidiaries. Excluding duplicates and limiting the sample to firms with more than four employees, we identified 31 distinct entities with active operations in Rogaland. We conducted face-to-face interviews with 30 of these firms, while one firm could not be reached. The response rate is therefore 96.8%. The firms were interviewed between January and March 2015.
All firms interviewed are located in Rogaland. Twenty-one of the firms are located in the region’s urban core around Stavanger, while 6 firms are located in Haugesund (1.5 hours north of Stavanger) and 3 firms located in smaller towns 0.5–1 hour south of Stavanger. provides further information about the firms, including their age, size, headquarter location, the share of employees with higher education, and innovation output. On average, the firms located in the Stavanger area have a higher share of university-educated employees. The industry is highly innovative. Overall, 25 out of 30 firms report product innovations within the last three years and 19 of these report new-to-market innovations.
Table 1. Descriptive data on the sample (Hjertvikrem and Fitjar Citation2018)
3.2. Method
We conducted face-to-face interviews with managers (either CEO or R&D manager) in each firm at their offices, using a structured questionnaire. Each interview lasted around 45 minutes. A large part of the interview was devoted to tracking the knowledge exchange activities of the firm. Respondents reported with which other firms they collaborated, which firms they monitored for inspiration, and from whom they recruited skilled labour. On the basis of these responses, we create knowledge exchange networks for each channel, using social network analysis. Below, we first present network graphs and describe the characteristics of the different networks using social network analysis tools. Subsequently, we use quadratic assignment procedure (QAP) regression to examine the relationship between the collaboration, monitoring and recruitment networks.
3.3. Social network analysis
Social Network Analysis (SNA) has emerged as a set of methods for analysing the relationships between social entities, as well as the patterns and consequences of these relationships (Marin and Wellman Citation2011; Prell Citation2012). It is therefore a suitable method when conceptualising interactions and knowledge flows between companies within a region (Ter Wal and Boschma Citation2009). To map the networks, we used the roster recall method. We presented each respondent with a list of all other firms in the population, as well as relevant firms and organisations (e.g. subsea firms in other regions, oil extraction companies, oil suppliers outside subsea, universities) outside the core population. In addition, respondents were asked to add any other relevant firms or organisations beyond the list. This is a preferred method for populations with less than 100 actors (Giuliani and Pietrobelli Citation2016) to ensure that the complete network will be identified (Prell Citation2012). While firms could (and did) report knowledge exchange partners within or outside the Rogaland subsea industry, we focus on linkages within the industry in this analysis. Within this group, we have interviewed all nodes in the network and have full knowledge of all linkages between the firms. For an analysis of collaborative linkages with firms outside the cluster, see Hjertvikrem and Fitjar (Citation2018).
We adopt a broad definition of ‘collaboration’, including exchanges based on transactional relations leading to diffusion, transfer or co-evolution of knowledge. The collaboration network is symmetrised because collaboration is a mutual knowledge exchange activity. Hence, if A collaborates with B, then B must also collaborate with A. Using the roster recall method ensures ‘that respondents are less subject to recall error’ (Borgatti, Everett, and Johnson Citation2013, 47). In the vast majority of cases, both firms reported collaboration: Only 6 collaboration linkages were indicated by only one of the firms involved. In these cases, we coded collaboration as present. The results do not differ substantially if the analyses are conducted on non-symmetrised networks.
For monitoring, we asked which actors the firm monitors to find inspiration for innovation activities. For recruitment, we asked from where the firm recruits skilled labour to increase its innovation ability and competiveness. We focus on skilled labour rather than general recruitment as skilled workers offer more potential for knowledge exchange and will likely also have more influence on strategic decisions such as the establishment of new collaborative linkages. The recruitment network and the monitoring network are directed. Hence, if A monitors or recruits from B, this does not imply that B monitors or recruits from A.
3.4. Quadratic assignment procedure regression
Network data violates the assumption of ordinary least squares regression that the observations are independent, as the interdependence of observations is at the heart of social network analysis. Using ordinary regression methods in such a context will underestimate standard errors and therefore exaggerate p-values. Quadratic assignment procedure (QAP) compensates for this by using permutations to estimate the standard errors and p-values (see Broekel et al. Citation2014). We examine collaboration linkages between the firms as a function of monitoring and recruitment linkages between the same firms.Footnote3
The regression model takes the following form:
This model is a logistic Quadratic Assignment Procedure (QAP) model, where the dependent variable is collaboration. The unit of analysis is the linkage between two firms i and j, which is coded as 1 if the two firms collaborate and 0 otherwise. The independent variables of interest are monitoring and recruitment, which is 1 if either of the firms have recruited from (monitored) the other firm, and 0 otherwise. Since the dependent variable is symmetric, we have also symmetrised the monitoring and recruitment variables for this analysis. Hence, we analyse collaboration between i and j as a function of either of the firms monitoring or recruiting from the other firm. This approach is agnostic to which of the firms has initiated the collaboration, and examines simply if collaboration is more or less likely if at least one of the firms already monitors or recruits from the other.
We control for characteristics which could affect the firms’ positions in all three networks: Their size, R&D expenditures, and share of university-educated employees. As the units in QAP regression are linkages, the control variables are computed at the level of the linkage. For these variables, we use the sum for the two nodes making up the linkage. Larger and more technologically sophisticated firms are likely to occupy more central positions in all knowledge exchange networks, regardless of the mode of knowledge exchange. Larger firms will have the capacity to collaborate with a greater number of other firms and will also attract more attention as a source of inspiration and skilled labour. Firms with larger knowledge resources, as measured by their R&D expenditure and human capital stock, will also be more attractive as knowledge exchange partners, regardless of the channel of knowledge exchange.
In addition, we control for linkage characteristics that could affect the likelihood of collaboration: Geographical, cognitive, and cultural distance. Geographical distance is the travel distance in kilometres between the two firms. Cognitive distance is a dummy with a value of 1 if the two firms are in different industries at the NACE 5-digit level, and 0 otherwise. We address two different dimensions of cultural distance: First, the variable MNE is a dummy with a value of 1 if both firms are multinationals or if neither is a multinational, and 0 if the firms have different ownership characteristics. This measures whether collaborations tend to occur between similar or different types of organisations. Second, the variable engineers measures the difference between the two firms in the share of engineers in the total workforce. This captures the two main different types of firms in the cluster: engineering firms and workshops, which can have different organisational cultures.
4. Results: social network analysis
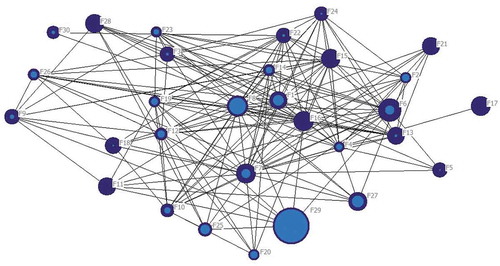
shows the network graph for collaboration linkages between the 30 firms in the Rogaland subsea industry. The firms share a total of 214 collaborative linkages. This implies that each firm on average collaborates with more than 7 other firms. The density of the network is 0.25, which means that a quarter of the possible ties in the network are present. This is a very high level of density for a network of this size, indicating that the network is well-integrated and the firms in the subsea industry collaborate widely. Indeed, the graph shows that all firms are integrated in the network and most are connected to several other firms.
Figure 1. Collaboration network. Nodes represent firms and edges represent collaboration. Node size indicates number of employees. Darker blue indicates share of employees with higher education
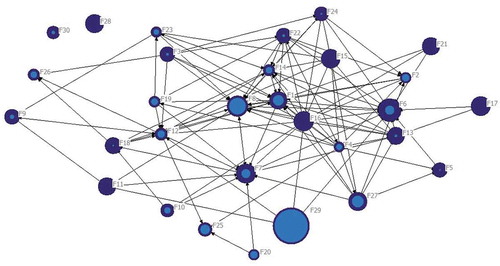
shows the network graph for monitoring linkages. There are in total 123 linkages within the network. On average, each firm monitors 4.1 other firms. This means that 14 % (density = 0.14) of the possible linkages in the network are present. Hence, firms tend to monitor each other to a lesser extent than they collaborate. In this case, there are some isolates in the network. These do not monitor any other firms, and no firms monitor them. Furthermore, some firms clearly attract more attention as sources of inspiration.
Figure 2. Monitoring network. Nodes represent firms and edges represent collaboration. Node size indicates number of employees. Dark blue indicates share of employees with higher education. The edges are directed, with arrows towards the firm being monitored
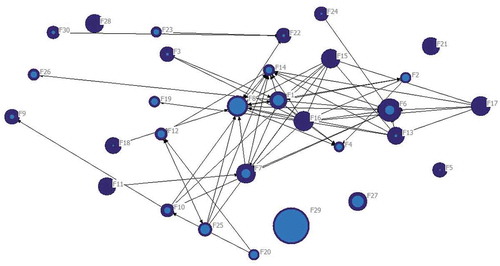
shows the network graph for recruitment linkages. The network has a total of 64 links within the network, making it the least dense of the three networks. On average, each firm considers 2.1 other firms in the subsea cluster as important sources for recruiting skilled labour. The density of the network is 0.07, which means that 7 % of possible ties in the network are present. In this case, there are several isolates and the network is less well integrated.
Figure 3. Recruitment network. Nodes represent firms and edges represent collaboration. Node size indicates number of employees. Dark blue indicates share of employees with higher education. The edges are directed, with arrows towards the firm considered important sources for recruitment of skilled labour
5. Results: are monitoring and recruitment associated with more collaboration?
shows the correlations between companies’ in-degree scores in the various networks to examine whether the same firms tend to be central in each network. There are high correlations between all three networks when it comes to in-degree centrality, indicating that the same firms tend to have many linkages regardless of knowledge exchange mechanism. There is a correlation of 0.71 between the firms being most central in the collaboration and monitoring networks, a correlation of 0.73 between the monitoring and recruitment networks, and a correlation of 0.62 between the collaboration and recruitment networks.
Table 2. Correlation between in-degree centrality measures
Moving from the level of individual firms to the dyad level, shows the QAP correlations between the linkages in the networks.Footnote4 The correlation between the collaboration and monitoring networks is 0.5 and positive. The recruitment network has a correlation of 0.25 with each of the other networks. The correlations are not as strong at the dyad as at the firm level, but there is still a clear pattern indicating that linkages between firms in one network are associated with the presence of linkages also in the other knowledge networks. This is particularly the case between the monitoring and collaboration networks.
Table 3. QAP correlation between linkages in the knowledge networks
These correlations between the different networks suggest that the networks are related to each other. This pattern might reflect knowledge exchange in one channel facilitating exchange also using the other channels. However, it might also result from larger and more technologically sophisticated firms simply being more attractive knowledge exchange partners regardless of the transmission channel, or from firms seeking proximate partners regardless of the channel. In the QAP regression, we take this into account by controlling for firm size and technological level.
shows the results of the QAP regression. Model 1 shows the results for regressing collaboration on monitoring and recruitment only. Model 2 adds the control variables. Both the independent variables of interest, monitoring and recruitment, are positive and highly significant, with monitoring having the strongest effects. The coefficients do not change much when control variables are introduced. When at least one firm monitors the other, the odds of collaboration between the two firms increase six times (e1.853 = 6.4). When at least one firm views the other as important for recruiting skilled labour, the odds of collaboration are doubled (e0.765 = 2.1).
Table 4. Results from the QAP regression analysis
Among the control variables, larger firms tend to collaborate more. However, technological sophistication does not seem to attract collaboration, as R&D expenditure has no significant effect on collaboration. Meanwhile, the share of workers with tertiary education has a significant negative effect on the likelihood of collaboration. Geographical distance between the firms significantly reduces the likelihood of collaboration. On the other hand, cognitive distance, measured as being in different industries, has a significant positive effect on collaboration. At face value, this could be considered surprising. However, the firms are all operating in the same cluster, with low cognitive distances between them. Firms in different industries are less likely to be direct competitors, making collaboration a more viable strategy. Finally, none of the variables capturing cultural distance significantly affects the likelihood of collaboration. Again, this may be an effect of all firms operating in the same fairly homogeneous region and industry, meaning that the cultural distances are in any case rather small.
6. Discussion and conclusion
This paper has examined knowledge exchange in the Rogaland subsea industry through collaboration, monitoring and recruitment. The industry is highly innovative and has a dense network of knowledge exchange through various mechanisms. In particular, the collaboration network is very dense, with each firm collaborating with more than 7 of the 30 firms which make up the industry. However, the firms also monitor several other subsea firms for inspiration and tend to consider various other firms in the industry as important sources of skilled labour.
The question of interest is whether collaboration between two firms is associated with monitoring and recruitment between the same firms. The pairwise correlation between each of the networks is positive. The regression analysis controlling for firm size and other characteristics confirms that this is not simply because large or R&D intensive firms are central in all the networks. It is also not explained by the geographical, cognitive or cultural proximity between the firms. Although geographical and cognitive proximity have an impact on the likelihood of collaboration, they do not reduce the impact of knowledge exchange in other dimensions. Beyond the observable characteristics of the firms, collaboration tends to happen more frequently between firms which also monitor or recruit from each other.
No previous studies have examined the relationship between knowledge exchange using collaboration, monitoring and labour mobility with social network analysis methods. The few studies that have considered these jointly have tended to analyse them as alternative channels for knowledge spillovers in clusters, and have accordingly compared their prevalence or their relative effects on innovation outcomes (Kesidou and Romijn Citation2008; Malmberg and Maskell Citation2002; Malmberg and Power Citation2005; Martin and Moodysson Citation2013; Martin and Rypestøl Citation2018; Trippl, Tödtling, and Lengauer Citation2009). However, this analysis shows that the different mechanisms for knowledge exchange need not be considered as alternatives. Rather, firms that monitor and/or recruit from each other also tend to engage in more active and reciprocal collaboration. This could be taken as an indication that different types of knowledge are exchanged using the different linkages, hence knowledge exchange through one channel does not render the others obsolete.
It also reflects that collaboration linkages are embedded in social and other relationships between firms. Through monitoring, firms become aware of the strengths and potentials of other firms. They may also develop connections with individuals within those firms, which they can later mobilise to establish deeper collaboration linkages. Furthermore, mobility of skilled labour across firms within the cluster creates a network of former colleagues across different organisations, who can spot complementarities across the firms and use their connections to develop collaboration agreements (Fleming and Frenken Citation2007).
It remains an open question whether this overlap of knowledge exchange mechanisms has a positive or negative effect on innovation and productivity in the cluster. The density of the network allows for knowledge to flow quickly across the different firms in the industry. However, the close network could also increase the risk of lock-in in this industry. Even more so, when taking into account that the same relations are repeated across all the different channels. The analysis presented in this paper contributes to the identification of these repeated linkages across the different knowledge exchange networks, which previous studies of clusters have rarely done.
This implies that policy-makers looking to promote collaboration between firms in clusters also need to take into account other relationships between the firms. Geographical and technological proximity are in themselves not sufficient for collaboration to emerge, as other studies have highlighted (e.g. Boschma Citation2005). Collaborative linkages are embedded in other relationships between the firms. More effort would thus be required to foster collaboration between firms with no prior linkages. Conversely, firms that already monitor and recruit from each other may be in a position to start collaborating whenever they want, with little or no policy stimulus required. In clusters where firms frequently exchange knowledge using all the various mechanisms, such as this one, firms might need more help in looking for new partners outside the cluster in order to escape lock-in. Cluster policies which promote collaboration within the cluster might simply add a further knowledge exchange mechanism between firms that already exchange knowledge through various other channels.
Acknowledgements
The research for this project was supported by the Research Council of Norway (grant no. 233788) and by a University of Stavanger Toppforsk grant. The questionnaire was developed by the project team, led by Roman Martin with input from the rest of the project team and the project leader Bjørn Asheim. Elisabeth Nyland provided valuable research assistance in the data collection phase. Norce and Atle Blomgren provided access to the petroleum population database and research support. Giuseppe Calignano and Gennady Zavyalov gave helpful advice on the analysis of data.
Disclosure statement
No potential conflict of interest was reported by the authors.
Correction Statement
This article has been republished with minor changes. These changes do not impact the academic content of the article.
Notes
1 For more descriptive analysis of this case, see Hjertvikrem and Fitjar (Citation2018).
2 The Norce petroleum population database lists all corporations operating in an oil and gas-related industry and provides details on the specific industry in which they are active. The subsea industry is one of these industries.
3 We use regression analysis in order to control for other characteristics of the firms and isolate the correlations between the knowledge exchange channels. The use of collaboration as the dependent and monitoring and recruitment as the independent variables in these analyses do not imply that we expect a particular direction of causality in these relationships. Knowledge exchanges through different channels are by nature simultaneous processes where causation is likely to go both ways. Hence, we use this analysis simply to determine correlation between the networks and to reduce the risk of spurious correlations.
4 The number of possible links in a symmetric network of 30 nodes is 30 * 30–30 = 870.
References
- Agrawal, A., I. Cockburn, and J. McHale. 2006. “Gone but Not Forgotten: Knowledge Flows, Labor Mobility, and Enduring Social Relationships.” Journal of Economic Geography 6 (5): 571–591. doi:10.1093/jeg/lbl016.
- Ahuja, G. 2000a. “Collaboration Networks, Structural Holes, and Innovation: A Longitudinal Study.” Administrative Science Quarterly 45 (3): 425–455. doi:10.2307/2667105.
- Ahuja, G. 2000b. “The Duality of Collaboration: Inducements and Opportunities in the Formation of Interfirm Linkages.” Strategic Management Journal 21 (3): 317–343. doi:10.1002/(SICI)1097-0266(200003)21:3<317::AID-SMJ90>3.0.CO;2-B.
- Almeida, P., and B. Kogut. 1999. “Localization of Knowledge and the Mobility of Engineers in Regional Networks.” Management Science 45 (7): 905–917. doi:10.1287/mnsc.45.7.905.
- Angel, D. P. 1991. “High-Technology Agglomeration and the Labor Market: The Case of Silicon Valley.” Environment & Planning A 23 (10): 1501–1516. doi:10.1068/a231501.
- Autant-Bernard, C., P. Billand, D. Frachisse, and N. Massard. 2007. “Social Distance versus Spatial Distance in R&D Cooperation: Empirical Evidence from European Collaboration Choices in Micro and Nanotechnologies.” Papers in Regional Science 86 (3): 495–519. doi:10.1111/j.1435-5957.2007.00132.x.
- Balland, P.-A. 2012. “Proximity and the Evolution of Collaboration Networks: Evidence from Research and Development Projects within the Global Navigation Satellite System (GNSS) Industry.” Regional Studies 46 (6): 741–756. doi:10.1080/00343404.2010.529121.
- Balland, P.-A., R. Boschma, and K. Frenken. 2015. “Proximity and Innovation: From Statics to Dynamics.” Regional Studies 49 (6): 907–920. doi:10.1080/00343404.2014.883598.
- Bathelt, H., and P. Turi. 2011. “Local, Global and Virtual Buzz: The Importance of Face-to-face Contact in Economic Interaction and Possibilities to Go Beyond.” Geoforum 42 (5): 520–529. doi:10.1016/j.geoforum.2011.04.007.
- Bathelt, H., and R. Gibson. 2015. “Learning in ‘Organized Anarchies’: The Nature of Technological Search Processes at Trade Fairs.” Regional Studies 49 (6): 985–1002. doi:10.1080/00343404.2013.783691.
- Blomgren, A., C. Quale, R. Austnes-Underhaug, A. M. Harstad, S. Fjose, K. Wifstad, … S. E. Hagen. 2015. Industribyggerne 2015. Stavanger: International Research Institute of Stavanger.
- Borgatti, S. P., M. G. Everett, and J. C. Johnson. 2013. Analyzing Social Networks. Los Angeles: SAGE Publications .
- Boschma, R. 2005. “Proximity and Innovation: A Critical Assessment.” Regional Studies 39 (1): 61–74. doi:10.1080/0034340052000320887.
- Boschma, R. 2015. “Towards an Evolutionary Perspective on Regional Resilience.” Regional Studies 49 (5): 733–751. doi:10.1080/00343404.2014.959481.
- Boschma, R., and A. L. J. Ter Wal. 2007. “Knowledge Networks and Innovative Performance in an Industrial District: The Case of a Footwear District in the South of Italy.” Industry and Innovation 14 (2): 177–199. doi:10.1080/13662710701253441.
- Boschma, R., R. Eriksson, and U. Lindgren. 2009. “How Does Labour Mobility Affect the Performance of Plants? The Importance of Relatedness and Geographical Proximity.” Journal of Economic Geography. doi:10.1093/jeg/lbn041.
- Broekel, T., and M. Hartog. 2013. “Explaining the Structure of Inter-Organizational Networks Using Exponential Random Graph Models.” Industry and Innovation 20 (3): 277–295. doi:10.1080/13662716.2013.791126.
- Broekel, T., P.-A. Balland, M. Burger, and F. van Oort. 2014. “Modeling Knowledge Networks in Economic Geography: A Discussion of Four Methods.” Annals of Regional Science 53 (2): 423–452. doi:10.1007/s00168-014-0616-2.
- Burt, R. S. 2004. “Structural Holes and Good Ideas.” American Journal of Sociology 110 (2): 349–399. doi:10.1086/421787.
- Calignano, G., R. D. Fitjar, and D. F. Kogler. 2018. “The Core in the Periphery? The Cluster Organization as the Central Node in the Apulian Aerospace District.” Regional Studies 52 (11): 1490–1501. doi:10.1080/00343404.2017.1420155.
- Cantner, U., and H. Graf. 2006. “The Network of Innovators in Jena: An Application of Social Network Analysis.” Research Policy 35 (4): 463–480. doi:10.1016/j.respol.2006.01.002.
- Casper, S. 2007. “How Do Technology Clusters Emerge and Become Sustainable? Social Network Formation and Inter-firm Mobility within the San Diego Biotechnology Cluster.” Research Policy 36 (4): 438–455. doi:10.1016/j.respol.2007.02.018.
- Chesbrough, H. 2003. Open Innovation: The New Imperative for Creating and Profiting from Technology. Boston: Harvard Business Press.
- Eriksson, R., and A. Rodríguez-Pose. 2017. “Job-related Mobility and Plant Performance in Sweden.” Geoforum 83 (May): 39–49. doi:10.1016/j.geoforum.2017.04.019.
- Fitjar, R. D., and A. Rodríguez-Pose. 2017. “Nothing Is in the Air.” Growth and Change 48 (1): 22–39. doi:10.1111/grow.12161.
- Fitjar, R. D., and M. Gjelsvik. 2018. “Why Do Firms Collaborate with Local Universities?” Regional Studies 52 (11): 1525–1536. doi:10.1080/00343404.2017.1413237.
- Fleming, L., and K. Frenken. 2007. “The Evolution of Inventor Networks in the Silicon Valley and Boston Regions.” Advances in Complex Systems 10 (1): 53–71. doi:10.1142/S0219525907000921.
- Giuliani, E. 2007. “Towards an Understanding of Knowledge Spillovers in Industrial Clusters.” Applied Economics Letters 14 (2): 87–90. doi:10.1080/13504850500425907.
- Giuliani, E. 2011. “Role of Technological Gatekeepers in the Growth of Industrial Clusters: Evidence from Chile.” Regional Studies 45 (10): 1329–1348. doi:10.1080/00343404.2011.619973.
- Giuliani, E., and C. Pietrobelli. 2016. “Social Network Analysis for Evaluating Cluster Development Programs.” In The Impact Evaluation of Cluster Development Programs: Methods and Practices, edited by A. Maffioli, C. Pietrobelli, and R. Stucchi, 37–58. Washington DC: Inter-America Development Bank.
- Giuliani, E., and M. Bell. 2005. “The Micro-determinants of Meso-level Learning and Innovation: Evidence from a Chilean Wine Cluster.” Research Policy 34 (1): 47–68. doi:10.1016/j.respol.2004.10.008.
- Herstad, S. J., and B. Ebersberger. 2014. “Urban Agglomerations, Knowledge-intensive Services and Innovation: Establishing the Core Connections.” Entrepreneurship and Regional Development 26 (3–4): 211–233. doi:10.1080/08985626.2014.888098.
- Hjertvikrem, N., and R. D. Fitjar. 2018. “Knowledge Networks and Innovation among Subsea Firms.” In Petroleum Industry Transformations: Lessons from Norway and Beyond, edited by T. M. Thune, O. A. Engen, and O. Wicken, 58–69. New York: Routledge.
- Kaiser, U., H. C. Kongsted, and T. Rønde. 2015. “Does the Mobility of R&D Labor Increase Innovation?” Journal of Economic Behavior & Organization 110: 91–105. doi:10.1016/j.jebo.2014.12.012.
- Katz, J. S. 1994. “Geographical Proximity and Scientific Collaboration.” Scientometrics 31 (1): 31–43. doi:10.1007/BF02018100.
- Kesidou, E., and H. Romijn. 2008. “Do Local Knowledge Spillovers Matter for Development? An Empirical Study of Uruguay’s Software Cluster.” World Development 36 (10): 2004–2028. doi:10.1016/j.worlddev.2008.01.003.
- Knoben, J., and L. A. G. Oerlemans. 2006. “Proximity and Inter-organizational Collaboration: A Literature Review.” International Journal of Management Reviews 8 (2): 71–89. doi:10.1111/j.1468-2370.2006.00121.x.
- Laursen, K., and A. Salter. 2006. “Open for Innovation: The Role of Openness in Explaining Innovation Performance among U.K. Manufacturing Firms.” Strategic Management Journal 27 (2): 131–150. doi:10.1002/smj.507.
- Leskovec, J., J. Kleinberg, and C. Faloutsos. 2007. “Graph Evolution: Densification and Shrinking Diameters.” ACM Transactions on Knowledge Discovery from Data 1 (1): 2. doi:10.1145/1217299.1217301.
- Malmberg, A., and D. Power. 2005. “(How) Do (Firms In) Clusters Create Knowledge?” Industry and Innovation 12 (4): 409–431. doi:10.1080/13662710500381583.
- Malmberg, A., and P. Maskell. 2002. “The Elusive Concept of Localization Economies: Towards a Knowledge-based Theory of Spatial Clustering.” Environment & Planning A 34 (3): 429–449. doi:10.1068/a3457.
- Marin, A., and B. Wellman. 2011. “Social Network Analysis: An Introduction.” In The SAGE Handbook of Social Network Analysis, edited by J. Scott and P. J. Carrington, 11–25. London: SAGE Publications .
- Martin, R., and J. Moodysson. 2013. “Comparing Knowledge Bases: On the Organisation and Geography of Knowledge Flows in the Regional Innovation System of Scania, Southern Sweden.” European Urban and Regional Studies 20 (2): 170–187. 10.1177/0969776411427326. http://eur.sagepub.com/content/20/2/170.full.pdf+html
- Martin, R., and J. O. Rypestøl. 2018. “Linking Content and Technology: On the Geography of Innovation Networks in the Bergen Media Cluster.” Industry and Innovation 25 (10): 966–989. doi:10.1080/13662716.2017.1343132.
- Martin, R., and P. Sunley. 2006. “Path Dependence and Regional Economic Evolution.” Journal of Economic Geography 6 (4): 395–437. doi:10.1093/jeg/lbl012.
- McPherson, M., L. Smith-Lovin, and J. M. Cook. 2001. “Birds of a Feather: Homophily in Social Networks.” Annual Review of Sociology 27 (1): 415–444. doi:10.1146/annurev.soc.27.1.415.
- Morrison, A. 2008. “Gatekeepers of Knowledge within Industrial Districts: Who They Are, How They Interact.” Regional Studies 42 (6): 817–835. doi:10.1080/00343400701654178.
- Morrison, A., and R. Rabellotti. 2009. “Knowledge and Information Networks in an Italian Wine Cluster.” European Planning Studies 17 (7): 983–1006. doi:10.1080/09654310902949265.
- Nooteboom, B. 2000. “Learning by Interaction: Absorptive Capacity, Cognitive Distance and Governance.” Journal of Management and Governance 4 (1–2): 69–92. doi:10.1023/A:1009941416749.
- Porter, M. E. 1990. The Competitive Advantage of Nations. New York: Palgrave Macmillan.
- Power, D., and M. Lundmark. 2004. “Working through Knowledge Pools: Labour Market Dynamics, the Transference of Knowledge and Ideas, and Industrial Clusters.” Urban Studies 41 (5–6): 1025–1044. doi:10.1080/00420980410001675850.
- Prell, C. 2012. Social Network Analysis: History, Theory & Methodology. London: SAGE Publications.
- Reve, T., and A. Sasson. 2012. Et Kunnskapsbasert Norge. Oslo: Universitetsforlaget.
- Rystad Energy. 2013. Aktiviteten I Den Petroleumsrettede Leverandørindustrien I Landets Ulike Regioner. Oslo: Ministry of Petroleum and Energy.
- Sammarra, A., and L. Biggiero. 2008. “Heterogeneity and Specificity of Inter-firm Knowledge Flows in Innovation Networks.” Journal of Management Studies 45 (4): 800–829. doi:10.1002/anie.200904316.
- Schilling, M. A., and C. C. Phelps. 2007. “Interfirm Collaboration Networks: The Impact of Small World Connectivity on Firm Innovation.” Management Science 53 (7): 1113–1126. doi:10.2139/ssrn.564422.
- Simonen, J., and P. McCann. 2008. “Firm Innovation: The Influence of R&D Cooperation and the Geography of Human Capital Inputs.” Journal of Urban Economics 64 (1): 146–154. doi:10.1016/j.jue.2007.10.002.
- Storper, M., and A. J. Venables. 2004. “Buzz: Face-to-face Contact and the Urban Economy.” Journal of Economic Geography 4 (4): 351–370. doi:10.1093/jnlecg/lbh027.
- Ter Wal, A. L. J. 2014. “The Dynamics of the Inventor Network in German Biotechnology: Geographic Proximity versus Triadic Closure.” Journal of Economic Geography 14 (3): 589–620. doi:10.1093/jeg/lbs063.
- Ter Wal, A. L. J., and R. A. Boschma. 2009. “Applying Social Network Analysis in Economic Geography: Framing Some Key Analytic Issues.” Annals of Regional Science 43 (3): 739–756. doi:10.1007/s00168-008-0258-3.
- Timmermans, B., and R. Boschma. 2014. “The Effect of Intra- and Inter-regional Labour Mobility on Plant Performance in Denmark: The Significance of Related Labour Inflows.” Journal of Economic Geography 14 (2): 289–311. doi:10.1093/jeg/lbs059.
- Trippl, M., F. Tödtling, and L. Lengauer. 2009. “Knowledge Sourcing beyond Buzz And.” Economic Geography 84 (4): 443–462. doi:10.1111/j.1944-8287.2009.01047.x.
- Tsai, W. 2001. “Knowledge Transfer in Intraorganizational Networks: Effects of Network Position and Absorptive Capacity on Business Unit Innovation and Performance.” Academy of Management Journal 44 (5): 996–1004. doi:10.2307/3069443.
- Uzzi, B. 1996. “The Sources and Consequences of Embeddedness for the Economic Performance of Organizations : The Network Effect.” American Sociological Review 61 (4): 674–698. doi:10.2307/2096399.
- Vicente, J., P.-A. Balland, and O. Brossard. 2011. “Getting into Networks and Clusters: Evidence from the Midi-Pyrenean Global Navigation Satellite Systems (GNSS) Collaboration Network.” Regional Studies 45 (8): 1059–1078. doi:10.1080/00343401003713340.