
 ?Mathematical formulae have been encoded as MathML and are displayed in this HTML version using MathJax in order to improve their display. Uncheck the box to turn MathJax off. This feature requires Javascript. Click on a formula to zoom.
ABSTRACT
In light of increasing ecological issues, the deployment of environmentally friendly technologies is of major importance. This paper examines how institutions can influence firm behaviour with respect to introducing environmental innovations. Based on institutional and innovation theory, we explore the relationship of institutional factors with two highly relevant and heterogeneous types of environmental innovation, namely: the reduction of material use (Ecomat) and the reduction of carbon dioxide emissions (Ecoco). We utilise the 2008 and 2014 survey waves of the Community Innovation Survey (CIS). This allows us to explore two separate cross-sectional samples at different points of time. Each sample is drawn from twelve European Union countries, giving us a total of about 70,000 firms. We find that formal institutions more strongly influence Ecoco innovation, especially for the CIS 2014 sample. We find that informal institutions affect both innovation types similarly.
1. Introduction and motivation
Economic activity has led to considerable increases in environmental pressures. This relates both to resources, such as material and land use (UNEP Citation2016; Behrens Citation2016), and polluting emissions, such as carbon dioxide (Töbelmann and Wendler Citation2020). Innovations are a key force to mitigate the detrimental effects of production and consumption (Popp, Newell, and Jaffe Citation2010). Innovation and associated technological change can reduce environmental impact either due to general productivity gains and/or changes that reduce specific environmental impacts (Stern Citation2017). Innovation targeted at environmental improvements is key to increase environmental efficiency and maintain sufficient production levels in the face of tightening environmental conditions (Wang et al. Citation2020; Aldieri and Vinci Citation2020). The increasing importance of environmental issues makes it necessary to facilitate specific environmentally beneficial technologies.
The European Union (EU) sets ambitious targets in order to motivate environmental policy in its member states (Deters Citation2019). Resource efficiency is of pivotal interest for European policy (European Commission Citation2008, Citation2010, Citation2011b, Citation2015), not only for environmental reasons, but as a way to improve competitiveness in the marketplace. The reduction of emissions is also a focal point of environmental goals. The EU has targeted 2030 as the year in which the 1990 emission level will be reduced by 40% (European Commission Citation2019).Footnote1 There is consensus that eco-innovation is a fundamental aspect in achieving these goals (European Commission Citation2011a).
With respect to introducing specific innovations, firms develop strategies which are not only dependent on firm characteristics. The socio-political surroundings of a firm play a key role as well. Eco-innovations are seen as context-specific and dependent on various policies and governmental decisions (Kemp and Oltra Citation2011). Wagner and Llerena (Citation2011) underline a need for more research on the interaction of informal factors (such as preferences) and the formal institutional context (such as regulations).
Environmental policy and institutional factors are of crucial importance for environmental innovative activity (EI), due to the limited appreciation of environmental benefits by the market (Rennings Citation2000; Horbach Citation2016). Both regulatory and normative institutional pressures were proven to influence firms’ decisions to be environmentally innovative (Berrone et al. Citation2013; Garrone, Grilli, and Mrkajic Citation2018; Liao Citation2018). Besides similarities, different types of EI may be dependent upon different factors (Demirel and Kesidou Citation2011; Horbach, Rammer, and Rennings Citation2012), for example due to differences in the relationship between environmental and economic benefits originating from the innovation.
Our analysis aims to improve the understanding of institutional effects on environmental innovativeness of firms, by assessing how institutions influence different types of environmental innovation and whether these relationships might change over time. This paper contributes to the scant literature by explicitly analysing the role of institutional factors for EI (Berrone et al. Citation2013; Garrone, Grilli, and Mrkajic Citation2018; Liao Citation2018), drawing upon the broader literature on the determinants of EI (Barbieri et al. Citation2016). We extend this literature by analysing how institutional pressures affect different types of process innovations dependent upon the environmental effect.
Specifically, we focus on two types of EI related to material use and the emission of CO2, which are both of particular interest from the European political perspective. We choose these two types because their defining characteristics are fundamentally different. Materials are inputs into the production function (O’Mahony and Timmer Citation2009), so that reducing material use should not only provide environmental benefits but also save costs, thereby increasing the firm’s competitiveness. Because CO2 emissions are a negative externality, the reduction of these emissions does not directly benefit the firm. Though this applies only to a certain share of the corresponding innovations,Footnote2 in case of e.g. end-of-pipe innovation this fact holds. In fact, compliance may increase costs.Footnote3 Furthermore, these two EI types require different preconditions in terms of information sources. While material use reduction innovation is positively affected by internal information sources, emission reduction innovation is positively affected by public research (Horbach Citation2016). This could correspond to material use innovation being more attuned to specific production processes of a firm and thus requiring internal capabilities, whereas emission reduction innovation might be more easily provided by externals. Hence, we expect that institutional pressures affect these two EI types in vastly different ways.
Another contribution of this paper concerns the data. We take the cross-country dimension and the time dimension into account. The CIS survey waves of 2008 and 2014 solicit information about EI. By using both waves, we are able to analyse how institutional effects may differ between samples.
The paper is structured as follows: Section 2 introduces a theoretical framework, laying the foundation for our investigation of the institutional environment. The data employed, with a particular focus on the institutional measures, will be introduced in Section 3, while Section 4 explains the empirical procedure. Section 5 presents the results which will be discussed in Section 6.
2. Theoretical framework and hypotheses
Institutions are considered to be a central element of an innovation system. However, there is a variety of perceptions as to how they relate to each other (Edquist Citation1997). Nelson (Citation1993) focused on institutional actors: firms, research laboratories and universities. Lundvall (Citation1992) introduced the notion of an ‘institutional set-up’. In this sense, institutions provide agents with guidelines for their actions, thereby making ‘it possible for economic systems to survive and act in an uncertain world’ (Lundvall Citation1992, 10). ‘The rules of the game in a society’ (North Citation1990, 3) is the most widely used definition of institutions. Hodgson (Citation2006) considers institutions as ‘social rules that structure social interactions’ (Hodgson Citation2006, 2). This wide range of definitions for institutions affect the analytic focus of various strands of literature. For example, some schools of thought focus on economic agents, while other schools focus on particular rules or the broader social context (Nelson Citation2005).
There is general agreement that differences in institutional quality can explain differences in economic development between countries (North Citation1990; Acemoglu and Robinson Citation2012). Empirical results frequently confirm this assumption (Acemoglu, Johnson, and Robinson Citation2002; Rodrik, Subramanian, and Trebbi Citation2004; Williamson Citation2009; Kapás Citation2019). Results show, however, that the interaction between formal and informal institutions is of importance as well (Williamson Citation2009; Kapás Citation2019). Formal rules include political and legal constraints (e.g. constitutions), written contracts, codified standards, property rights, or regulations (North Citation1990; Boettke and Coyne Citation2009; Williamson Citation2009). Informal rules are uncodified constraints, which are ‘created, communicated and enforced outside of officially sanctioned channels’ (Helmke and Levitsky Citation2004, 727). They manifest as norms, conventions, social customs, values, attitudes, or traditions (North Citation1990; Boettke and Coyne Citation2009; Williamson Citation2009). A critical distinction between formal and informal institutions is that formal institutions are considered to be ‘fast-moving’, whereas informal institutions are considered to be rather ‘slow-moving’ (Roland Citation2004). According to a typology proposed by Helmke and Levitsky (Citation2004), informal institutions interact with formal institutions in one of four ways: complementary, accommodating, competing, or substituting. When formal institutions are effective, informal institutions might play a complementary or accommodating role. However, if formal institutions are ineffective, informal institutions might substitute or compete with the formal institutional environment. Williamson (Citation2009) defined four institutional categories: strong formal and strong informal institutions, weak formal and strong informal institutions, strong formal and weak informal institutions, and weak formal and weak informal institutions.
González-López (Citation2011) pointed out that the interactions between institutions and innovation activity are manifold. Institutions might either foster innovation or be a barrier to innovation activity. High quality formal institutions appear to have a positive impact on innovation in general (Tebaldi and Elmslie Citation2013; Lee and Law Citation2017) and on innovation-intensive exports more specifically (Silve and Plekhanov Citation2015). Strong informal institutions appear to complement formal institutions in supporting innovation development (Lee and Law Citation2017). Moreover, strong informal institutions are found to be positively related with innovation cooperation (Srholec Citation2015; Geng and Huang Citation2016).
Regulations are core elements of the innovation systems framing the operations of firms in terms of eco-innovation development (Gee and McMeekin Citation2011; Costantini et al. Citation2015; Jacob Citation2018; Lähteenmäki-Uutela et al. Citation2019). Further, environmental regulations may motivate companies to cost reduction and innovation development, and thus increase their competitiveness (Porter and Van Der Linde Citation1995). Rennings and Rammer (Citation2011) find that regulation driven eco-innovation has a positive impact on companies’ sales and cost saving.
Firms are motivated to engage in environmentally innovative activities mostly by demand factors, cost savings, subsidies, and regulations (Horbach Citation2008; Demirel and Kesidou Citation2011; Horbach, Rammer, and Rennings Citation2012; Kesidou and Demirel Citation2012; Horbach, Oltra, and Belin Citation2013; Borghesi, Cainelli, and Mazzanti Citation2015; Díaz-García, González-Moreno, and Sáez-Martínez Citation2015; Horbach Citation2016; Del Río, Romero-Jordán, and Peñasco Citation2017; Hojnik Citation2017; Cai and Li Citation2018; Da Silva Rabêlo and De Azevedo Melo Citation2019). Regulations are found to be most effective in increasing eco-innovations in less innovative firms (Kesidou and Demirel Citation2012), in impacting end-of-pipe pollution control technologies, as well as environmental R&D (Demirel and Kesidou Citation2011). Horbach (Citation2016), analysing regulatory push factors, found that present and future (expected) regulations are positively related to innovations intended to reduce CO2 or other air pollution emissions. Similarly, a positive effect of subsidies was identified. Borghesi, Cainelli, and Mazzanti (Citation2015) found similar relations.
In the case of innovations aimed at reducing material and energy use, regulations were found less significant whereas cost savings were a more important motivation (Horbach Citation2016). Van Den Bergh (Citation2013) suggests that only a combination of environmental regulations (aiming at the reduction of negative externalities) and innovation policy (in order to boost innovation) is able to stimulate eco-innovations that address specific environmental issues. The attitudes of stakeholders are key to successfully implementing requirements set by laws and regulations, emphasising that social factors play a key role in compliance (Machnik-Słomka and Kłosok-Bazan Citation2017; Verschuuren Citation2017). Furthermore, environmental regulations were identified as complementary to informal factors (Wagner and Llerena Citation2011), e.g. market demand or societal change, which were found positively related to eco-innovations (Lin, Tan, and Geng Citation2013; Liao and Tsai Citation2019).
Abovementioned theoretical considerations lead to the following research hypotheses:
Hypothesis 1: A higher level of both formal and informal institutions is positively related to the introduction of EI in the areas of material use and CO2 emissions.
Formal and informal institutions were found positively related to the introduction of EI in previous research (Demirel and Kesidou Citation2011; Kesidou and Demirel Citation2012; Berrone et al. Citation2013; Borghesi, Cainelli, and Mazzanti Citation2015; Horbach Citation2016). Hence, we expect that both types of institutions, constituting the formal and informal framework in which the companies operate, increase the introduction of EI in the areas of material use and CO2 emissions.
Hypothesis 2: Formal institutions have a higher impact on the introduction of EI in the area of CO2 emissions compared to material use.
We expect that innovations aimed at reducing CO2 emissions require formal pressure to a higher extent. This is due to the assumption that CO2 emissions can be considered a negative externality. We postulate that the EU emission trading system did not change this, since its effectiveness during the time of interest for this study is contested (Laing et al. Citation2013; Ellerman, Marcantonini, and Zaklan Citation2016). Material use, on the other hand, qualifies as a cost factor (O’Mahony and Timmer Citation2009). This presumption is supported by empirical findings highlighting that cost savings are more important to motivate innovation aimed at reducing material or energy use (Horbach Citation2016), whereas regulation rather entails innovation aimed at reducing emissions (Demirel and Kesidou Citation2011; Horbach Citation2016). This particular importance of regulation and policy for emission reduction seems to be supported by the fact that EU climate policy was more pronounced in the discussed time period compared to policies aiming at the reduction of material use. While the EU Climate and Energy Package was introduced in 2008 (Capros et al. Citation2011), the EU Circular Economy Action Plan was introduced only by 2015 (Moreau et al. Citation2017).
Hypothesis 3: Interaction of formal and informal institutions have a higher positive impact on EI in the areas of material use and CO2 emissions, compared to just formal institutional conditions.
It is assumed that formal regulations can have a higher positive impact on EI if there are informal preconditions in form of higher environmental awareness, pro-environmental attitudes or societal environmental protection actions, in which formal rules are rooted. To the best of our knowledge, there is no paper analysing the effect of an interacted institutional dimension on EI. Nevertheless, a variety of empirical findings substantiate this assumption. Strong informal institutions have been shown to increase innovation cooperation (Srholec Citation2015; Geng and Huang Citation2016) and facilitate the implementation of EI in firms (Machnik-Słomka and Kłosok-Bazan Citation2017). This should amplify the effect of formal institutions which direct innovation efforts towards specific innovations. Further, formal and informal institutions have been found to be complementary with respect to innovation, with informal institutions exhibiting an even more pronounced effect (Lee and Law Citation2017).
In this study we are using the definition of institutions proposed by North (Citation1990), namely ‘rules of the game’. We focus on regulations (formal institutions), with special attention given to regulations dealing with environmental issues. We also focus on social values (informal institutions) that particularly relate to the importance of environmental quality.
3. Data
We analyse two separate samples of European firms drawn from different member states of the European Union. We collect firm-level information using two survey waves of the Community Innovation Survey (CIS), namely: the CIS 2008 (2006–08) and 2014 (2012–14).Footnote4 Both survey waves asked firms to describe their environmental innovation activities (EI). While the CIS data poses some drawbacks in terms of data availability,Footnote5 the definition of EI is more holistic compared to the use of patent data as firms adopting EI are considered.Footnote6 Given our research focus we consider this an advantage. As some firms did not answer relevant questions, we have available data from both survey waves for twelve countries. For the CIS 2008 wave, these include: Bulgaria, Cyprus, Czech Republic, Germany, Estonia, Hungary, Ireland, Lithuania, Latvia, Portugal, Romania, and Slovakia. For the CIS 2014 wave, Ireland and Cyprus are not available, but Greece and Croatia join the sample. In total, we have ~46,000 firms from the CIS 2008 and ~24,000 firms from the CIS 2014. Thus, our sample covers countries at different stages of development, with a corresponding heterogeneity in institutional environments. Our sample includes both non-innovative and innovative firms, while the latter include both EI firms and firms engaged in other innovative activity.
3.1. Measures
3.1.1. Dependent variables
We construct two dependent dichotomous variables capturing process innovations with regard to specific environmental effects: on the one hand whether a firm introduced an innovation that reduced material use (Ecomat), and on the other hand whether a firm introduced an innovation designed to reduce its CO2 emissions (Ecoco). We focus on these two EI types for several reasons: first, material use is a cost factor, whereas CO2 tends to qualify as a negative externality, and second, material use is an input factor into production, whereas CO2 is an undesired output of production activities, and third, material use captures a general set of inputs, whereas CO2 is a very specific output and a focal point of environmental policies. Focussing on these two distinct aspects of EI allows us to determine the impact of various types of institutional effects.
lists the percentage of firms in each country that introduced an innovation designed to address environmental concerns. We divide the innovations into three categories: Ecomat, Ecoco, and any type of environmental innovation (EnvInno). We also differentiate between the CIS 2008 (08) and the CIS 2014 (14) survey waves.
Table 1. Percentage of firms that introduced different categories of innovation
3.1.2. Explanatory variables
Our main explanatory variables are constructed to capture the difference between formal and informal institutions. To limit reverse causality concerns (see Garrone, Grilli, and Mrkajic Citation2018), all institution-related variables were measured either prior to, or at the latest, at the start of the timeframes under consideration. specifies the various dates of the datasets used to establish these variables.
Table 2. Data used in the construction of the institutional dimensions
To operationalise formal institutions, we use data from the World Economic Forum Global Competitiveness Reports (GCR), and data from the World Bank Worldwide Governance Indicators (WGI). From the GCR, we use the data on stringency of environmental regulations. More stringent environmental regulations should exert direct pressure on firms to improve their environmental performance. We apply the values from the GCR 2003–04Footnote7 to our CIS 2008 data, and the reported values from the GCR 2009–10 to our CIS 2014 data. From the WGI, we use indicators on government effectiveness and regulatory quality. These indicators capture the general quality and enforcement mechanisms of the institutional environment, which is crucial for the impact of regulations on firms’ behaviour. We construct our variables using the reported values from 2003–05 and 2009–11 and apply these values to our CIS 2008 and 2014 data, respectively. All indicators were min-max normalised to range between 0 and 1. To construct a single measure for the formal institutional environment, we ran an exploratory factor analysis based on principal component factoring. The factor analysis revealed that all variables load on the same underlying factor, yielding a standardised variable for formal institutions.
Due to the latent nature of social norms and values, the choice and measurement of an indicator to capture the informal institutional environment is quite demanding. Our intention to determine the degree of pressure exerted on firms by a society’s demand for environmental friendlyness narrows our choices of indicators as well. After considering both the European Social Survey (ESS) and the European Values Study (EVS), we opted to use data from the Database of Political Institutions (DoPI) (Beck et al. Citation2000) in order to meet our measurement goals. Our indicator of informal institutions requires to fulfill two main criteria: first, to provide a meaningful approximation of real valuation of environmental quality in the population, and second, to be comparable across nations since our cross-sectional design analyses only differences between countries. Incomparability across countries would invalidate the analysis (Steenkamp and Baumgartner Citation1998). This measurement invariance across nations might be threatened for the ESS and EVS, due to a varying understanding of value questions across countries (Davidov Citation2010).Footnote8 Further, the concerns on measurement invariance also relate to the significance of values for actual behaviour. The potential gap of stated preferences and willingness-to-pay with actual behaviour is a well-established phenomenon (Schläpfer, Roschewitz, and Hanley Citation2004; Babutsidze and Chai Citation2018). In the case of environmental questions two aspects seem troublesome: the potential social desirability bias on the one hand, and the value-action gap on the other. Voting decisions, in contrast, are less prone to social desirability bias due to anonymity.Footnote9 Further, they directly relate to practical implications due to the political goals and thus correspond to revealed preferences (Schläpfer, Roschewitz, and Hanley Citation2004). Beyond these considerations, using either the ESS or EVS surveys would also have further limited the number of observations.
The DoPI provides annual data displaying the most recent election results. We consider the latest election results as a revealed preference on the relevance of certain political and social goals. To construct two variables, at first we sum up the vote shares of parties that explicitly advocate green politics. Then we sum up the vote shares of parties that lean towards green politics and the vote shares of leftist parties. Left-oriented individuals were found to be characterised by more pro-environmental attitudes and tend to support environmental protection actions and policies (Dunlap Citation1975; Neumayer Citation2004; Davidovic, Harring, and Jagers Citation2019; Santoalha and Boschma Citation2020). Larger shares of such voters in a community relate to the propensity for collective action to be undertaken and thus the exertion of normative pressure on firms (Delmas and Toffel Citation2004; Berrone et al. Citation2013). We use the data for 2006 and 2012 from the DoPIFootnote10 and apply it to the CIS 2008 and 2014 data. Where necessary, we complemented with data from the European Election Database (EED).Footnote11 Again, to construct a single measure we run an exploratory factor analysis. Our analysis reveals that both measures load on the same underlying factor, providing us with one standardised variable for informal institutions.
Interaction variables of both institutional dimensions are constructed by min-max normalising all institutional measures. The values for the formal and informal dimension are obtained by adding up the three formal institutional dimensions and dividing by three, and then adding up the two informal institutional dimensions and dividing by two. Thus, the minimum and maximum possible for both the formal and informal dimension are zero and one. In order to generate the interaction variables, we multiply the formal and informal dimension and then standardise.
To gain first insights on the relationship between our institutional variables and our innovation variables, reports the mean and standard deviation for each institutional variable and our size variable, contingent upon the innovation performance of a firm with respect to our two dependent variables. This exercise reveals some differences between our two innovation variables and our two samples. The statistics for the CIS 08 sample provide a straightforward picture. The introduction of EI is more frequent in the face of higher institutional quality and larger firm size, with innovation for both Ecomat and Ecoco being associated with the highest institutional quality and firm size. Institutional quality and firm size are more strongly associated with Ecoco than with Ecomat. For the CIS 14 sample these patterns are less unequivocal. For formal institutional quality, the concurrence of high institutional quality and innovation is much more pronounced for Ecoco than Ecomat, with high institutional quality being less associated with innovation in both areas than Ecoco innovation alone. For informal institutional quality, the pattern of more frequent EI in the face of higher institutional quality is preserved, though the difference between the two EI types is elevated, with high informal institutional quality being substantially stronger associated with Ecoco. With respect to the combined institutional dimension, the association of high institutional quality with EI is stronger for Ecoco alone than for the occurrence of both innovation types. In essence, the stronger association of high institutional quality with Ecoco is exacerbated in the CIS 14 sample.
Table 3. Descriptives of institutional variables and size contingent upon innovation variables
3.1.3. Control variables
In order to identify the effect of national-level institutions we need to account for the firm-level determinants involved in the introduction of EI (Horbach Citation2016). Most importantly, larger firms are more prone to engage in innovative activities and are more likely to have the needed resources. Therefore, we rely on information provided by the CIS surveys to control for firm size and we are able to generate a continuous variable for firm size (Size).Footnote12 The sectoral affiliation of a firm is also a relevant determinant, as the incentives and necessity to be environmentally innovative are heterogeneous across sectors. Hence, we include industry dummies at the most detailed level provided by the CIS data (Ind. dummies). Knowledge is more likely to flow from one firm to another if the firms belong to a business group. In order to capture knowledge inflows, we control whether the firm is part of a business group (Group). Lastly, as we are measuring the impact of institutions at a national level, it is relevant whether the firm may be influenced by institutional pressures occurring in foreign markets penetrated by this firm. Therefore, we control whether the firm is internationally active (International). A full overview of variables employed in our analysis is provided in . We used the EnvInno variable only for descriptive statistics, but not for the further analysis.
Table 4. Description of the variables used in the analysis
in the Appendix provides a full list of descriptive statistics for all variables used in our main analysis. in the Appendix provides a full list of pairwise correlation coefficients for all these variables.
4. Model specification
Given the binary nature of our dependent variables, we apply non-linear probit models using maximum likelihood estimation. For an EI type a firm either introduces an innovation (Y = 1) or does not (Y = 0). We estimate the probability
with the vector x summarising the explanatory variables, and the vector ß capturing the coefficients. The vector x includes the institutional variables, dummies for the firm belonging to a group and whether a firm is internationally active, dummies for each sector a firm may belong to, and the size variable (see ). The ß parameters reflect the effect that changes in x have on the probability of innovation (Greene Citation2012). We calculate marginal effects at the means (MEM), displaying the change in the probability for a change from the minimum to the maximum value of an explanatory variable. This is standard for dummy variables, yet we apply it to the calculation of MEM of continuous variables as well. Since the outcomes of both EI types may be correlated and thus leading to inconsistent estimates of the univariate probit model (Greene Citation2012), we also ran the models using bivariate probit analysis that will be discussed as robustness checks (following Horbach Citation2016).
While the utilisation of such an approach is in line with similar recent work (Garrone, Grilli, and Mrkajic Citation2018), our interest in the effect of country-level determinants on firm behaviour causes some uncertainty for analysis. There is a natural hierarchy with observations as the individual level (firm level) is nested within a higher level (countries) (Bryan and Jenkins Citation2016). At the individual level, our dataset contains thousands of observations, while there are only twelve countries for each survey wave. This leads to uncertainty concerning the estimation of country effects (Bryan and Jenkins Citation2016), which are our primary focus of interest. Hence, we complement our probit analysis described above in the robustness section by applying a two-step approach, as suggested by Bryan and Jenkins (Citation2013). In the first step, we run the regular probit analysis including country dummies instead of the institutional variables. In a second step, we regress the country fixed effect on the institutional variables using OLS.
5. Empirical results
5.1. Main results
presents the estimation results based on the CIS 2008. We report three combinations of institutional variables for each EI type. Column 1 and 2 involve only the variable for formal institutions (Model 1). Better formal institutions are expected to positively affect the probability that firms introduce an EI. This hypothesis is confirmed as the marginal effect at the mean (MEM) is positive and highly significant, both for Ecomat and Ecoco. According to our estimations, the probability that a firm will introduce an EI relating to material reduction is 12.89% higher in the country with the strongest formal institutions compared to the country with the weakest formal institutions, if all other variables are taken at their mean value. This difference is a little larger for CO2 emissions, where the estimated difference amounts to 14.13%.
Table 5. Results of probit models for the CIS 2008
When including the informal institutional variable (Model 2) this picture changes, as the effect of formal institutions is significantly reduced to 5.6% for materials and 7.2% for CO2, respectively. The estimated effect of informal institutions is slightly larger for materials with 12.6% compared to 12% for CO2. When generating a variable that combines formal and informal institutional quality in one variable (Model 3), the effect is again slightly stronger for CO2. For both EI categories, the effect of the combined institutional variable is larger than for the formal institutional variable only.
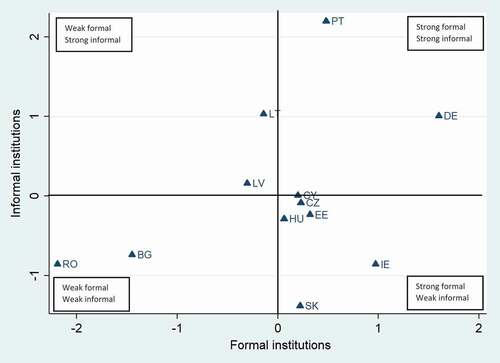
To understand this relatedness of the two institutional variables in more detail, displays the relationship of the formal and informal institutional variable. It can be noticed that there is a tendency of a positive coupling between both formal and informal institutions. Still, the two dimensions also introduce a certain degree of heterogeneity as can be seen by the fact that countries with similar formal institutions, such as Lithuania and Slovakia, differ strongly with respect to their informal institutions. Similarly, while Portugal and Germany score high in both institutional dimensions, Portugal has the strongest informal institutions, whereas Germany has the strongest formal institutions. Ireland is the most striking counterexample, as it has strong formal institutions, but underperforming informal institutions.
Figure 1. Formal and informal institutions for the CIS 2008
The effects of our control variables confirm our expectations, as all variables positively affect the probability that a firm will introduce an EI. The largest effect is found for Size, as the difference in probability between the smallest and largest firms is estimated as ~13%. details our estimation results for the CIS 2014 wave.
Table 6. Results of probit models for the CIS 2014
One should be cautious when comparing the effects of the two samples, as we cannot identify the extent to which the firms surveyed in the two waves overlap and, furthermore, we do not have identical countries in both waves. Nevertheless, given the large number of firms surveyed in each country, we consider it justifiable to cautiously compare the results.
Another potential concern could be the exact definition of the innovation types analysed. In the case of CO2, the CIS 2008 refers to a reduction of the CO2 footprint, while CIS 2014 additionally accounts for reduced energy use. However, we do not consider this an issue for interpretation for the following reasons. First, explicitly stated in the questionnaires, the reduction of CO2 emissions is still in the centre of interest. Second, a reduction of energy use almost invariably implies lower CO2 emissions, such that these innovations are implicitly contained in the CIS 2008 definition. Third, due to demanding either reduced energy use or emission reduction in the CIS 2014 questionnaire, there is no exclusion of EI that reduces CO2 while potentially even increasing energy use. Concerning material-related EI, the formulation also differs slightly between the two waves. While the CIS 2008 solely refers to material use, the CIS 2014 encompasses material or water use. Although this is a clear extension of the innovations qualifying as this type of EI, we consider that both the scope and interpretation remain fundamentally similar. In the first place, it seems reasonable to assume that reductions of material and water use are correlated anyhow. Concerning the interpretation, water is a resource that perfectly fits into our scope of interest. As all countries are affected identically by this change in definition and as we analyse the relation of EI to country characteristics, there should be no critical distortions of results.
The effect of formal institutions (Model 1) is again positive and highly significant. For Ecomat, the effect is a little larger than in the CIS 2008, with an estimated effect of 15.4%. For Ecoco, there is a substantial increase in the impact of formal institutions as the effect increases to 32%, more than twice as large as the CIS 2008 sample.
When including informal institutions in our CIS 2014 model (Model 2), the observation on the CIS 2008 is confirmed, as the effect of informal institutions is estimated to be larger for both EI categories. For Ecomat, the effect of formal institutions is even smaller (3.6%), while the effect of informal institutions is a little larger (17.5%). For Ecoco, the opposite observation holds concerning the ratio of the two institutional dimensions. Formal institutions exert a substantially larger effect in the CIS 2014 sample than in the CIS 2008 sample, estimated at 18.6%. Although the effect of informal institutions also increases from 12% to 21.3%, the measure of the effect of the two institutional dimensions on Ecoco are now almost equal. Thus, it can be generally stated that the influence exerted by institutions has changed over time. Formal institutions are less relevant for Ecomat, whereas informal institutions appear to be more significant. On the other hand, both institutional dimensions exert a more significant impact on Ecoco. The effect of informal institutions almost doubles, and the effect of formal institutions almost triples. Hence, the opposite holds for Ecoco, as formal institutions are relatively more important for the CIS 2014. The interaction variable (Model 3) for both institutional dimensions supports this pattern, as the effect settles at 18.3% for Ecomat and 34.1% for Ecoco.
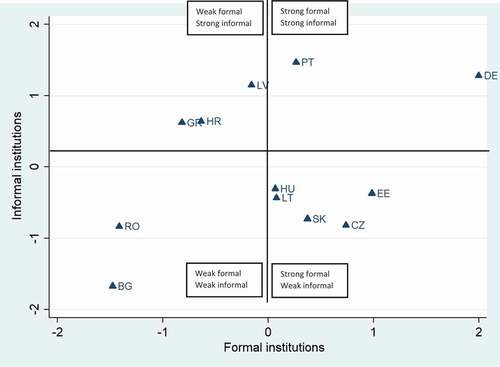
displays the relatedness of formal and informal institutions for the second CIS wave. Again, a positive coupling of the two dimensions seems evident. Yet again, each country shows unique patterns of the formal/informal relationship. Further, while the general structure of the country positioning remains quite similar, certain changes emerge. This includes the shift between Romania and Bulgaria, with Romania now outperforming Bulgaria, or the changes of position between Lithuania and Latvia, as the informal institutions of Latvia have substantially improved, while Lithuania reverted.
Figure 2. Formal and informal institutions for the CIS 2014
The results of our additional control variables confirm our expectations. Again, all variables are highly significant and positive. The only exception is our variable International in the case of Ecoco. The effect of Size is more pronounced, ranging at ~20% for Ecomat and ~25% for Ecoco.Footnote13 The effect of Group is more homogeneous than for the CIS 2008 as the effect is ~3% for both EI types. Once again International has a larger effect for Ecomat although the differences to the effects for Ecoco are also substantially smaller.
5.2. Robustness checks
To validate our findings, we ran several robustness checks. First, we ran our models using bivariate probit models, as the dependent variables may be correlated. Second, we included an additional control variable, namely whether a firm qualifies as a Foreign Direct Investment firm (FDI).Footnote14 This may be relevant, as FDI firms can be affected by institutional pressures relevant in the group’s head office country, while at the same time technology import may be affected. We further considered to control for public financial support, but this would have caused a substantial loss of firms in our sample.Footnote15 Third, we used an alternative way to investigate the role of institutions. Following Bryan and Jenkins (Citation2013), we estimated our probit models with country-fixed effects instead of the institutional variables. Then, we regressed the country-fixed effect on our institutional variables using OLS. Fourth, for both survey waves we excluded the two countries appearing in only one wave, in order to determine the robustness of our results for the identical ten-country sample. Fifth, we check our main results () with cluster-robust standard errors, which allow for intracountry correlation. Last, we used general innovativeness as a dependent variable.
Similar to the findings of Horbach (Citation2016) and Garrone, Grilli, and Mrkajic (Citation2018), the results did not change remarkably when using a bivariate probit, nor when including FDI as another firm-level control variable. Hence, we saw no need to refrain from using univariate probit, nor to include FDI into our general models. As stated in the methodological section, our analysis may suffer from having so few countries in our samples. Hence, to check our findings, we use OLS to analyse the effect of our institutional variables on the country effects, which are obtained from the probit analysis of our entire sample (Bryan and Jenkins Citation2013). The results are provided in .
Table 7. Results of OLS regressions for country-fixed effects
Focusing on Model 1 with formal institutions only, our main insights are confirmed. The estimated effect of formal institutions for Ecoco is larger for both CIS waves. Also, the difference between Ecomat and Ecoco is more pronounced for the CIS 2014 wave, as the estimated coefficient becomes larger for Ecoco, while slightly smaller for Ecomat. The coefficient for Ecoco for the CIS 2014 is significant at the 10% level.
Model 2 confirms our main insights as well. The effect of formal institutions is stronger for Ecoco for both CIS waves, yet the difference to Ecomat is more pronounced for the second wave. This OLS regression reveals that the coefficient of formal institutions is smaller for the second wave in the case of Ecoco, which is in contrast to the main results. The findings on informal institutions also support our main results. The impact of informal institutions is similar for both EI categories and waves, but the gap between the effects of formal and informal institutions becomes substantially larger for Ecomat than for Ecoco. Further, the effect of informal institutions is substantially larger for the second CIS wave, reflected by the informal coefficient being significant at the 5% level for both EI categories.
Model 3 explores the relation of our interacted institutional variable with the country effects. Again, the main findings are confirmed. Specifically, the effect is stronger for Ecoco, and the gap between Ecomat and Ecoco is larger for the second CIS wave. The coefficient for Ecoco increases by roughly one fourth, whereas it decreases slightly for Ecomat. For all four specifications, the interaction variable is significant at the 5% and 1% level, respectively.
To understand these results in more detail, we plot the country effects against our interacted institutional variable, following Bryan and Jenkins (Citation2013). We create separate graphs for each EI category for the second CIS wave (CIS 2014). plots the country-fixed effects from the analysis for Ecomat.
Figure 3. Country effects and interacted institutions for Ecomat
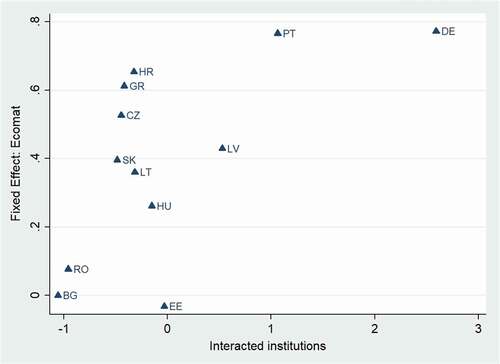
The graphic presentation of our regression results (, Model 3, Column 3) shown in provides some interesting insights. The country effect ranges from slightly below 0 to 0.8. Further, most countries are close to 0 for the interacted institutional variable. Yet, the country effect for these countries ranges from below 0 to over 0.6. It appears that this heterogeneity of country effects cannot be attributed to the institutional variable. Thus, the clear statistical relationship seems to be driven by the institutionally underperforming countries (Romania and Bulgaria), and the overperforming ones (Latvia, Portugal, and Germany). The country effect of Bulgaria and Romania is second and third lowest, ranging around zero. The country effect of Latvia at 0.4 is moderate, but Portugal and Germany have the highest country effects of more than 0.75, corresponding to the highest institutional values of 1 and almost 3, respectively.
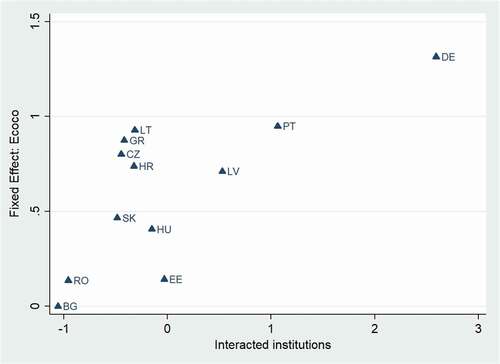
plots the country effects obtained from the analysis of Ecoco (, Model 3, Column 4). Interestingly, the emerging structure is very similar to the structure for Ecomat. The main difference seems to be the size of the country effect that ranges from 0 to 1.3. Given the similar structure of the two graphs, it seems plausible that the higher coefficient is mostly driven by the different range of the country effect for Ecoco. These graphical investigations allow the assumption that our institutional variable is a good indicator of the relative quality of the institutional environment of the countries included in our analysis. Yet, the clear heterogeneity of the country effects coefficient for those countries ranging around 0 for the institutional variable cannot be sufficiently related to our institutional measure.
Figure 4. Country effects and interacted institutions for Ecoco
When concentrating on the ten countries present in both survey waves,Footnote16 there are some differences to be observed. We compare model 2 with both institutional dimensions, using probit analysis. For the CIS 2008 wave, the results for Ecomat remain basically the same. For Ecoco, however, the effect of formal institutions is reduced to 4% and the effect of informal institutions increases to 15.7%. In other words, if we focus on the two areas of environmental concern, the effect of informal institutions is stronger for Ecoco in the ten country analysis (full sample: stronger for Ecomat), and the effect of formal institutions is slightly stronger for Ecomat in the ten country analysis (full sample: stronger for Ecoco). For CIS 2014, the differences are similar for both EI types. The effect of formal institutions is more pronounced and the effect of informal institutions is less pronounced in the ten country sample. In the case of Ecoco, the effect of formal institutions is estimated to be ~4% higher than the effect of informal institutions in the ten country sample (full sample: the effect of informal institutions is ~3% larger).
To secure our results, we also tested our main results when relaxing the assumption of independence by using cluster-robust standard errors that allow for intracountry correlation.Footnote17 For the CIS 2008 results () the significance of formal institutions is reduced, dropping to significance at the 5% level in specifications with formal institutions only (Columns 1 and 2), and turning insignificant when both institutional dimensions are included (Columns 3 and 4). The informal institutional dimension is only significant at the 5% level with Ecoco as dependent variable (Column 4), but not affected for Ecomat. The combined institutional measure is not affected, remaining significant at the 1% level. For the CIS 2014 results () the significance levels of our institutional measures are not affected, except for formal institutions in the specification with both institutional measures for Ecomat (Column 3), where the coefficient turns insignificant. This highlights that formal institutional quality seems particularly relevant for Ecoco, where the effect of formal institutions is robust in this specification (Column 4).
As a final robustness check, we used a dichotomous innovation variable to capture whether or not a firm introduced any type of innovation. We conduct this investigation to ensure that our measures of institutions are specifically relevant in the context of EI. The results confirmed that our combined institutional measure is more positively related to increasing the introduction of the analysed EI types than general innovation. This robustness check follows Garrone, Grilli, and Mrkajic (Citation2018) and is a way to show that the institutions are not generic indications of a country’s progress. The results will be discussed in more detail in the next section.
6. Discussion and conclusion
In this study we investigate the role of both regulatory (formal) and social (informal) institutional pressures on the development of environmental innovation designed to address two substantially different types of environmental issues, namely: reducing material use and/or reducing CO2 emissions. By utilising the CIS 2008 and 2014 waves, we are able to investigate the institutional effects at two different points in time separated by a six-year gap. We find that formal institutions are more strongly related to the introduction of EI aimed at reducing CO2 emissions. Regarding effect size, informal institutions are found to be the institutional dimension with the more significant impact.
The results of this study confirm a positive role of formal and informal institutional factors for EI development, thus supporting hypothesis 1. Our general finding that stronger institutional pressures are associated with the introduction of EI is in line with similar studies (Berrone et al. Citation2013; Liao Citation2018). Garrone, Grilli, and Mrkajic (Citation2018) find partially different results concerning energy efficiency innovations in European countries. They find that formal institutional pressures affect both product and process energy efficiency innovations, while informal institutional pressures only affect product innovations (Garrone, Grilli, and Mrkajic Citation2018). Our results indicate that informal institutions might also affect process innovations – a finding that draws into question the generalisability of the conclusions drawn by Garrone, Grilli, and Mrkajic (Citation2018). This difference might be attributed to different characteristics of EI with respect to visibility and perception. We consider that resource use, and particularly emissions, are more visible to the public (and employees), such that firms are more likely to be subjected to informal pressures. Energy use, however, is used by most firms with its impacts occurring ‘behind the curtain’, since a company’s energy use and its consequences are not very visible to the public or employees alike. Informal pressure in the case of energy is probably rather targeted towards the producers, who only constitute a small share of firms. This consideration can be viewed as potential starting point for more in-depth research on such differences between EI types.
Hypothesis 2 is confirmed as well. We find that formal institutions exert a more substantial effect on emission reduction innovation compared to material use innovation. We argued that while the reduction of material use is reflected by the market to some degree via prices, the reduction of emissions qualifies as a negative externality and thus requires regulatory incentives. Analysis of the reasons for EI introduction solely based on the CIS data finds similar relationships (Horbach Citation2016). Namely, regulation and subsidies – qualifying as formal institutions – are substantially more closely associated with emission innovation than with EI related to material use (Horbach Citation2016). Cost savings, on the other hand, are substantially more important for material use innovation (Horbach Citation2016). The increasing importance of formal institutions for emissions over time may be related to more stringent and effective regulations, making it more difficult to simply comply via symbolic efforts (Berrone et al. Citation2013).
The results of this study show that the interaction of formal and informal institutions has a higher positive impact on both EI types compared to formal institutions only, thus confirming hypothesis 3. We drew upon the consideration that formal institutions are more effective when rooted in corresponding informal institutions (Boettke and Coyne Citation2009). The combined institutional dimension always exerts the most substantial effect on environmental innovation. This is mainly in line with the related literature, since the interaction of the institutional dimensions is considered to be of particular importance (Williamson Citation2009). More specifically, it has been shown that the effects of political value orientation on environmental policy support are influenced by the quality of government. A high quality of government supports the effects of value orientations on public environmental policy support (Davidovic, Harring, and Jagers Citation2019). Such mutual reinforcement further validates why a combined institutional variable leads to the most pronounced effect. While this confirms our expectations, however, the interaction of formal and informal institutions is generally complex (Helmke and Levitsky Citation2004; Williamson Citation2009). Thus, with our study providing a first assessment of how the combined institutional conditions affect EI, we ascertain that there should be further research complementing the discussion on the role of the interaction between formal and informal institutions (Helmke and Levitsky Citation2004; Williamson Citation2009; Williams, Vorley, and Williams Citation2017).
In previous research on EI utilising CIS data, only one wave of the survey was analysed (Horbach Citation2016; Garrone, Grilli, and Mrkajic Citation2018; Madaleno et al. Citation2020). When comparing the results for the two CIS waves we find that, overall, formal institutions have more impact on the introduction of EI aimed at reducing CO2 emissions. The CIS 2014 wave reveals that the gap between the effects of formal institutions on emission reduction and on material use reduction is substantially larger. We interpret this result as an indication that, in relative terms, formal institutions become more important specifically for emissions reduction over time. With some caution, this could be related to the interaction of the joint EU framework conditions with national institutional quality, contingent upon expectation formation. The importance of expected regulations as a motivation for EI has been presented (Horbach Citation2016) and is mandatory for optimisation efforts of firms. The introduction of the EU Climate and Energy Package in 2008 clearly signalled the supranational pursuit of emission reduction, thus potentially exacerbating the credibility of national environmental stringency and its expected longevity.
When comparing the interrelation of the two institutional dimensions, we find mixed evidence for emission reduction innovation,Footnote18 while in the case of material use innovation informal institutions are gaining in relative importance. Generally speaking, the estimated effect of institutions is more pronounced for the second sample (CIS 2014).
Our curiosity about EI is driven by the fact that differences between countries concerning the introduction of EI persist, and that these differences cannot be explained exclusively by firm-level determinants. We attempt to explain these differences by accounting for the role of both formal and informal institutional pressures that may influence firms’ strategies. However, as shown in , substantial dynamics in country effects cannot be directly related to the measured institutional differences.Footnote19 From a theoretical perspective, institutional pressures are expected to positively affect the introduction of environmental innovation. Empirically, the influence of these pressures was found by pertinent previous studies and can be contended by our analysis.
Nevertheless, as we are constrained to cross-sectional data, statements about directions of causality or the addressing of endogeneity issues is difficult (Mairesse and Mohnen Citation2010). Especially, we cannot control unobserved heterogeneity due to the lack of this temporal dimension (Mairesse and Mohnen Citation2010). Institutional measures may be correlated with other country characteristics, such as technological capabilities. Further, the level of analysis may play a role as well. Firms are not only embedded in the national context, but likely also dependent upon more specific regional contexts (Berrone et al. Citation2013). More precisely, firms are affected by very specific regulatory and normative pressures that can vary at a detailed sectoral and regional level and may not be captured in our empirical setting. Moreover, firm-specific characteristics such as the relative environmental performance of a company have been shown to play a role (Berrone et al. Citation2013), yet cannot be sufficiently controlled with the utilised datasets.
Nonetheless, our work provides evidence that the introduction of different EI types is, to a varying degree, related to the presence of institutional pressures in the concerned country. The evidence presented should be treated with caution, due to the data employed in our study. We emphasise, however, that the distinction of EI types and the corresponding relevance of different institutional pressures are worthy of further investigation. Progress on this subject will require more detailed analysis of institutional pressures, especially at higher levels of disaggregation with respect to sectoral and regional environments. The availability of data sources that allow for a panel data structure to control unobserved heterogeneity in firms’ initial conditions will be an important prerequisite.
Declarations of interest
None.
Disclosure of potential conflicts of interest
No potential conflict of interest was reported by the author(s).
Acknowledgments
The publication Open Access fee was funded by the Priority Research Area Society of the Future under the program “Excellence Initiative –Research University” at the Jagiellonian University in Krakow.
The authors are thankful to three anonymous reviewers for their constructive comments that helped to substantially improve this paper.
The authors thank Eurostat for providing access to the CIS microdata. The results and conclusions discussed in this paper are solely the responsibility of the authors, and do not necessarily reflect the views of Eurostat or the European Commission. Responsibility for any errors are with the authors.
Notes
1 In 2020, the European Commission proposed to raise this target to 55% as part of the European Green Deal (Laurent Citation2020).
2 Since energy saving reduces both costs and emissions.
3 We do not consider the EU emission trading system to have changed this, since its effectiveness during the time of interest is contested (Laing et al. Citation2013; Ellerman, Marcantonini, and Zaklan Citation2016).
4 We utilised the scientific use files (SUF) that were made available via a secure platform (formerly CD-ROM). The procedure of application for CIS microdata is described on the Eurostat webpage: https://ec.europa.eu/eurostat/documents/203647/771732/How_to_apply_for_microdata_access.pdf.
5 These will be discussed in more detail in the discussion section.
6 Patent data, in contrast, only refers to the development of EI.
7 Note that for Cyprus we had to take the value from the GCR 2005–06, as there was no data for Cyprus in the 2003–04 report. However, these variables are rather slow moving, as can be confirmed when looking at the corresponding values for countries included in both reports. Hence, we consider this a good alternative to dropping Cyprus.
8 Invariance across countries and time may not simply be assumed and could lead to biased results (Davidov Citation2010).
9 Anonymity here concerns the fact that an interview is an interaction with other people, whereas the voting decision is taken in absence of other people recognising the actual decision.
10 The values in the DoPI for these years corresponded to elections that took place at least one year prior. It should be noted that assigning parties as leftist/green involves a certain level of uncertainty and imprecision. However, we consider the measurement to present a meaningful approximation of social values.
11 Some of the data applied in the analysis in this publication are based on material from the ‘European Election Database’. The data are collected from original sources, prepared and made available by the NSD – Norwegian Centre for Research Data (NSD). NSD are not responsible for the analyses/interpretation of the data presented here. Complementing was done to disentangle vote shares of other opposition parties which are summed up in the DoPI. For Hungary and Lithuania, we used the data from EED to fill in data which was missing in the DoPI.
12 For each size class we assign the middle value to the firm. For example, a firm with 10 to 50 employees will be assigned the value of 30. This firm size variable is logarithmized for inclusion into the model.
13 Note that differences in Size effects may be due to differences in the size classes of CIS 2008 and CIS 2014.
14 A firm is defined as an FDI firm if it belongs to a group with the head office located abroad.
15 The same holds for information on R&D expenditures. Further, these variables are likely endogenous.
16 Excluding Ireland and Cyprus from the first, and Croatia and Greece from the second wave.
17 We solely discuss the results with respect to our institutional variables in the main text. However, for our control variables the following patterns emerge. For the CIS 2008 results, the effects of Size and Group remain significant throughout, while International turns insignificant when Ecoco is the dependent variable. For the CIS 2014 results, Size remains significant throughout. International turns insignificant throughout, except for one specification with the combined institutional dimension and Ecomat as dependent variable, where it is significant at the 10% level. Group turns insignificant for specifications with only the formal institutional dimension, while being significant at the 10% or 5% level respectively in the other specifications.
18 The results of OLS (Table 7) and the main analysis differ (Tables 4 and 5). In the main analysis, formal institutions gain in relative importance compared to the effects of informal institutions, whereas in the OLS analysis informal institutions gain in relative importance. These differences could be due to the different model types employed.
19 Note that this concerns the interacted institutional measure. However, the structure is similar for the formal or informal institutional variable.
References
- Acemoglu, D., and J. A. Robinson. 2012. Why Nations Fail: The Origins of Power, Prosperity, and Poverty. New York: Crown Business.
- Acemoglu, D., S. Johnson, and J. A. Robinson. 2002. “Reversal of Fortune: Geography and Institutions in the Making of the Modern World Income Distribution.” The Quarterly Journal of Economics 117 (4): 1231–1294.
- Aldieri, L., and C. P. Vinci. 2020. “Climate Change and Knowledge Spillovers for Cleaner Production: New Insights.” Journal of Cleaner Production 271 (October): 122729. doi:https://doi.org/10.1016/j.jclepro.2020.122729.
- Babutsidze, Z., and A. Chai. 2018. “Look at Me Saving the Planet! The Imitation of Visible Green Behavior and Its Impact on the Climate Value-Action Gap.” Ecological Economics 146: 290–303. doi:https://doi.org/10.1016/j.ecolecon.2017.10.017. April.
- Barbieri, N., C. Ghisetti, M. Gilli, G. Marin, and F. Nicolli. 2016. “A Survey of the Literature on Environmental Innovation Based on Main Path Analysis.” Journal of Economic Surveys 30 (3): 596–623. doi:https://doi.org/10.1111/joes.12149.
- Beck, T., G. Clarke, A. Groff, P. Keefer, and P. Walsh. 2000. “The Database of Political Institutions.” Policy Research Working Paper (February): 2283. World Bank.
- Behrens, A. 2016. “The Climate Change Impact of Material Use.” Intereconomics 51 (4): 209–212. doi:https://doi.org/10.1007/s10272-016-0604-0.
- Berrone, P., A. Fosfuri, L. Gelabert, and L. R. Gomez-Mejia. 2013. “Necessity as the Mother of ‘Green’ Inventions: Institutional Pressures and Environmental Innovations.” Strategic Management Journal 34 (8): 891–909. doi:https://doi.org/10.1002/smj.2041.
- Boettke, P. J., and C. J. Coyne. 2009. “Context Matters: Institutions and Entrepreneurship.” Foundations and Trends in Entrepreneurship 5 (3): 135–209. doi:https://doi.org/10.1561/0300000018.
- Borghesi, S., G. Cainelli, and M. Mazzanti. 2015. “Linking Emission Trading to Environmental Innovation: Evidence from the Italian Manufacturing Industry.” Research Policy 44 (3): 669–683. doi:https://doi.org/10.1016/j.respol.2014.10.014.
- Bryan, M. L., and S. P. Jenkins. 2013. “Regression Analysis of Country Effects Using Multilevel Data: A Cautionary Tale.” IZA Discussion Paper Series No. 7583. Bonn: Institute for the Study of Labor.
- Bryan, M. L., and S. P. Jenkins. 2016. “Multilevel Modelling of Country Effects: A Cautionary Tale.” European Sociological Review 32 (1): 3–22. doi:https://doi.org/10.1093/esr/jcv059.
- Cai, W., and G. Li. 2018. “The Drivers of Eco-innovation and Its Impact on Performance: Evidence from China.” Journal of Cleaner Production 176 (March): 110–118. doi:https://doi.org/10.1016/j.jclepro.2017.12.109.
- Capros, P., L. Mantzos, L. Parousos, N. Tasios, G. Klaassen, and T. Van Ierland. 2011. “Analysis of the EU Policy Package on Climate Change and Renewables.” Energy Policy 39 (3): 1476–1485. doi:https://doi.org/10.1016/j.enpol.2010.12.020.
- Costantini, V., F. Crespi, G. Orsatti, and A. Palma. 2015. “Policy Inducement Effects in Energy Efficiency Technologies. An Empirical Analysis of the Residential Sector.” In Green Energy and Efficiency: An Economic Perspective, edited by A. Ansuategi, J. Delgado, and I. Galarraga, 201–232. Switzerland: Springer International Publishing.
- Da Silva Rabêlo, O., and A. S. S. De Azevedo Melo. 2019. “Drivers of Multidimensional Eco-innovation: Empirical Evidence from the Brazilian Industry.” Environmental Technology 40 (19): 2556–2566. doi:https://doi.org/10.1080/09593330.2018.1447022.
- Davidov, E. 2010. “Testing for Comparability of Human Values across Countries and Time with the Third Round of the European Social Survey.” International Journal of Comparative Sociology 51 (3): 171–191. doi:https://doi.org/10.1177/0020715210363534.
- Davidovic, D., N. Harring, and S. C. Jagers. 2019. “The Contingent Effects of Environmental Concern and Ideology: Institutional Context and People’s Willingness to Pay Environmental Taxes.” Environmental Politics. doi:https://doi.org/10.1080/09644016.2019.1606882.
- Del Río, P., D. Romero-Jordán, and C. Peñasco. 2017. “Analysing Firm-Specific and Type-Specific Determinants of Eco-Innovation.” Technological and Economic Development of Economy 23 (2): 270–295. doi:https://doi.org/10.3846/20294913.2015.1072749.
- Delmas, M., and M. W. Toffel. 2004. “Stakeholders and Environmental Management Practices: An Institutional Framework.” Business Strategy and the Environment 13 (4): 209–222. doi:https://doi.org/10.1002/bse.409.
- Demirel, P., and E. Kesidou. 2011. “Stimulating Different Types of Eco-innovation in the UK: Government Policies and Firm Motivations.” Ecological Economics 70 (8): 1546–1557. doi:https://doi.org/10.1016/j.ecolecon.2011.03.019.
- Deters, H. 2019. “European Environmental Policy at 50: Five Decades of Escaping Decision Traps?” Environmental Policy and Governance 29 (5): 315–325. doi:https://doi.org/10.1002/eet.1855.
- Díaz-García, C., A. González-Moreno, and F. J. Sáez-Martínez. 2015. “Eco-innovation: Insights from a Literature Review.” Innovation 17 (1): 6–23. doi:https://doi.org/10.1080/14479338.2015.1011060.
- Dunlap, R. E. 1975. “The Impact of Political Orientation on Environmental Attitudes and Actions.” Environment and Behavior 7 (4): 428–454. doi:https://doi.org/10.1177/001391657500700402.
- Edquist, C. 1997. “Systems of Innovation Approaches: Their Emergence and Characteristics.” In Systems of Innovation: Technologies, Institutions and Organizations, edited by C. Edquist, 1–35. London: Routledge London.
- Ellerman, A. D., C. Marcantonini, and A. Zaklan. 2016. “The European Union Emissions Trading System: Ten Years and Counting.” Review of Environmental Economics and Policy 10 (1): 89–107. doi:https://doi.org/10.1093/reep/rev014.
- European Commission. 2008. The Raw Materials Initiative - Meeting Our Critical Needs for Growth and Jobs in Europe. Brussels: European Commission.
- European Commission. 2010. Europe 2020 – A Strategy for Smart, Sustainable and Inclusive Growth. Brussels: European Commission.
- European Commission. 2011a. Roadmap to a Resource Efficient Europe. Brussels: European Commission.
- European Commission. 2011b. Innovation for a Sustainable Future - the Eco-innovation Action Plan (Eco-ap). Brussels: European Commission.
- European Commission. 2015. Closing the Loop: An EU Action Plan for the Circular Economy. Brussels: European Commission.
- European Commission. 2019. “2030 Climate & Energy Framework.” European Commission. Accessed 06 February 2021. https://ec.europa.eu/clima/policies/strategies/2030_en
- Garrone, P., L. Grilli, and B. Mrkajic. 2018. “The Role of Institutional Pressures in the Introduction of Energy-efficiency Innovations.” Business Strategy and the Environment 27 (8): 1245–1257. doi:https://doi.org/10.1002/bse.2072.
- Gee, S., and A. McMeekin. 2011. “Eco-Innovation Systems and Problem Sequences: The Contrasting Cases of US and Brazilian Biofuels.” Industry and Innovation 18 (3): 301–315. doi:https://doi.org/10.1080/13662716.2011.561029.
- Geng, X., and K. G. Huang. 2016. “Informal Institutions and the Geography of Innovation: An Integrative Perspective.” In Global Innovation and Entrepreneurship: Challenges and Experiences from East and West, edited by S. E. Little, F. M. Go, and T. Shuk-Ching, 61–78. London: Palgrave MacMillan.
- González-López, M. 2011. “The Institutions-Innovation Dilemma: The Case of Coastal Fisheries.” Journal of Technology Management & Innovation 6 (3): 184–195. doi:https://doi.org/10.4067/S0718-27242011000300014.
- Greene, W. H. 2012. Econometric Analysis. England: Pearson Education Limited.
- Helmke, G., and S. Levitsky. 2004. “Informal Institutions and Comparative Politics: A Research Agenda.” Perspectives on Politics 2 (4): 725–740. doi:https://doi.org/10.1017/S1537592704040472.
- Hodgson, G. M. 2006. “What are Institutions?” Journal of Economic Issues 40 (1): 1–25. doi:https://doi.org/10.1080/00213624.2006.11506879.
- Hojnik, J. 2017. In Pursuit of Eco-innovation: Drivers and Consequences of Eco-innovation at Firm Level. Koper: University of Primorska Press.
- Horbach, J. 2008. “Determinants of Environmental Innovation - New Evidence from German Panel Data Sources.” Research Policy 37 (1): 163–173. doi:https://doi.org/10.1016/j.respol.2007.08.006.
- Horbach, J. 2016. “Empirical Determinants of Eco-innovation in European Countries Using the Community Innovation Survey.” Environmental Innovation and Societal Transitions 19: 1–14. doi:https://doi.org/10.1016/j.eist.2015.09.005.
- Horbach, J., C. Rammer, and K. Rennings. 2012. “Determinants of Eco-innovations by Type of Environmental Impact - the Role of Regulatory Push/pull, Technology Push and Market Pull.” Ecological Economics 78: 112–122. doi:https://doi.org/10.1016/j.ecolecon.2012.04.005.
- Horbach, J., V. Oltra, and J. Belin. 2013. “Determinants and Specificities of Eco-innovations Compared to Other Innovations - an Econometric Analysis for the French and German Industry Based on the Community Innovation Survey.” Industry and Innovation 20 (6): 523–543. doi:https://doi.org/10.1080/13662716.2013.833375.
- Jacob, K. 2018. “Shaping System Innovation: Transformative Environmental Policies.” In New Developments in Eco-Innovation Research, edited by J. Horbach and C. Reif, 81–94. Cham: Springer International Publishing Cham.
- Kapás, J. 2019. “The Interaction of Individual Values and Sticky Formal Institutions in Economic Development.” The European Journal of Comparative Economics 16 (1): 41–67.
- Kemp, R., and V. Oltra. 2011. “Research Insights and Challenges on Eco-Innovation Dynamics.” Industry and Innovation 18 (3): 249–253. doi:https://doi.org/10.1080/13662716.2011.562399.
- Kesidou, E., and P. Demirel. 2012. “On the Drivers of Eco-innovations: Empirical Evidence from the UK.” Research Policy 41 (5): 862–870. doi:https://doi.org/10.1016/j.respol.2012.01.005.
- Lähteenmäki-Uutela, A., J. Yliskylä-Peuralahti, E. Olaniyi, T. Haukioja, S. Repka, G. Prause, and O. De Andres Gonzalez. 2019. “The Impacts of the Sulphur Emission Regulation on the Sulphur Emission Abatement Innovation System in the Baltic Sea Region.” Clean Technologies and Environmental Policy 21 (5): 987–1000. doi:https://doi.org/10.1007/s10098-019-01684-2.
- Laing, T., M. Sato, M. Grubb, and C. Comberti. 2013. “Assessing the Effectiveness of the EU Emissions Trading System.” Centre for Climate Change Economics and Policy Working Paper: 126. Grantham Research Institute on Climate Change and the Environment.
- Laurent, É. 2020. “The European Green Deal: Bring Back the New.” In OFCE Policy Brief No. 63. Paris: Observatoire français des conjonctures économiques (OFCE) Paris.
- Lee, W. C., and S. H. Law. 2017. “Roles of Formal Institutions and Social Capital in Innovation Activities: A Cross-Country Analysis.” Global Economic Review 46 (3): 203–231. doi:https://doi.org/10.1080/1226508X.2017.1292859.
- Liao, Y.-C., and K.-H. Tsai. 2019. “Bridging Market Demand, Proactivity, and Technology Competence with Eco-innovations: The Moderating Role of Innovation Openness.” Corporate Social Responsibility and Environmental Management 26 (3): 653–663. doi:https://doi.org/10.1002/csr.1710.
- Liao, Z. 2018. “Institutional Pressure, Knowledge Acquisition and a Firm’s Environmental Innovation.” Business Strategy and the Environment 27 (7): 849–857. doi:https://doi.org/10.1002/bse.2036.
- Lin, R. J., K. H. Tan, and Y. Geng. 2013. “Market Demand, Green Product Innovation, and Firm Performance: Evidence from Vietnam Motorcycle Industry.” Journal of Cleaner Production 40 (February): 101–107. doi:https://doi.org/10.1016/j.jclepro.2012.01.001.
- Lundvall, B. A. 1992. National Systems of Innovation: Towards a Theory of Innovation and Interactive Learning. London: Pinter.
- Machnik-Słomka, J., and I. Kłosok-Bazan. 2017. “The Problem of Environmental Awareness in Terms of the Eco-Innovation Implementation in Enterprises.” Economic and Environmental Studies 17 (42): 221–234. doi:https://doi.org/10.25167/ees.2017.42.5.
- Madaleno, M., M. Robaina, M. Ferreira Dias, and M. Meireles. 2020. “Dimension Effects in the Relationship between Eco-Innovation and Firm Performance: A European Comparison.” The 6th International Conference on Energy and Environment Research - Energy and environment: challenges towards circular economy, Aveiro, Portugal, 6 (February): 631–637. https://doi.org/10.1016/j.egyr.2019.09.038.
- Mairesse, J., and P. Mohnen. 2010. “Using Innovation Surveys for Econometric Analysis.” In Handbook of the Economics of Innovation, edited by B. H. Hall and N. Rosenberg, 1129–1155. Vol. 2. Burlington: Academic Press.
- Moreau, V., M. Sahakian, P. Van Griethuysen, and F. Vuille. 2017. “Coming Full Circle: Why Social and Institutional Dimensions Matter for the Circular Economy.” Journal of Industrial Ecology 21 (3): 497–506. doi:https://doi.org/10.1111/jiec.12598.
- Nelson, R. R. 1993. National Innovation Systems: A Comparative Analysis. Oxford: Oxford University Press.
- Nelson, R. R. 2005. Technology, Institutions, and Economic Growth. Cambridge: Harvard University Press.
- Neumayer, E. 2004. “The Environment, Left-wing Political Orientation and Ecological Economics.” Ecological Economics 51 (3): 167–175. doi:https://doi.org/10.1016/j.ecolecon.2004.06.006.
- North, D. C. 1990. Institutions, Institutional Change and Economic Performance. Cambridge: Cambridge University Press.
- O’Mahony, M., and M. P. Timmer. 2009. “Output, Input and Productivity Measures at the Industry Level: The EU KLEMS Database.” The Economic Journal 119 (538, June): 374–403. doi:https://doi.org/10.1111/j.1468-0297.2009.02280.x.
- Popp, D., R. G. Newell, and A. B. Jaffe. 2010. “Energy, the Environment, and Technological Change.” In Handbook of the Economics of Innovation, edited by B. H. Hall and N. Rosenberg, 873–937. Vol. 2. Burlington: Academic Press.
- Porter, M. E., and C. Van Der Linde. 1995. “Toward a New Conception of the Environment-Competitiveness Relationship.” Journal of Economic Perspectives 9 (4): 97–118. doi:https://doi.org/10.1257/jep.9.4.97.
- Rennings, K. 2000. “Redefining Innovation - Eco-innovation Research and the Contribution from Ecological Economics.” Ecological Economics 32 (2): 319–332. doi:https://doi.org/10.1016/S0921-8009(99)00112-3.
- Rennings, K., and C. Rammer. 2011. “The Impact of Regulation-Driven Environmental Innovation on Innovation Success and Firm Performance.” Industry and Innovation 18 (3): 255–283. doi:https://doi.org/10.1080/13662716.2011.561027.
- Rodrik, D., A. Subramanian, and F. Trebbi. 2004. “Institutions Rule: The Primacy of Institutions over Geography and Integration in Economic Development.” Journal of Economic Growth 9 (2): 131–165. doi:https://doi.org/10.1023/B:JOEG.0000031425.72248.85.
- Roland, G. 2004. “Understanding Institutional Change: Fast-moving and Slow-moving Institutions.” Studies in Comparative International Development 38 (4): 109–131. doi:https://doi.org/10.1007/BF02686330.
- Santoalha, A., and R. Boschma. 2020. “Diversifying in Green Technologies in European Regions: Does Political Support Matter?” Regional Studies 1–14. April. doi: https://doi.org/10.1080/00343404.2020.1744122.
- Schläpfer, F., A. Roschewitz, and N. Hanley. 2004. “Validation of Stated Preferences for Public Goods: A Comparison of Contingent Valuation Survey Response and Voting Behaviour.” Ecological Economics 51 (1): 1–16. doi:https://doi.org/10.1016/j.ecolecon.2004.04.006.
- Silve, F., and A. Plekhanov. 2015. “Institutions, Innovation and Growth: Cross-Country Evidence.” Working Paper (February): 177. London: European Bank for Reconstruction and Development.
- Srholec, M. 2015. “Understanding the Diversity of Cooperation on Innovation across Countries: Multilevel Evidence from Europe.” Economics of Innovation and New Technology 24 (1–2): 159–182. doi:https://doi.org/10.1080/10438599.2014.897864.
- Steenkamp, J. B. E. M., and H. Baumgartner. 1998. “Assessing Measurement Invariance in Cross-National Consumer Research.” Journal of Consumer Research 25 (1): 78–90. doi:https://doi.org/10.1086/209528.
- Stern, D. I. 2017. “The Environmental Kuznets Curve after 25 Years.” Journal of Bioeconomics 19 (1): 7–28. doi:https://doi.org/10.1007/s10818-017-9243-1.
- Tebaldi, E., and B. Elmslie. 2013. “Does Institutional Quality Impact Innovation? Evidence from Cross-country Patent Grant Data.” Applied Economics 45 (7): 887–900. doi:https://doi.org/10.1080/00036846.2011.613777.
- Töbelmann, D., and T. Wendler. 2020. “The Impact of Environmental Innovation on Carbon Dioxide Emissions.” Journal of Cleaner Production 244 (January): 118787. doi:https://doi.org/10.1016/j.jclepro.2019.118787.
- UNEP, 2016. Global Material Flows and Resource Productivity: Assessment Report for the UNEP International Resource Panel. Paris: United Nations Environment Programme.
- Van Den Bergh, J. C. J. M. 2013. “Environmental and Climate Innovation: Limitations, Policies and Prices.” Technological Forecasting and Social Change 80 (1): 11–23. doi:https://doi.org/10.1016/j.techfore.2012.08.004.
- Verschuuren, J. 2017. “Does Environmental Law Encourage Obstruct Eco-Innovations? Evidence from Case Studies in the Netherlands.” European Energy and Environmental Law Review 26 (2): 51–59.
- Wagner, M., and P. Llerena. 2011. “Eco-Innovation through Integration, Regulation and Cooperation: Comparative Insights from Case Studies in Three Manufacturing Sectors.” Industry and Innovation 18 (8): 747–764. doi:https://doi.org/10.1080/13662716.2011.621744.
- Wang, H., J. Huang, H. Zhou, C. Deng, and C. Fang. 2020. “Analysis of Sustainable Utilization of Water Resources Based on the Improved Water Resources Ecological Footprint Model: A Case Study of Hubei Province, China.” Journal of Environmental Management 262: 110331. doi:https://doi.org/10.1016/j.jenvman.2020.110331. May.
- Williams, N., T. Vorley, and C. Williams. 2017. Entrepreneurship and Institutions: The Causes and Consequences of Institutional Asymmetry. London, New York: Rowman & Littlefield Publishers.
- Williamson, C. R. 2009. “Informal Institutions Rule: Institutional Arrangements and Economic Performance.” Public Choice 139 (3–4): 371–387. doi:https://doi.org/10.1007/s11127-009-9399-x.
Appendix
Table A1. Descriptive statistics
Appendix
Table A2. Correlation matrix