
 ?Mathematical formulae have been encoded as MathML and are displayed in this HTML version using MathJax in order to improve their display. Uncheck the box to turn MathJax off. This feature requires Javascript. Click on a formula to zoom.
ABSTRACT
This paper investigates the relationship between digital skills of the workforce and income inequalities within regions. By combining three databases – EU-LFS, EU-SILC and ESCO – the analysis studies the relationships between digital skills and income inequalities for an unbalanced panel of 103 European regions for the period 2003–13. The results show that the relationship between digital skills and inequalities varies substantially across income groups and, in particular, that digitalisation exacerbates inequalities among the less affluent whereas it mitigates them among those with higher income levels.
1. Introduction
The main objective of this paper is to analyse the relationship between digitalisation and income inequality. While prior literature has explored the determinants of inequality, both theoretically and empirically Furceri and Ostry, Citation2019; Iacono and Ranaldi Citation2022; Tassaeva Citation2021), this paper fills a gap a systematic exploration of the linkages between the widespread uptake of digital technology and inequality at sub-national levels in Europe. Such an endeavour is timely considering that both digitalisation and social cohesion rank high in the policy agenda. The European Commission (EC) has promoted digitisation of European society to achieve four goals: deploying new solutions for societal challenges; supporting citizen welfare, social cohesion and equality; securing technological sovereignty and cybersecurity; and supporting the economy and competitiveness (European Commission Citation2020b). In this context, digitisation emerges as a natural complement to social cohesion and equality, at least in the current policy discourse, not only in Europe but also in the framework of the United Nation’s (UN) Sustainable Development Goals.
Although in principle digitalisation can mitigate inter-regional differences by enabling economic development and catching up, unintended outcomes such as new forms of inequality or the exacerbation of existing disparities, are possible. This is why identifying new and old sources of inequality is important to be able to look beyond immediate distributional effects and investigate whether and how such a phenomenon can both hamper future growth capacity, and ultimately undermine the pursuit of convergence and social cohesion (Bachtler and Gorzelak Citation2007; Charron Citation2016; Dunford Citation2005; Iammarino, Rodríguez-Pose, and Storper Citation2019). The current EU strategy rests upon the rationale of mobilising human capital by financing infrastructures, education, skill development and R&D. These policies are however self-defeating if returns to different segments of the labour market diverge, and there is a real risk that digitalisation may exacerbate existing inequalities if digital transformation is not accompanied by skill upgrading (Iammarino et al. Citation2020). The paucity of studies about distributional effects of the spread and use of digital technologies in Europe is a gap in the regional economics and regional science literatures, and a key motivation for the present paper.
To be sure, digitalisation has many facets and can be empirically operationalised in several ways (Di Maggio et al. Citation2004). In this paper, we follow the shared tenet of the EC and the UN in focusing on human capital as a central engine, and focus on e-skills, that is, work competences that are needed to operate effectively digital technologies. The development of e-skills ranks high in the competitiveness policy agenda of EU countries, and recent research shows that European regions that placed ICT-related activities at the core of their Smart Specialisation strategies exhibit better innovation performance and higher diversification (Castellacci, Consoli, and Santoalha Citation2020). The present paper investigates for the first time the relationship between digital skills of the workforce and income inequalities within regions in Europe. Conceptually, e-skills can affect income inequalities through two distinct transmission mechanisms. First, since digital technologies are skill-biased, e-skill development is likely to affect labour demand and wages differently for workers with different education levels, occupations and working tasks (e.g. routine versus non-routine tasks). Second, e-skills enable to access, imitate and recombine advanced external knowledge in novel ways. Innovation and creative destruction will strengthen incumbents’ profitability in some markets and provide new technological and market opportunities for new ventures and SMEs in other sectors. Both these transmission mechanisms – skill-bias and innovation, respectively – can affect the distribution of workers’ wages and firms’ profits and, hence, carry relevant distributional implications.
More cogently, our study explores whether and to what extent local e-skills endowment is associated with income inequalities within regions, and between different portions of the income distribution. In particular, we focus on whether digital skills development is associated to lower inequality in the upper part of the income distribution, since high-income and highly educated workers are more likely to reap the benefits of innovation and returns to digital skills. At the same time, digital skill development may increase inequalities in the lower part of the income distribution, wherein low-income and less educated workers may confront higher barrier to access the competences that are necessary to enjoy higher productivity and wage premia in the emerging digital paradigm.
The empirical analysis combines the Eurostat Labour Force Survey and the European Skills, Competences, Qualifications and Occupations data to compute an indicator of region-specific e-skill endowment for 103 European regions between 2003 and 2013. Within-region inequality measures are drawn from the European Statistics on Income and Living Conditions (Krell, Frick, and Grabka Citation2017). Using this panel dataset, we estimate the relationship between regional e-skill endowment and income inequality. To address possible endogeneity issues, we carry out two robustness analyses. First, we estimate the model using a difference GMM dynamic panel specification. Second, we use a two-stage instrumental variable approach, using lagged broadband internet take up rates in each region as an instrument for e-skills development.
The main finding is that there is a divergence in the direction of social returns. Regional income inequality (measured by the Gini index, Theil index and income ratios) increases with regional e-skill intensity for individuals with lower income levels. In contrast, among the more affluent residents in a region, we find that e-skills development reduces inequality levels in the region.
The remainder of the paper is organised as follows. The next section presents a brief literature review. Section 2 points out our theoretical framework. Section 3 details the key data sources and the construction of the variables. Sections 4 and 6 present the econometric methods and results, respectively. The last section summarises and discusses policy implications.
2. Literature
2.1. Income inequalities within regions
Building on extensive literature (Atkinson and Brandolini, 2009; Iacono and Ranaldi Citation2022; Tassaeva Citation2021) a recent meta-analysis (Furceri and Ostry, Citation2019) spells out a variety of robust predictors of income inequalities at country-level, namely: level of economic development, economic growth, demographics and age structure of population, macroeconomic policies, unemployment, institutions, and education and human capital. That said, income inequality is primarily studied at cross-country level but less so at sub-national scale. Some works focus on the US states (Fallah and Partridge Citation2007; Frank Citation2008; Panizza Citation2002; Partridge, Rickman, and Levernier Citation1996; Wu, Perloff, and Golan Citation2006) whereas others analyse inequalities within regions of European countries (e.g. Castells-Quintana, Ramos, and Royuela Citation2015; Galbraith and Garcilazo Citation2005; Perugini and Martino Citation2008; Rodriguez-Pose and Tselios Citation2009; Tselios Citation2008, Citation2014). By and large, this literature concurs that income inequalities have increased on average in the last decades both in the US and in Europe but differs in the identification of the causes.
Castells-Quintana, Ramos, and Royuela (Citation2015) analyse European regions for the period 1996–2011 and show that, although inequality within regions tends to be negatively associated with the region’s level of economic development, it is also positively associated with economic growth performance, and with specialisation in tradable services. Royuela, Veneri, and Ramos (Citation2019) investigate the relationships between inequalities and economic growth for more than 200 regions from 15 OECD countries for the period 2003–2013 and report a negative association between inequalities and economic growth. In particular, they find that the strength of this association depends on the structure of the regions, and that income inequalities are more (less) detrimental for economic growth in urban (rural) regions. Perugini and Martino (Citation2008) study a panel of European regions for the period 1995–2004 shows that income inequality is positively related to the levels of innovation activity and human capital in the regions. These factors are however moderated by the size of the welfare system, since fiscal and redistribution policies alleviate income inequalities.
A few studies delve into the relationship between income inequalities and human capital in European regions. Tselios (Citation2008) uses panel and cross-section spatial models to investigate the relationship between regional income inequalities and educational inequalities, while Tselios (Citation2014) uses a time series approach (vector autoregression models). Rodriguez-Pose and Tselios (Citation2009) consider a cross-section of European regions to investigate the drivers of regional income inequality and find that human capital is a relevant determinant of income inequalities within regions. The main finding is that of a positive relationship between educational and income inequalities within EU regions, albeit with remarkable heterogeneity moderated in part by different welfare regimes.
A common feature of most existing empirical research is the focus on the quantitative aspects of human capital in regions, measured for example by levels of educational attainment, and the neglect of qualitative characteristics such as the actual typologies of skills in the labour force. In the following subsection we argue that there is much to learn from opening the black box of the human know-how embedded in the workforce. In particular, we call attention to the skills that are associated with the ongoing process of digitalisation.
2.2. Digitalization and e-skills
The development and diffusion of Information and Communication Technologies (ICTs) stands at the root of the ongoing digitalisation. One of the distinctive features of this process is the growing ubiquity of ICTs which, owing to their general-purpose nature, found their way across domains as diverse as defence, banking, healthcare, manufacturing, education as well as agriculture, retail and recreation industries. The scholarly debate on the effects of ICTs diffusion is dominated by two stances. On the one hand, the view is that by improving access to information, these technologies yield substantial gains in terms of productivity (Brynjolfsson and Hitt Citation1996; Kretschmer Citation2012; Pilat Citation2005; Stiroh Citation2002; Triplett Citation1999), innovation (Antonelli Citation2001; Cardona, Kretschmer, and Strobel Citation2013; Freeman and Louça Citation2001) and economic growth (Brynjolfsson and McAfee Citation2014; Roller and Waverman Citation2001). Further, ICTs are known to trigger positive network effects (David Citation2001; Downes Citation2009) that lower barriers to entry and hinder rent-seeking behaviour (Antonelli and Gehringer Citation2017). In fact, despite well-documented gaps between the US and other advanced economies in the 1990s (Jorgenson Citation2001), the shift from component to content and application allowed countries and regions that invested in ICT-related infrastructure to leapfrog and catch up (Jorgenson and Vu Citation2016; Rückert, Cathles, and Nayyar Citation2020).
The other stance is that beneath the glare of success, ICTs’ diffusion did coincide with the exacerbation of disparities due to the emergence of new forms of inequality. In particular, efficiency gains in capital-producing sectors paved the way to structural changes in the form of capital-labour substitution since the late 1980s (Karabarbounis and Neiman Citation2014). In this self-reinforcing process, the expansion of ICTs magnified gaps in the returns to skill and education, with remarkable and sustained erosion of employment opportunities and real wages at the bottom end of the labour market (Autor Citation2014; Autor, Katz, and Krueger Citation1998; Galor and Moav Citation2000; Goldin and Katz Citation2007; Lemieux Citation2008; OECD Citation2015).
Clearly, the complexity of the uptake and evolution of the ICT infrastructure in a variety of specific domains defies simple explanations. A common thread emerging from the literature is the reorganisation of work towards ‘non-production’ activities that yield more opportunities and better returns to high-skilled workers – such as managers and professionals – to the detriment of middle- and low-skilled workers (Acemoglu and Autor Citation2014). Also, most agree that the extent of the negative distributional repercussions that can be ascribed to technology depends on unique features of the underlying infrastructure, namely economies of scale, network externalities and the fast pace of change in both using and producing sectors (Autor, Katz, and Kearney Citation2008; Bauer and Latzer Citation2016; Parayil Citation2005).
Because digital technologies and applications are so diverse and widespread, they call for appropriate know-how to successfully master an ever-expanding plethora of options. These are e-skills, namely capabilities required for researching, developing and designing, managing, producing, consulting, marketing and selling, integrating, installing and administrating, maintaining, supporting and service of ICT systems. Due to the far-reaching impact of digitalisation, the e-skills endowment of the workforce is crucial to regional economic development (Castellacci, Consoli, and Santoalha Citation2020). However, given the cumulative nature of digital skills development, and the fact that some workers have access to greater opportunities than others, there is a real risk that the benefits underlying digitalisation would accrue primarily to specific segments of the workforce (Poliquin Citation2020; Tewathia, Kamath, and Ilavarasan Citation2020).
The spread of ICTs and digitalisation in Europe exhibits persistent dissimilarities between and within countries (Lucendo-Monedero, Ruiz-Rodriguez, and Gonzalez-Relano Citation2019; Szeles Citation2018). Lera-Lopez and Billon-Curras (Citation2005) highlight the importance of regional policy mitigating the existing differences in terms of digitalisation at the EU level. In spite of much effort in studying the relationship between human capital and territorial inequalities, debates both in the scholarly and the policy EU communities pay little attention to digital literacy as a potential driver of regional income inequalities. Arguably, the path to better cohesion also needs the removal, or ability to prevent altogether, barriers to within-region disparities, and digital skills development – or the lack of thereof – is a source of these barriers. Given the paucity of evidence on whether and to what extent digitalisation in EU regions is associated with intra-regional income inequalities, the present paper fills a gap that is relevant given the rapid pace of the digital transition in European countries following the pledge that ‘everyone benefits from a digital dividend’ (European Commission, Citation2020b, p.2). The remainder will study the association between digitalisation in the workplace and income inequalities within EU regions.
3. Theory and research questions
E-skills can affect income inequalities through two distinct transmission mechanisms.
3.1. Digitalization and skill-biased technological change
According to the canonical model of skill-bias (Acemoglu and Autor Citation2011), new digital technologies trigger the divergence between skilled and unskilled workers in both employment opportunities and economic returns. According to Acemoglu and Restrepo (Citation2020), ICTs negatively affect the demand for employment and the wages of workers that perform routine-based tasks (displacement effect), while at the same time, creating benefits for non-routine tasks intensive jobs, e.g. in ICT-producing activities as well as in other sectors and occupations that rely heavily on ICTs (productivity effect). Skill-bias effects related to ICTs thus foster wage and income inequalities between routine- and non-routine workers. However, as the job polarisation literature points out (Autor and Dorn Citation2013; Goos, Manning, and Salomons Citation2014), while middle-skilled workers are negatively affected by routine-biased technical change because their tasks are relatively easier to automate, low-skilled occupations that carry out manual and pers. comm. tasks, in personal services activities, are less exposed to substitution. As a result, starting from the mid 1990s in the US and in the early 2000s in Europe, demand for middle-skilled workers has been observed to grow slower than demand for occupations at the two extremes of the income distribution (Acemoglu and Autor Citation2014).
Closer to home, the implication of the above is that regional income inequalities cannot easily be determined ex ante as they depend on the location-specific balance between high-, medium- and low-skill workers, and how these are affected by changes in labour demand and wages due to digitalisation.
3.2. E-skills and innovation
Digital skills are not only important for the efficient execution of existing tasks but also as innovation enablers. Specifically, e-skills facilitate access, imitation and recombination of external knowledge sources to create new products and services. The creative destruction associated to innovation cum digital skills presents two contrasting effects. On the one hand, innovations strengthen incumbents’ position and increase mark-ups thus exacerbating gaps between large incumbents and SMEs, which carries negative distributional outcomes for workers (Aghion et al. Citation2019). Economies of scale and network externalities related to ICTs augment such an effect in ICT-producing service sectors, especially when digital platforms are most prominent. On the other hand, ICT applications can enable entrepreneurship and entry in new markets for small firms and new ventures by lowering start-up costs and thereby reducing opportunity gaps between large incumbents and SMEs and, eventually, income inequalities among workers (Jones and Kim Citation2017).
Here, again, the overall effect of digital skills on regional inequalities through innovations cannot be postulated ex ante, as it depends on the sector-specific market structure in a region, on how innovations affect the relative position of incumbents versus SMEs in different markets, and on the resulting patterns of income inequalities for workers employed in the region’s firms.
In summary, a review of the literature on the main transmission mechanisms confirms that the relationship between e-skills and income inequalities is multifaceted. The expansion of digital skills may increase income inequalities if skill-bias effects dominate and result in greater wage and income dispersion in the region, and/or if innovations strengthen the position of oligopolistic incumbents vis-à-vis SMEs. By contrast, e-skills may decrease regional income inequalities if higher demand and wages for low-skilled compensate skill-bias effects, and/or if digital innovations foster ease of entry and profitability of new ventures and SMEs.
To gain further insights into this relationship, we propose that the association between workforce e-skills and within region income inequality differs along the spectrum of the income distribution. Accordingly, we expect digital skills to reduce inequalities in the top tiers of the distribution, as therein are high-skilled workers that perform non-routine tasks related to ICTs who will primarily benefit from digitalisation. Further, digital entrepreneurship and innovation open up technological and market opportunities for highly educated individuals in the upper part of the income distribution. In contrast, we expect the opposite in the bottom part of the distribution, namely that digitalisation increases income inequalities. At lower quantiles of the income distribution are typically workers who perform routine and low-skilled tasks and will confront significant costs related to digitalisation in terms of lower labour demand, unemployment and/or lower wages (displacement effect). Furthermore, positive effects of digital entrepreneurship as discussed above will plausibly be less likely among individuals with lower income and lower educational attainment relative to highly skilled individuals.
The remainder of the paper will put the above expectations to the test and explore empirically the association between e-skills endowment and regional inequalities in European regions.
4. Data and variables
4.1. Data sources
The empirical analysis relies on three main data sources. The dependent variables, measuring intra-regional income inequality, are built using the European Statistics on Income and Living Conditions (EU-SILC), which brings together and harmonise information on country level longitudinal micro data on households (Krell, Frick, and Grabka Citation2017). Information on households is regionalised, whenever possible, according to the NUTS-2 of residence at the time of the survey.
The main explanatory variable is the regional digital skills endowment. To build this, we combine information from the Eurostat Labour Force Survey (EU-LFS) and the European Skills/Competences, qualifications and Occupations (ESCO) databases (Castellacci, Consoli, and Santoalha Citation2020). This measure of digital skills of the workforce represents an original and valuable indicator that is able to mirror the degree of digitalisation of the regional workforce. In addition to the aforementioned sources (EU-SILC, EU-LFS and ESCO), we also rely on Eurostat regional statistics to build control variables. Our final dataset covers 103 regions (NUTS-1 or NUTS-2),Footnote1 in 22 European countries,Footnote2 for the period 2003–2013. The timespan covered in this analysis is the result of the combination of available data for the different data sources that we have used (no EU-SILC data available before 2003; and microdata available only up to 2013).
4.2. Dependent variables: income inequality within regions
Inequality manifests itself in numerous ways beyond income, for example consumption, or access to education and health. Different indicators have strengths and weaknesses, but they are often strongly correlated. For the purposes of the present study, we focus on income inequality measured by three alternative and complementary indicators (Carrascal-Incera et al. Citation2020; Royuela, Veneri, and Ramos Citation2019). Further, considering that digitalisation might be an opportunity or a threat depending on the income groups at stake, we are also interested in the relationship between digital skills of the labour force and income inequality at different portions of the regional income distribution. For each set of indicators, we thus compute the variables of interest considering both the whole-income distribution as well as the differences between lower and higher income levels.
The first dependent variable we use is the Gini index:
where GINIit represents the Gini coefficient of region i in year t, while EDI is the equivalised disposable income – the total household disposable incomeFootnote3 divided by the equivalised household size.Footnote4 As we compute all indicators weighting each household by its cross-sectional weights and by the household size, EDI represents the equivalised disposable income of a given individual in region i and year t. Regarding n, it corresponds to the total number of individuals in region i and year t. The subscripts x and z refer to individuals in region i and year t.
This indicator proposed by, derived from the Lorenz curve of income distribution (Lorenz Citation1905), can be defined as half of the relative mean of the absolute differences between the income levels of all existing pairs of individuals in a given society. Briefly, this measure reflects how concentrated or dispersed the income is within a given community. The indicator ranges between 0 and 1, where 0 represents the theoretical case of a society where all individuals are endowed with exactly the same income. Conversely, in situation of extreme inequality, the index is 1.
For our purposes, the Gini index is computed for different parts of the income distribution:
the whole-income distribution of a given region in a given year (GINIit);
the lower tail of the income distribution, where we only consider individuals with income below the median regional income in a given year (GINIit_low);
the upper tail of the income distribution, i.e. individuals with income equal to or above the median of the regional income in a given year (GINIit_high).
The second dependent variable we use is the ratio between different percentiles of the income distribution:
where Pkit_Phit represents the ratio between the kth and the hth percentiles of the equivalised disposable income in region i and year t, such that k > h. This indicator is by definition always greater than 1, and the margin by which it exceeds 1 indicates the times the k-th percentile of the income distribution is larger than the h-th percentile.
In the present study, and following a similar rationale of the Gini index, we compute ratios to capture inequalities in regional income distribution at large (P90it_P10it), as well as in the lower (P50it_P10it) and upper parts (P90it_P50it).
To further expand our inquiry and to ensure that our analysis is robust, not hinging on the use of specific measures of inequality, we also consider a third dependent variable to measure income inequality across households within each region. According to Carrascal-Incera et al. (Citation2020), dispersion measures of inequality are the only ones that are in line with the welfare axioms stated by Cowell (Citation2011), and they therefore provide a good measure of inequality. Thus, we use the Theil index, which is defined as follows:
such that
where THEILit represents the Theil coefficient in region i and year t, EDI represents the equivalised disposable income of a given individual x, in region i and year t. The total number of individuals in region i and year t is represented by n, while , represents the average individual income in region i and year t, as defined in Equationequation (4)
(4)
(4) . Briefly, the indicator, proposed by Theil (Citation1967) for information theory, represents a measure of entropy, which takes the value 0 when all individuals in a given society have the same income (equal to the average income) thus being the case of perfect equality. Conversely, the higher the value of the index, the higher inequality within the society.
As in the previous indicators, we compute Theil for different parts of the regional income distribution, namely all individuals that are within a region, regardless their income level (THEIL), those individuals with income equal to or above the median of the regional income in a given year (THEILit_high) and those whose income is below the median regional income (Theilit_low).
show the geographical distribution of the indicators that we will use as dependent variables in our analysis: Gini coefficients, income ratios, and Theil indexes. Each figure reports the pattern referring to the whole-income distribution of each region, then the high-income part, and further below the low-income part. For all indicators, on average during the time span under analysis, income inequalities are higher in Southern and Eastern Europe regions relative to Continental and Nordic European ones. reports the rate of change of these variables during the period 2003–2013. Income inequalities within regions have on average increased (see Gini, income ratios and Theil indicators), although this general trend is the result of two quite distinct patterns: inequalities increased substantially in the low-income part of the distribution, whereas they slightly decrease for Gini and income ratios and slightly increased for Theil in the upper quantiles (although the increase in the upper quantiles of income for Theil is less than half of the increase in the lower quantiles).
Figure 1. Average of the Gini coefficients in European regions (2003–2013).
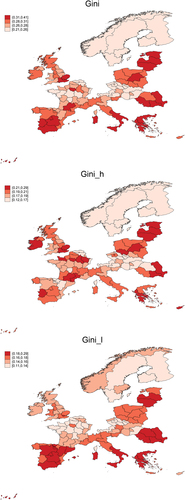
Figure 2. Average of the income ratios in European regions (2003–2013).
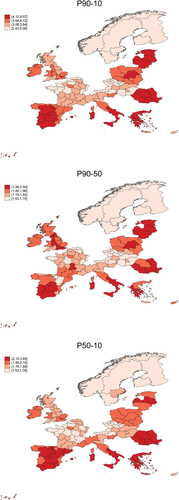
Figure 3. Average of the Theil index in European regions (2003–2013).
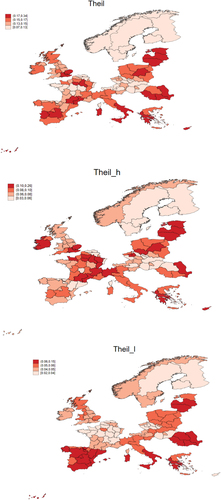
Table 1. Time trend of the income inequality and e-skills variables (average change from 2003 to 2013, %).
4.3. Explanatory variable: e-skills
Human capital is a multi-faceted and dynamic process that is best analysed by accounting for both quantitative and qualitative characteristics. Other than focusing on ‘how much’ human capital is needed to drive productivity and competitiveness, we consider ‘what’ type’ of human capital matters in the face of specific opportunities and challenges posed by movements of the technology frontier. A way to operationalise this is to focus on work tasks. Briefly, using occupations as unit of analysis, one can think of occupation-specific tasks and workers’ skills as vectors of desirable characteristics to fulfil job duties. Thereby in aggregate, the structure of employment is a proxy of the knowledge mix that is relevant in a particular context (i.e. industrial sector or geographical region). What is more, as industry or regional needs change, occupations evolve and so do working tasks and the relevant skill mix (Vona and Consoli Citation2015). Accordingly, we expect that looking at workers’ skills directly provides a more direct measure of individual engagement with the tools of the job, namely the use, adaptation and design of digital technologies.
To this end, we use employment data from Eurostat European Union Labour Force Survey (EU LFS). Occupations are coded by one-digit International Standard Classification of Occupations (ISCO-2008) codes. The main source of information on the e-skill Task Intensity index is the first release of the European Classification of Skills/Competences, Qualifications and Occupations (ESCO) by the European Commission (Citation2013). Following the procedure detailed in Castellacci, Consoli, and Santoalha (Citation2020), we identify job-specific competences that are associated with the use of digital technologies, or e-skills, on the basis of textual description in ESCO (for further details see the appendix).Footnote5
E-skills are matched with 4-digit ISCO occupations when the job entails one or more digital competences. The occupational intensity of e-skills is computed as the sum of e-skills weighed by the number of 4-digit jobs under each 1-digit level ISCO category:
ESKILLS is the number of e-skills identified in the description of each 4-digit occupational category within each 1-digit occupational category j. Pj is the total number of 4-digit occupational groups y within each 1-digit occupational group j. Finally, ESKILLS_OCC is the average number of e-skills in each 4-digit occupation within any 1-digit occupation j. Subsequently, ESKILLS_OCC is standardised to have a zero mean and unit standard deviation across 1-digit occupations. To measure task intensity at the level of NUTS-1 or NUTS-2 in a given year, we compute for each region i and year t an employment-share weighted index across all occupations j:
STD_ESKILLS is the standardised version of the variable described in (5), while ShareOccup represents the share of the labour force in 1-digit occupation j in region i and year t. REG_ESKILLS is the intensity of e-skills in the labour force of region i in year t. This is the main explanatory variable in the analysis of the relationship between e-skill endowment in the local labour force and income inequality in European regions.
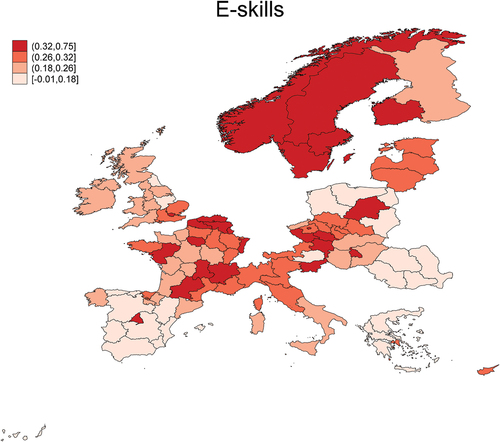
shows that on average across European regions the rate of change of e-skills during the period 2003–2013. reports the geographical distribution of the digital skills indicator. During the time span 2003–2013, e-skills are on average stronger in regions in Continental and Nordic European economies, and substantially lower Southern and Eastern European regions, where the process of digitalisation started later and slower relative to other European countries.
Figure 4. Average of the e-skills variable in European regions (2003–2013).
4.4. Control variables
Following previous research on regional income inequalities (see section 2.1), the econometric model includes a battery of additional control variables: the regional level of human capital (persons with tertiary education and/or employed in science and technology as a share of the total population), the unemployment rate, the regional level of economic development (gross domestic product (GDP) measured in purchasing power standards (PPS) per inhabitant), the age structure (percentage of the population older than 65 years) and the gender structure of the workforce (share of female workers). In an additional robustness check, we also control for the share of employees in the manufacturing sector in each region to control for the distribution of the workforce across sectors and the industrial specialisation of each region.Footnote6 All variables are collected from the Eurostat regional statistics and from the Eurostat Labour Force Survey.
reports the summary statistics of all the variables that are used in the econometric analysis. The dataset contains 799 observations. The correlation matrix is presented in . Most correlation coefficients range from relatively low to moderate. One of the few exceptions concerns the correlation between different versions of the same indicator (e.g. P90_P10 and P50_10). This is obviously not a problem, though, because these indicators will be used as alternative dependent variables in different econometric specifications. The correlation coefficients are also relatively high among the two variables measuring human capital and e-skills, as well as between GDP per capita and e-skills, and GDP per capita and human capital.
Table 2. Descriptive statistics for all variables.
Table 3. Correlation matrix for all variables.
Some of the correlation coefficients between some of the explanatory variables may possibly raise multicollinearity issues in the regression analysis. To check for multicollinearity, we implement the Variance Inflation Factor (VIF) test (). The VIF for every variable is relatively low, which means that multicollinearity problems is unlikely to affect our analysis.Footnote7 However, as highlighted in the correlation matrix, human capital and GDP per capita exhibit the highest VIF, 3.20 and 2.71, respectively. Although these values do not imply possible multicollinearity issues, below we perform an additional robustness check to make sure that these two variables do not bias our estimations.
Table 4. Multicollinearity test VIF (Variance Inflation Factor).
5. Econometric methods
We estimate the following baseline model specification:
where i indicates the region, and t the year. The dependent variable INEQ_POV denotes measures of income inequality. As noted in the previous section, the dependent variable is measured by using 9 different indicators, which we will use in different model specifications: GINI, GINI_h, GINI_l, P90–10, P50–10, P90–50, THEIL, THEIL_l, and THEIL_h. The indicator REG_ESKILLS is the main explanatory variable of interest as defined in (6). Since the effects of digitalisation in society do arguably take some time to manifest, we use a 5-year lag for the e-skill variable.Footnote8 The use of this lag also minimises potential endogeneity issues (which we discuss further below) and rules out the possible existence of reverse causality between the dependent variables and the main explanatory variable of interest. Z denotes the vector of k lagged control variables noted in the previous section (log-transformed). ηi denotes the set of region fixed effects, θt the set of time fixed effects (a dummy for each time period), and ε is the error term. We estimate this model by OLS, with robust standard errors, on the panel of 799 region-years noted above.
One issue in the estimation of this model is the possible endogeneity of the e-skills variable. Although we use in the regressions a 5-year lag and add a number of standard control variables and region fixed effects, we cannot rule out the possibility that some unobserved factors could affect both e-skill development as well as income inequalities, thus confounding the causal effect of our interest. To further mitigate this potential issue, we carry out two additional robustness exercises.
First, we estimate Equationequation (7)(7)
(7) as a dynamic panel model. To do so, we estimate the relevant coefficients using the General Method of Moments (GMM), following Arellano and Bond (Citation1991) difference GMM approach (Diff-GMM). We implement it through the Stata xtabond2 command, and in line with Roodman (Citation2009). The Diff-GMM estimation considers all explanatory variables as potentially endogenous, and uses second and third-lags to instrument the endogenous variables.
The second robustness exercise is based on a two-step instrumental variable approach to account for exogenous variation correlated with the treatment variable e-skills but uncorrelated with the error term of the outcome equation. The instrumental variable used here is the broadband Internet take up rates in each region (log-transformed and lagged five years vis-à-vis the instrumented variable e-skills). The basic idea of this identification strategy is that the development of e-skills of the workforce depends, among other factors, on the availability of Internet infrastructures, which provide the key platform to carry out digital activities, working tasks and skill development.
Specifically, we exploit differences in broadband take-up across European regions as a source of exogenous variation. In the 2000s, the EU designed a policy framework to promote access and use of broadband Internet, but the degree and effectiveness of Member States’ implementation plans have been quite different. The supply of broadband infrastructures is affected by national regulation and competition policies that define entry costs and investment rates of telecommunication firms. Supply-side factors also matter and pre-existing phone and Internet infrastructures, which affect the pace at which broadband transmission centrals and local access points are built up in different regions (Castellacci, Schwabe, and Proto Citation2020). As a result, cross-regional differences in broadband adoption have been considerable. Online appendix 2 (see supplemental online material) shows the distribution of broadband Internet take-up across regions in Europe, and its evolution during the time span 2006–2013. Using this source of variation to identify the causal effects of e-skills on income inequality relies on two assumptions. First, that the timing of the broadband Internet expansion (lagged five years) does not co-vary with other factors that are correlated with the outcome variable income inequalities. Second, that our instrumental variable affects regional inequalities only through e-skill development and that it is therefore uncorrelated with any possible unobserved determinant of income inequalities within regions. In the instrumental variable estimations, we take lagged values of the instrument (five year lagged) to ensure that it predates the outcome variable, and it is thus uncorrelated with common region-year shocks. We will discuss further these assumptions in the next section.
6. Results
Baseline fixed effects regression results are reported in . The table is divided in three parts. The first refers to the entire income distribution, the second shows the upper part of the income distribution, while the third subset of results concerns the lower tiers of income distribution. For each, we consider first the unconditional relationship between each dependent variable and the main explanatory variable e-skills (columns (1)-(3), (7)-(9) and (13)-(15)), and then report the same regressions with the full battery of control variables: human capital, unemployment, GDP per capita, elderly population and female workers (columns (4)-(6), (10)-(12) and (14)-(16)). As noted above, all regressions include region fixed effects to account for unobserved region-specific characteristics, as well as time fixed effects.
Table 5. Regression results: Fixed effects estimations.
Starting from the entire income distribution, we find a negative relationship between regional e-skills endowment and income inequalities (as per Gini and Theil indexes) within regions. However, when we run regressions using income decile ratios as dependent variable, we find no significant association between regional e-skills endowment and the ratio between the 90th and the 10th percentiles. As noted in section 2, though, the association between e-skills endowment and within-region income inequality can be arguably ascribed to several contrasting mechanisms that may affect parts of the income distribution differently (e.g. Autor, Katz, and Kearney Citation2008). It is therefore interesting to investigate whether the relationship between digital skills and income inequality differs for distinct income groups. Indeed, the results reported on the right-hand side of the table point to substantial heterogeneity.
The negative correlation between e-skills and measures of income inequality within regions holds only for the portion of regional population with income equal to or above the median regional income. In contrast, the correlation turns positive and significant for those in the lower tail of the income distribution. The size of this effect in the upper tail is larger than the corresponding magnitude for those at the middle- and bottom-end. This is relevant because it suggests that the beneficial effects of skill digitalisation of the workforce are mostly concentrated among wealthier members of society who enjoy overall better living conditions and have easier access to digital technologies. By contrast, higher levels of e-literacy in the workforce associate with increasing income disparities among low-income groups, because many workers in traditional occupations and carrying out routine tasks are negatively affected by reductions in labour demand and wages related to digitalisation processes.
reports results of estimations of a similar model that does not include human capital and GDP per capita as control variables. As discussed in section 4, it may be argued that these two variables are highly correlated with the e-skills variable, which might raise concerns of multicollinearity. However, the results in confirm that this is not the case. Although the statistical significance and magnitude of some of the coefficients of interest change slightly, most results are in line with the patterns shown in .
Table 6. Regression Results: Fixed effects estimations without human capital and GDP per capita as control variables.
To consider potential endogeneity problems, shows difference GMM regression results (dynamic panel model specification). When we consider the entire income distribution, regardless the indicator used as dependent variable, the coefficient of e-skills is not statistically significant. However, when we contrast the upper part of the income distribution with the lower tail of the income distribution, we find again diverging patterns regarding the role of e-skills on income inequality. Specifically, for higher-income groups, the estimated coefficient of e-skills is negative and statistically significant for the Gini index and the 90–50 income ratio. By contrast, for the lower part of the income distribution, the coefficient of e-skills is positive and significant when the dependent variable is the 50–10 income ratio. However, the same coefficient is not significant when the dependent variable is the Gini or the Theil index. Briefly, the results in corroborate the role of digital skills for mitigating inequalities among the higher-income groups, while also indicating that digital skills are either non-significant or positively associated with income inequality among those with lower levels of income.
Table 7. Regression Results: Difference GMM Estimations.
Finally, reports the results of our two-step instrumental variable estimations that use (5-year lagged) broadband take up rates as an instrument for e-skills. The first stage confirms a positive and significant correlation between (lagged) regional broadband deployment and digital skills development. Regarding the second-stage estimations, the estimated coefficient of e-skills is negative and significant for the Gini and Theil index-dependent variables. The effect is again negative for the upper tail of the income distribution for all dependent variables, but mostly not significant for the regressions focusing on the lower tail of the distribution.Footnote9
Table 8. Regression Results: Two-stage Instrumental Variable Estimations.
In summary, we find that the relationship between digital skills development and income inequalities within EU regions varies significantly along the gradient of inequality. In particular, digitalisation is a predictor of divergent social returns between more and less affluent residents of a territory. Thereby, income inequality (as per Gini index, income ratios or Theil index) in a region does on average increase for individuals with lower income levels in response to an increase in the regional intensity of e-skills (although this pattern is not significant in some of the specifications and should therefore be taken with some caution). On the other hand, in the upper part of the regional income distribution inequality does systematically decrease the higher the intensity of e-skills in the workforce.
7. Concluding remarks
The advent of digitalisation carries far-reaching social and economic consequences. While some of these have been widely investigated, there is a paucity of evidence on the relationship between digitalisation and income inequalities within regions. This paper has filled this gap by elaborating an empirical analysis of the relationship between e-skills endowment in the workforce and various measures of income inequality in European regions.
Our results show that the direction of this correlation exhibits substantial heterogeneity among different income groups. An increase in the levels of e-skills of the workforce is related to lower inequalities for higher-income groups. Conversely, for lower income groups, there is a positive relationship between the degree of the digitalisation of the workforce and economic inequalities. This means that an increase in the level of e-skills coincides with higher inequality among the poorest population groups. The reason for this contrasting pattern is twofold. First, digital competencies development is skill-biased whereby it increases demand and wages for highly educated workers performing non-routine working tasks while, at the same time, it reduces opportunities for less educated workers in routine intensive jobs. Second, e-skill development fosters digital entrepreneurship and innovation, which tend to further exacerbate differences in profitability among firms as well as wage differentials among workers in different firms and sectors.
These findings provide new and important evidence for European regions and resonate with empirical studies suggesting that ICTs magnify social inequalities, given that the most skilled, educated and economically well-off are those that are more likely to access ICTs and take advantage of the opportunities opened-up by digitalisation (Tewathia, Kamath, and Ilavarasan Citation2020). Although the focus of the present paper is on within-regions inequalities, the dimension of cross-regional convergence should not be neglected. Both dimensions of regional cohesion are relevant, and they should be jointly investigated in future research.
EU innovation policies are increasingly informed by a place-based approach whereby regions are expected to play a leading role in both the design and application of the associated plans (Gianelle et al. Citation2020). Against this backdrop, the European Commission pursues the consolidation of the digital infrastructure as a tool to unleash untapped potential and achieve higher competitiveness, ideally across all regions (European Commission, Citation2020b). Although inclusiveness is a pillar of this process, the evidence presented here indicates that digitalisation can carry unintended negative outcomes for equality within these territories, with potentially far-reaching drawbacks for social cohesion.
Our findings carry implications for policy. In particular, they call attention to the need of update or implement training schemes for less skilled workers to mitigate the risk that deepening digitalisation undermines the objectives such as equality and social cohesion. The adoption of a policy-mix that complements digitalisation actions with other policies that neutralise the socially harmful effects of digitalisation may be a route to address social concerns underlying the uneven diffusion and utilisation of ICTs. In turn, the Smart Specialization Policy framework might consider the possible integration of mechanisms to anticipate likely harmful and untended effects of innovations and technological developments in regional economies. For instance, following the place-based and bottom-up ethos of Smart Specialization, it would be desirable that these policies were designed and implemented around the specificities of territories, to the extent possible. We hope that future research will continue to explore these pressing issues.
Supplemental Material
Download Rich Text Format File (5.7 MB)Disclosure statement
No potential conflict of interest was reported by the authors.
Supplemental data
Supplemental data for this article can be accessed online at https://doi.org/10.1080/13662716.2023.2230222
Additional information
Funding
Notes
1 NUTS-2 regional identifiers are only available in three countries: Czech Republic, France and Spain. In all other countries considered in the analysis, only NUTS-1 identifiers are available.
2 Austria, Belgium, Cyprus, Czech Republic, Estonia, Finland, France, Greece, Hungary, Ireland, Italy, Latvia, Lithuania, Luxembourg, Norway, Poland, Romania, Sweden, Slovenia, Slovakia, Spain, and United Kingdom.
3 The annual disposable income of a given household refers to the total income of the household from all income sources, including social transfers, net of taxes and social security contributions due by the household.
4 For the computation of household size, Eurostat attributes a given weight to each member of the household. The weight of the first adult of the household is 1, the weight of each one of the other individuals that are 14 years old or older is 0.5, while for household members under 14 their weight is 0.3.
5 The main limitation of this method is that the skill scores are subjective assessments. This is a widely debated issue in the labour economics literature (see e.g. Autor etal., Citation2003).
6 We did not include this variable in the baseline specification because the EU LFS database has missing observations for the NACE code of the local unit where each individual is employed, which may lead to under- or overestimation for some years and regions. Moreover, data are missing for 2009 and 2010. Thus, in using this variable as an additional control, we are unable to use some years included in our annual panel.
7 As a rule of thumb, VIF statistics below 10 indicate that econometric estimations are unlikely to suffer from multicollinearity problems.
8 We perform robustness checks for shorter and longer lags. Although the results reveal themselves to be robust to the application of other lags, the lag of 5 years seems to be the most adequate and it can be seen as a compromise longer and shorter lags. On the one hand, with much longer lags (e.g. 10 years) the two phenomena that we are measuring become too distant in time: the estimated effect becomes less significant, as it might be challenging to establish any causality between the two variables under investigation. Moreover, our sample also becomes shorter as we increase the time lags, due to the limited timespan for which the EU SILC database is available. On the other hand, with shorter lags the risk is that there is not enough time for the effects of digitalisation to become visible, as labour markets need time to adjust to these transformations.
9 We also carried out placebo tests to assess whether broadband take-up at year t + 5 (i.e. five years after the time at which e-skills are measured) affects income inequalities. The results of these tests are not reported here but are available upon request. We expect that future broadband take-up variable will not be significant in these placebo estimations, ruling out the possibility that our results are driven by some omitted variables that are related to both broadband Internet expansion and income inequalities. This is the case for the estimations on the upper tail of the income distribution but not for the lower income groups. A possible reason for this may be that geographical factors and topological characteristics of regions affect broadband infrastructures development, while at the same time being related to the urban-rural divide, and hence to income inequalities. The placebo tests for the low-income part of the distribution suggest that these factors might affect our findings for the low-income tail of the distribution but not for the high-income part.
References
- Acemoglu, D., and D. Autor. 2011. “Skills, Tasks and Technologies: Implications for Employment and Earnings.” In Handbook of Labor Economics, Vol. 4, 1043–1171. Elsevier.
- Acemoglu, D., and P. Restrepo. 2020. “Robots and Jobs: Evidence from US Labor Markets.” Journal of Political Economy 128 (6): 2188–2244. https://doi.org/10.1086/705716.
- Aghion, P., U. Akcigit, A. Bergeaud, R. Blundell, and D. Hemous. 2019. “Innovation and Top Income Inequality.” Review of Economic Studies 86 (1): 1–45. https://doi.org/10.1093/restud/rdy027.
- Antonelli, C. 2001. The Microeconomics of Technological Systems. Oxford: Oxford University Press.
- Antonelli, C., and A. Gehringer. 2017. “Technological Change, Rent and Income Inequalities: A Schumpeterian Approach.” Technological Forecasting and Social Change 115:85–98. https://doi.org/10.1016/j.techfore.2016.09.023.
- Arellano, M., and S. Bond. 1991. “Some Tests of Specification for Panel Data: Monte Carlo Evidence and an Application to Employment Equations.” The Review of Economic Studies 58 (2): 277–297. https://doi.org/10.2307/2297968.
- Autor, D. H. 2014. “Skills, Education, and the Rise of Earnings Inequality Among the “Other 99 percent”.” Science: Advanced Materials and Devices 344 (6186): 843–851. https://doi.org/10.1126/science.1251868.
- Autor, D. H., and D. Dorn. 2013. “The Growth of Low-Skill Service Jobs and the Polarization of the US Labor Market.” The American Economic Review 103 (5): 1553–1597. https://doi.org/10.1257/aer.103.5.1553.
- Autor, D. H., L. F. Katz, and M. S. Kearney. 2008. “Trends in US Wage Inequality: Revising the Revisionists.” The Review of Economics and Statistics 90 (2): 300–323. https://doi.org/10.1162/rest.90.2.300.
- Autor, D. H., L. F. Katz, and A. B. Krueger. 1998. “Computing Inequality: Have Computers Changed the Labor Market?” The Quarterly Journal of Economics 113 (4): 1169–1213. https://doi.org/10.1162/003355398555874.
- Bachtler, J., and G. Gorzelak. 2007. “Reforming EU Cohesion Policy.” Policy Studies 28 (4): 309–326. https://doi.org/10.1080/01442870701640682.
- Bauer, J. M., and M. Latzer, Eds. 2016. Handbook on the Economics of the Internet. Edward Elgar Publishing.
- Brynjolfsson, E., and L. Hitt. 1996. “Paradox Lost? Firm-Level Evidence on the Returns to Information Systems Spending.” Management Science 42 (4): 541–558. https://doi.org/10.1287/mnsc.42.4.541.
- Brynjolfsson, E., and A. McAfee. 2014. The Second Machine Age: Work, Progress, and Prosperity in a Time of Brilliant Technologies. WW Norton & Company.
- Cardona, M., T. Kretschmer, and T. Strobel. 2013. “ICT and Productivity: Conclusions from the Empirical Literature.” Information Economics and Policy 25 (3): 109–125. https://doi.org/10.1016/j.infoecopol.2012.12.002.
- Carrascal-Incera, A., P. McCann, R. Ortega-Argilés, and A. Rodríguez-Pose. 2020. UK Interregional Inequality in a Historical and International Comparative Context, National Institute Economic Review, 4–17. Vol. 253. Cambridge: Cambridge University Press.
- Castellacci, F., D. Consoli, and A. Santoalha. 2020. “The Role of E-Skills in Technological Diversification in European Regions.” Regional Studies 54 (8): 1123–1135. https://doi.org/10.1080/00343404.2019.1681585.
- Castellacci, F., H. Schwabe, and E. Proto. 2020. “Internet, Unmet Aspirations and the U-Shape of Life.” PLoS One 15 (6): e0233099. https://doi.org/10.1371/journal.pone.0233099.
- Castells-Quintana, D., R. Ramos, and V. Royuela. 2015. “Ungleichheit in Europäischen Regionen: Letzte Trends und Determinanten.” Review of Regional Research 35 (2): 123–146. https://doi.org/10.1007/s10037-015-0098-4.
- Charron, N. 2016. “Diverging Cohesion? Globalisation, State Capacity and Regional Inequalities within and Across European Countries.” European Urban and Regional Studies 23 (3): 355–373. https://doi.org/10.1177/0969776413512844.
- Cowell, F. 2011. Measuring Inequality. Oxford: Oxford University Press.
- David, P. A. 2001. “Productivity Growth Prospects and the New Economy in Historical Perspective.” EIB Papers 6 (1).
- Di Maggio, P., E. Hargittai, C. Celeste, and S. Shafer. 2004. “Digital inequality: From unequal access to differential use.” In Social Inequality, edited by K. M. Neckerman, 449–566. New York: Russell Sage Foundation.
- Downes, L. 2009. The Laws of Disruption: Harnessing the New Forces That Govern Life and Business in the Digital Age. New York: Basic Books.
- Dunford, M. 2005. “Policy Debates.” Regional Studies 39 (7): 972–978. https://doi.org/10.1080/00343400500290034.
- European Commission 2020b Shaping the Digital Transformation in Europe. Report DG Communications Networks, Content & Technology.
- Fallah, B. N., and M. Partridge. 2007. “The Elusive Inequality-Economic Growth Relationship: Are There Differences Between Cities and the Countryside?” The Annals of Regional Science 41 (2): 375–400. https://doi.org/10.1007/s00168-006-0106-2.
- Frank, M. W. 2008. “Inequality and Growth in the United States: Evidence from a New State-Level Panel of Income Inequality Measures.” Economic Inquiry 47 (1): 55–68. https://doi.org/10.1111/j.1465-7295.2008.00122.x.
- Freeman, C., and F. Louça. 2001. As Time Goes By. From the Industrial Revolutions to the Information Revolution. Oxford University Press. https://doi.org/10.1093/0199251053.001.0001.
- Furceri, D., and J. Ostry. 2019. “Robust Determinants of Income Inequality.” Oxford Review of Economic Policy 35 (3): 490–517.
- Galbraith, J., and E. Garcilazo. 2005. “Pay Inequality in Europe 1995-2000: Convergence Between Countries and Stability Inside.” The European Journal of Comparative Economics 2 (2): 139.
- Galor, O., and O. Moav. 2000. “Ability-Biased Technological Transition, Wage Inequality, and Economic Growth.” The Quarterly Journal of Economics 115 (2): 469–497. https://doi.org/10.1162/003355300554827.
- Gianelle, C., D. Kyriakou, P. McCann, and K. Morgan. 2020. “Smart Specialisation on the Move: Reflections on Six Years of Implementation and Prospects for the Future.” Regional Studies 54 (10): 1323–1327. https://doi.org/10.1080/00343404.2020.1817364.
- Goldin, C., and L. F. Katz 2007. “The Race Between Education and Technology: The Evolution of US Educational Wage Differentials, 1890 to 2005.” National Bureau of Economic Research, Paper No. w12984.
- Goos, M., A. Manning, and A. Salomons. 2014. “Explaining Job Polarization: Routine-Biased Technological Change and Offshoring.” American Economic Review 104 (8): 2509–2526. https://doi.org/10.1257/aer.104.8.2509.
- Iacono, R., and M. Ranaldi. 2022. “The Evolution of Income Composition Inequality in Italy, 1989–2016.” Review of Income and Wealth 69 (1): 124–149. https://doi.org/10.1111/roiw.12555.
- Iammarino, S., A. Rodríguez-Pose, and M. Storper. 2019. “Regional Inequality in Europe: Evidence, Theory and Policy Implications.” Journal of Economic Geography 19 (2): 273–298. https://doi.org/10.1093/jeg/lby021.
- Iammarino, S., A. Rodríguez-Pose, M. Storper, and A. Diemer 2020. Falling into the Middle-Income Trap? A Study on the Risks for EU Regions to Be Caught in a Middle-Income Trap. European Commission Report.
- Jones, C., and J. Kim. 2017. “A Schumpeterian Model of Top Income Inequality.” Journal of Political Economy 126 (5): 1785–1826. https://doi.org/10.1086/699190.
- Jorgenson, D. W. 2001. “Information Technology and the U.S. Economy.” American Economic Review 91 (1): 1–32. https://doi.org/10.1257/aer.91.1.1.
- Jorgenson, D. W., and K. M. Vu. 2016. “The ICT Revolution, World Economic Growth, and Policy Issues.” Telecommunications Policy 40 (5): 383–397. https://doi.org/10.1016/j.telpol.2016.01.002.
- Karabarbounis, L., and B. Neiman. 2014. “The Global Decline of the Labor Share.” The Quarterly Journal of Economics 129 (1): 61–103. https://doi.org/10.1093/qje/qjt032.
- Krell, K., J. Frick, and M. Grabka. 2017. “Measuring the Consistency of Cross-Sectional and Longitudinal Income Information in EU-SILC.” Review of Income and Wealth 63 (1): 30–52. https://doi.org/10.1111/roiw.12202.
- Kretschmer, T. 2012. “Information and Communication Technologies and Productivity Growth: A Survey of the Literature.” OECD Digital Economy Papers, no. 195.
- Lemieux, T. 2008. “The Changing Nature of Wage Inequality.” Journal of Population Economics 21 (1): 21–48. https://doi.org/10.1007/s00148-007-0169-0.
- Lera-Lopez, F., and M. Billon-Curras. 2005. “Shortfalls and Inequalities in the Development of E-Economy in the E.U.-15.” Communications & Strategies 60 (4): 181–200.
- Lorenz, M. O. 1905. “Methods of Measuring the Concentration of Wealth.” Publications of the American Statistical Association 9 (70): 209–219. https://doi.org/10.1080/15225437.1905.10503443.
- Lucendo-Monedero, L., F. Ruiz-Rodriguez, and R. Gonzalez-Relano. 2019. “Measuring the Digital Divide at Regional Level. A Spatial Analysis of the Inequalities in Digital Development of Households and Individuals in Europe.” Telematics and Informatics 41:197–217. https://doi.org/10.1016/j.tele.2019.05.002.
- OECD. 2015. “Non-Standard Work, Job Polarisation and Inequality.” In It Together: Why Less Inequality Benefits All. Paris: OECD Publishing.
- Panizza, U. 2002. “Income Inequality and Economic Growth: Evidence from American Data.” Journal of Economic Growth 7 (1): 25–41. https://doi.org/10.1023/A:1013414509803.
- Parayil, G. 2005. “The Digital Divide and Increasing Returns: Contradictions of Informational Capitalism.” The Information Society 21 (1): 41–51. https://doi.org/10.1080/01972240590895900.
- Partridge, M. D., D. S. Rickman, and W. Levernier. 1996. “Trends in US Income Inequality: Evidence from a Panel of States.” The Quarterly Review of Economics & Finance 36 (1): 17–37. https://doi.org/10.1016/S1062-9769(96)90027-7.
- Perugini, C., and G. Martino. 2008. “Income Inequality within European Regions: Determinants and Effects on Growth.” Review of Income and Wealth 54 (3): 373–406. https://doi.org/10.1111/j.1475-4991.2008.00280.x.
- Pilat, D. 2005. The ICT Productivity Paradox: Insights from Micro Data. Paris: OECD Economic Studies.
- Poliquin, C. 2020. “The Effect of the Internet on Wages.” Working Paper, Los Angeles: University of California.
- Rodriguez-Pose, A., and V. Tselios. 2009. “Education and Income Inequality in the Regions of the European Union.” Journal of Regional Science 49 (3): 411–437. https://doi.org/10.1111/j.1467-9787.2008.00602.x.
- Roller, L. H., and L. Waverman. 2001. “Telecommunications Infrastructure and Economic Development: A Simultaneous Approach.” American Economic Review 91 (4): 909–923. https://doi.org/10.1257/aer.91.4.909.
- Roodman, D. 2009. “How to Do Xtabond2: An Introduction to Difference and System GMM in Stata.” The Stata Journal 9 (1): 86–136. https://doi.org/10.1177/1536867X0900900106.
- Royuela, V., P. Veneri, and R. Ramos. 2019. “The Short-Run Relationship Between Inequality and Growth: Evidence from OECD Regions During the Great Recession.” Regional Studies 53 (4): 574–586. https://doi.org/10.1080/00343404.2018.1476752.
- Rückert, D., A. Cathles, and G. Nayyar 2020. “Digital Technologies and Firm Performance: Evidence from Europe.” European Investment Bank Paper Series.
- Stiroh, K. J. 2002. “Are ICT Spillovers Driving the New Economy?” Review of Income and Wealth 48 (1): 33–57. https://doi.org/10.1111/1475-4991.00039.
- Szeles, M. 2018. “New Insights from a Multilevel Approach to the Regional Digital Divide in the European Union.” Telecommunications Policy 42 (6): 452–463. https://doi.org/10.1016/j.telpol.2018.03.007.
- Tassaeva, I. V. 2021. “The Changing Education Distribution and Income Inequality in Great Britain.” Review of Income and Wealth 67 (3): 659–683. https://doi.org/10.1111/roiw.12486.
- Tewathia, N., A. Kamath, and P. Ilavarasan. 2020. “Social Inequalities, Fundamental Inequities, and Recurring of the Digital Divide: Insights from India.” Technology in Society 61:61. https://doi.org/10.1016/j.techsoc.2020.101251.
- Theil, H. 1967. Economics and Information Theory. Amsterdam: North-Holland Publishing Company.
- Triplett, J. 1999. “Economics and Statistics, the New Economy and the Productivity Slowdown.” Business Economics 34 (2): 13–17.
- Tselios, V. 2008. “Income and Educational Inequalities in the Regions of the European Union: Geographical Spillovers Under Welfare State Restrictions.” Papers in Regional Science 87 (3): 403–430. https://doi.org/10.1111/j.1435-5957.2008.00191.x.
- Tselios, V. 2014. “The Granger-Causality Between Income and Educational Inequality: A Spatial Cross-Regressive VAR Framework.” The Annals of Regional Science 53 (1): 221–243. https://doi.org/10.1007/s00168-014-0626-0.
- Vona, F., and D. Consoli. 2015. “Innovation and Skill Dynamics: A Life-Cycle Approach.” Industrial and Corporate Change 24 (6): 1393–1415. https://doi.org/10.1093/icc/dtu028.
- Wu, X., J. M. Perloff, and A. Golan. 2006. “Effects of Government Policies on Urban and Rural Income Inequality.” Review of Income and Wealth 52 (2): 213–235. https://doi.org/10.1111/j.1475-4991.2006.00185.x.