
Abstract
In a crisis situation, communication is an important asset for safeguarding the reputation of an organization. The communication strategy that is used in a crisis influences the way people perceive the crisis. While extensive research is conducted and clear communication guidelines about crisis communication are provided, current research tends to focus on a single actor in a crisis within a homogeneous stakeholder group. In this article, we analyze whether and how different groups of stakeholders frame a crisis and the extent to which they attribute responsibility for the crisis to actors. The case concerns the use of an illegal lice detergent (fipronil) in eggs in the Netherlands in the summer of 2017. Based on the analysis of Twitter data related to the case using multiple methods (network analysis, a longitudinal analysis and the annotation of a sample of tweets), this study shows that a seemingly simple case in a single sub-arena has different subgroups that use different frames and attribute different responsibilities to different stakeholders. This result implies that a reconsideration of communication strategies during and after a crisis is needed.
1. Introduction
Social media platforms are a valuable data source for information about online communication strategies (Kaplan and Haenlein Citation2010). Because social media data provide a continuous stream of real-time stored information, they open up possibilities for investigating the development of online opinion and networked relations with a study over an extended period of time (Lazer et al. Citation2009). Moreover, they enable the study of a risk or crisis situation and the feelings or thoughts involved without the need for respondents to look back on that event via a survey or interview. Social media data analysis allows the collection of a wide diversity of messages produced by a heterogeneous group of people directly at the time of the event (Gaspar et al. Citation2014). Searching the archived data for a specific timeframe provides the exact thoughts and opinions expressed by users on that particular day. The real-time information provided by social media platforms provides valuable insights into the development of a risk or crisis situation.
Social media data can be a valuable source of information for researchers. This is reflected in the large amount of literature in which social media data analysis is discussed. Prior research in which social media data are used for study purposes can be roughly divided into two domains. In the first domain, studies focus on the development of tools and machine learning set-ups for optimally extracting information from large numbers of messages. These studies typically focus on the technical details of the proposed system and the evaluation of its quality, rather than the theoretical context of the patterns that the system aims to extract (for example, see Barbera et al. Citation2015; He, Wang, and Akula Citation2017; Liu, Weitzman, and Chunara Citation2017; Palomino et al. Citation2016). In the second domain, research is directed at testing theories, such as situational crisis communication theory (SCCT), framing and cognitive dissonance, within the realm of social media. These studies are based on qualitative analyses and more often use survey data about social media rather than social media data themselves. They provide more insight into the dynamics of social media use and the information that the content of a social media message can give about a certain phenomenon (for example, see Gaspar et al. Citation2016; Mukkamala et al. Citation2015; Murnane and Counts Citation2014; Tremayne Citation2014).
Both domains of research offer interesting additions to knowledge about retrieving information from social media data, but a link between the two domains in which both qualitative and quantitative research are combined and a large amount of data is linked to theoretical insights is scarce. The current study intends to form a bridge between the two domains by analyzing a large corpus of social media data and extending the theoretical knowledge on social media data and communication in a crisis situation. By combining existing theoretical insights and analyzing social media data through network analysis and qualitative and quantitative content analysis, we contribute to the existing literature about social media data and online communication.
The goal of this study is to refine crisis communication theory by adding a network dimension through the analysis of social media data on the fipronil crisis in the Netherlands, this can help develop a method for improved communication during and after a crisis by providing insights about the role of different groups within the network.
1.1. The fipronil case
Every year, more than 10 billion eggs are produced in the Netherlands. 60 to 65 percent of those eggs are exported, mostly to Germany (Sorgdrager Citation2018). In the summer of 2017, fipronil was discovered in eggs at seven poultry farms in the Netherlands. Fipronil is a lice detergent and was used by a poultry red mite control company called ‘Chickfriend. Poultry red mite is a common problem for many poultry farmers. However, the use of fipronil is prohibited, and its illegal use undermined the food safety system. The eggs from these poultry farms were taken, and the eggs already in warehouses and supermarkets were recalled. The Netherlands Food and Consumer Product Safety Authority (NVWA) gave notice of the detergent in the eggs and provided the egg codes of these poultry farms so that consumers could check their bought eggs. After these first seven farms, news quickly spread that other poultry farms had used fipronil as well. Eventually, around 20 percent of all Dutch eggs were contaminated. The spread of this news resulted in more recalled eggs, more egg codes released for consumers to check and more commotion, which, in turn, resulted in extensive media coverage. Consumers were worried about the health risk, farmers about the recalled eggs and the resulting economic losses, and animal rights activists about the culling of contaminated chickens. The problem was not bounded to the Netherlands; 45 countries reported fipronil in eggs. This is an interesting case because there is an actual food safety risk, there is a perceived risk that is fed by the egg recall and the sheer number of farms involved, several groups (e.g. consumers, animal rights activists, farmers, supermarkets, and the NVWA) have a stake in the discussion, and it is a fraud case, which raises the question of which organization or person the responsibility for this fraud case should be attributed to.
2. Theory
In this study, the research question will be addressed by analyzing the online Twitter network development of groups of people in the Dutch crisis about fipronil in eggs by studying the way in which people frame the problem and attribute responsibility in the discussion.
2.1. Social networks and groups
Twitter is one of the few social media platforms where the notion of ‘friends’ or the automatic creation of a network through the formation of groups is not present. The messages posted by its users are potentially visible to every Twitter user and are easily shareable via the retweet function, and the use of hashtags and mentions allows users to create a public around a specific discussion without the need for creating a group (Colleoni, Rozza, and Arvidsson Citation2014).
Twitter users can follow other users without asking their permission, and a reciprocal ‘follow’ relationship is not necessary (Weng et al. Citation2010). Because of Twitter’s structure of followers and followees, users are presented with messages based on the other users whom they follow. When users send a message, they first reach their followers if they do not use a hashtag in their tweet. Within an online discussion regarding a specific topic, the use of hashtags can influence the reach that a message has because other users of the same hashtag can read and react to a message without having any connection or follower-followee relation with the original messenger (Bruns Citation2012).
While Twitter is not based upon a network, research shows (Kwak et al. Citation2010; Weng et al. Citation2010) that Twitter users tend to follow others based on their similarities. This phenomenon is also known as homophily: ‘Homophily is the principle that a contact between similar people occurs at a higher rate than among dissimilar people’ (McPherson, Smith-Lovin, and Cook Citation2001). Because of this notion of homophily, it is expected that people who are more similar to each other will be more likely to have a reciprocal ‘follow’ relationship and to react to each other’s messages. In accordance, it is likely that users will mention other users who are similar to them more often than others and will be more prone to retweet a message by a person who is similar to them, which leads to differences in the relationships and connections between people, even within a discussion of the same topic. When a crisis occurs, not all information about the causes and risks are available. Over time, more information will be present, which might influence the connections between people and the frequency of the messages sent within a group.
Based on homophily, a differentiation of groups within the network of people discussing a crisis online is expected. People that are more similar to each other will be more prone to react to each other, resulting in tighter connections between them. Therefore, people reacting to each other more often than to others will be visible as a distinguishable group in the network analysis. Examining these cohesive groups makes it easier to study the connections and underlying patterns within the entire network (Getchell and Sellnow Citation2016). We expect that people will react more to others with similar views on the crisis, thus forming a group within a network analysis. This expectation is examined in the first hypothesis:
H1 – It is possible to distinguish between different groups within the network of authors tweeting about fipronil.
2.2. Situational crisis communication theory
SCCT (Coombs Citation2007) provides guidelines to organizations regarding communication about a crisis to protect their reputation. According to Coombs (Citation2007), the first priority in any crisis is to protect the stakeholders from harm. The uncertainty of a crisis produces stress; to cope with this stress, stakeholders need information about what exactly happened and what measures are being taken to protect them from similar crises in the future. According to Coombs, an organization needs to provide information about the potential physical and psychological risks for victims of the crisis; subsequently, communication should focus on reputation protection. The basis for this approach is formed by attribution theory (Weiner Citation2008), which states that people try to understand why people act the way they do. When a person tries to understand why another behaves in a certain way, he attributes one or more causes for that behavior. These causes can be internal or external; for example, an athlete who wins a match can be attributed internally as someone who trained hard or is very talented or attributed externally as someone who was lucky or had a great team around him. Attributions are mainly driven by our emotional and motivational drivers, according to Weiner (2008). Coombs uses this theory about human behavior and the need to explain events by the attribution of responsibility for his approach. He claims that the responsibility attributed to an organization defines the way in which a communication manager should react in a crisis, which is why it is important for organizations to estimate their responsibility for the crisis as attributed by stakeholders (Coombs Citation2016). The crisis history – if an organization has been involved in a similar crisis in the past – and stakeholder relationship impact the potential risk of reputational damage.
The first step in determining possible reputational damage is to make an educated estimation of the attributed responsibility for the crisis. There are three types of responsibility attributions: victim, accidental and intentional. Regarding the first type, ‘victim’, the organization is barely held responsible, and the organization is viewed as a victim of the crisis as well. In ‘accidental’, minimal responsibility is attributed, and the crisis was not caused by the organization or not manageable for the organization. With ‘intentional’, the organization is held strongly responsible and is viewed as the cause of the crisis. After the responsibility attribution type is clear, the crisis history and stakeholder relationship are evaluated. These two factors can reinforce the attribution of responsibility. The extent to which an organization is held responsible for the crisis not only affects the reputation of the organization but also the future trust of stakeholders in the organization.
Although Coombs acknowledges that social media are an important arena for communication and tries to fill the gap in SCCT as formulated, he does not completely succeed. Coombs and Holladay’s conclusion about sub-arenas was that ‘As part of monitoring the effects of a crisis communication effort, crisis managers need to map the various sub-arenas, assess how people are reacting in the various sub-arenas, and adapt their crisis messaging to those reactions’. This statement makes clear that the authors do indeed recognize that there are multiple discussion channels and that differences in reactions, perceptions and attributions of responsibility are possible between sub-arenas. However, they do not pay attention to the possibility that people differ in opinion within a sub-arena. In this research, we focus on exploring the possibilities of using a network approach to examine the differences within a Twitter network. This can help our understanding about when SCCT operates as predicted and when it does not (Coombs Citation2016). We expect that groups that are active within the network have different stakes in the crisis and will thus differ in the extent to which they attribute responsibility. This notion is tested based on the following hypothesis:
H2 – Different groups within the fipronil network attribute responsibility differently.
2.3. The role of stakeholders and gatekeepers
Although the social mediated crisis communication (SMCC) model, as introduced by Jin, Liu, and Austin (Citation2014), offers a further application of SCCT to the field of social media data analysis, which stakeholders are important partners and how to reach the right public remain unclear. In addition, both theories assume direct contact from the communication manager with the stakeholders. SCCT states that the media are usually the deciding factor in determining the crisis frame (victim, accidental or intentional) and that stakeholders take over this frame (Coombs Citation2007). However, the influence of the media as a gatekeeper (White Citation1950) that transfers crisis perception and communication to the public is not discussed, nor is the possibility of the dissemination of (social) media through opinion leaders addressed. The two-step flow theory introduced by Katz and Lazarsfield in 1955 states that mass media communication first reaches an opinion leader and that this opinion leader then spreads the information to a wider audience. Two-step flow theory can contribute to current models, as it provides space not only to identify a single stakeholder but also to find the other key players who share information about the organization. Research by Wu et al. (Citation2011) shows that the most frequently followed users on Twitter are not companies or media organizations but individuals who communicate directly with their followers through messages that they usually write themselves. Additionally, research by Bastos, Raimundo, and Travitzki (Citation2013) regarding political hashtags reveals that the role of gatekeepers on Twitter is no longer reserved solely for news media. Rather, individuals are increasingly acting as gatekeepers (Bastos, Raimundo, and Travitzki Citation2013). By analyzing which individuals can be viewed as gatekeepers or key authors in the overall network of online audiences, a more focused communication strategy that matches the specific group or stakeholder can be applied. To obtain more insights into the role and position of opinion leaders, we examine whether opinion leaders attribute responsibility differently from other people in the network, which is captured in the following hypothesis:
H3 – Authors with a central position in the fipronil network attribute responsibility more often than authors who are not central in the network.
2.4. Framing and agenda-setting
Agenda-setting effects assume that the locus of effect lies in the heightened accessibility that an issue receives from its treatment in the news (Price and Tewksbury Citation1997). Thus, it is not information about the issue that has the effect; rather, it is the fact that the issue has received a certain amount of processing time and attention that carries the effect (Scheufele and Tewksbury Citation2007).
In contrast, the basic framing approach assumes that the locus of effect lies in the description of an issue or the label used in news coverage about the issue. The underlying interpretive schemas that have been made applicable to the issue are the central effect of a frame. The primary difference on the psychological level between agenda-setting and priming, on the one hand, and framing, on the other hand, is therefore the difference between the frequency and the manner of thinking about an issue (Scheufele and Tewksbury Citation2007). McCombs (Citation2004) has argued that framing is simply a more refined version of agenda-setting. From that perspective, framing means making aspects of an issue more salient through different modes of presentation and thereby shifting people’s attitudes; he labels this phenomenon ‘second-level agenda setting’ (Scheufele and Tewksbury Citation2007). According to Entman (Citation1993), frames define problems, diagnose causes, make moral judgments and suggest remedies. A frame in any particular text may not necessarily include all four functions (Entman Citation1993). How a message is framed influences how the message is perceived. The framing of an event can change over time when other aspects of the event become more salient. Because the expectation is to find different groups within the network that differ in their views of this crisis and, accordingly, in how they frame the crisis, the following hypothesis is proposed:
H4 – Different groups within the fipronil network use different frames.
3. Materials and methods
A case study is conducted to obtain insights into what can be learned from social media about communication strategies during a crisis. We chose to analyze an event as a case (Yin Citation2018), the Fipronil crisis in the Netherlands. This event has multiple interesting aspects; It is both a health risk, a fraud case, an economic risk and a political risk. Furthermore, it is difficult to determine who is to blame for this crisis since there are multiple actors involved in the development of the crisis on this scale. This attracts many different people with different viewpoints and stakes to the discussion, making it a dominant news case in the Netherlands in the summer of 2017. A mixed methods approach is used for the data analysis. A network analysis is conducted to distinguish between groups within the network, and then, a comparative analysis of these groups is performed based on quantitative and qualitative content analysis. The Twitter data are collected via Coosto, a social media monitoring tool with a focus on Dutch messages that scrapes the content of social media platforms, including Twitter, every 2 minutes and stores the data. All tweets sent between July 17 and October 5, 2017, related to the fipronil case in the Netherlands are scraped from the Coosto (www.coosto.com) database using the query shown in .
Table 1. The query terms submitted to Coosto to collect tweets related to the fipronil case.
This method resulted in a corpus of 87,454 tweets related to fipronil. Given the diversity of our query, all messages not fitting the query but still related to fipronil are excluded from this corpus. We have tried to find a balance in the tradeoff between losing tweets relevant to the fipronil crisis and retrieving irrelevant tweets.
The first step before the data analysis is preprocessing the data to form an edge list and node list for the network analysis. An edge list is produced from the author-tweet combinations based on retweets and mentions. The edge list is a list of connections between an author and a person mentioned by this author in the tweet. Authors are matched based on one author mentioning another author in the tweet, which reflects a relation between the author and the person mentioned (Bruns Citation2012). If an author retweeted a message, only the username of the retweeted person was connected to the author (e.g. X: RT@Y Great Job @Z!; the author (X) is connected to the retweeted person (Y) and not to the other person (Z) because Z is directly mentioned only by Y and not by X, which results in one pair, X-Y). If the author was an original poster, all usernames mentioned were connected (e.g. X: Great Job @Y @Z!; the author (X) is connected to all usernames (both Y and Z) mentioned in the tweet, yielding the pairs X-Y and X-Z.). After completing the edge list, a node list was formed. A node list is a list of all unique authors containing information about the individual author. In this case, a node list was formed with all unique author names, the date of the first and last tweet of the author and the total number of messages per author. With the edge list and node list, a graph of all network relations over time is formed.
3.1. Groups
The OpenOrd algorithm (Martin et al. Citation2011) clusters groups of author-mentioned pairs based on the frequency of interaction. The modularity shows the different groups with different colors and ranks them based on the size of the group compared to the total network. We distinguished between the ten largest groups and formed an eleventh group by merging all smaller groups into one. In addition to the network information that Gephi produces, it provides an assessment of the centrality of authors, their in- and outdegree (the number of messages received and sent) and their PageRank. The PageRank of a node gives an indication of the importance of that node (the author) within the network, and a node is assumed to be more important if it has more links to other nodes (Brin and Page Citation1998).
3.2. The coding process
To test hypotheses H2–H5, the tweets are coded on the frames used and on whether there is a case of attribution of responsibility. Due to the size of our dataset, coding all messages was not feasible. We tried to obtain insights into the contents per group by calculating the term frequency-inverse document frequency (tf-idf) over all messages, where the messages per group are viewed as separate documents in the corpus. Unfortunately, this technique was not fruitful in this research because the independent words were not sufficiently meaningful to qualify as frames. Therefore, human coding was chosen because it allows greater flexibility in discovering frames (Chong and Druckman Citation2007). To code the frames, the definition of Entman (Citation1993) formed the basis for several variables to measure framing. We looked at the actor who was mentioned, the problem mentioned in the tweet, whether a moral judgment was made, and whether a solution was provided by the author. To measure the difference in the attribution of responsibility between the groups, we coded ‘no responsibility attributed’ as 0 and ‘responsibility attributed’ as 1.
The 87,486 tweets were sent by 24,090 different authors, which gives a mean of 3.6 messages per user. Almost half (45.5%) of the tweets were retweets. To analyze the differences in content between the tweets, all duplicates and retweets were excluded from the tweets sampled for annotation. After removal, the sampling set consisted of 47,616 tweets. From this set, a random sample of 3,826 tweets was drawn. This sample size of 3,826 was calculated based on a confidence level of 99% and a confidence interval of 2. The sample size is then matched by actor: if none of the predefined actors mentioned in the codebook is present in the tweet, the tweet is removed from the set, leaving 1,373 tweets for human coding.
The first author coded 100 tweets randomly drawn from the original sampling set of 47,616 tweets to test the codebook. After a first revision, three coders each coded 100 tweets from that sample. After discussing and finalizing the codebook, each coder coded 100 tweets from the sample set and Krippendorff’s alpha was computed (Hayes and Krippendorff Citation2007; De Swert Citation2012). For examples of coded tweets, see . The remaining sample set of 1,273 was annotated by the first author based on this codebook. Tweets that were ambiguous were discussed with the other coders for optimization of the annotation.
Table 2. Examples of framing and attribution of responsibility.
The variables annotated in this research are presented below. Whether a tweet should be annotated was the first variable. The message should not be coded if the tweet was clearly a news message, a quote from someone else, a message with a funny purpose, or a message that was unrelated or unclear. To identify the frames in the tweets, four variables were formed: ‘actor’, ‘problem’, ‘moral judgment’ and ‘solution’. The actor was annotated by deciding which person or party is most clearly mentioned in a tweet. If two or more actors are of equal importance, the actor first mentioned is chosen. The problem – which side of the fipronil case is most clearly emphasized – variable is based on a list of possibilities that was inductively obtained through reading a subset of tweets (a ‘learning set’ not used for the actual coding process). For the moral judgment and solution, open coding was used to enable staying close to the actual wording of the author. Because these two variables were very uncommon, they were excluded from the analysis (see the appendix for the complete list of coded actors and problems). For the analysis of the attribution of responsibility, the categories defined by Coombs (Citation2007) were used: ‘victim’, ‘accidental’, and ‘intentional’. This variable could take the following values: 0 – no attribution; 1 – victim; 2 – accidental; or 3 – intentional. As it appeared difficult to detect the intention of the author in a short message, differentiating between the attribution of responsibility categories ‘accidental’ and ‘intentional’ was infeasible. The codebook was therefore revised by splitting attribution into two variables: one for attribution of intentional or accidental responsibility, and one for attribution of victim responsibility.
The Krippendorff’s alpha agreement on whether to annotate a tweet was fair, 0.79. The Krippendorff’s alpha agreement on the actor variable was good, 0.92. The Krippendorff’s alpha agreement on the problem variable was fair, 0.72. For attribution of responsibility (0-1), the Krippendorff’s alpha agreement was low, 0.47. Although two categories are combined, there was disagreement about whether the author of the tweet attributed no responsibility or some to a great deal of responsibility to an actor. The victimization variable had a Krippendorff’s alpha agreement that was low, 0.65.
The variables with alphas that were too low were discussed by the three coders to form a final version of the codebook with more detailed coding descriptions to make it suitable for the first author to code the rest of the sample. The intercoder agreement on the variables based on the SCCT by Coombs is low. The coders discussed the differences in coding for these two categories and came to further agreement. Before, we based the annotation on the actor alone, but we agreed to also include the problem in addressing whether the responsibility for that specific problem was attributed.
Because we have the dates of all the tweets, an analysis of the frames identified in the coded messages over time, with weeks as the measurement level, was conducted.
4. Results
4.1. Groups
The OpenOrd algorithm clustered the nodes, after which the modularity algorithm indicated the groups formed (Blondel, Guillaume, Lambiotte, and Lefebvre 2008). In , all nodes (authors, the dots) and edges (tweets, the lines) of the ten largest groups are shown. The color of the node indicates the group to which it belongs. The largest groups are the dark green group consisting of Belgian authors, the pink group consisting of animal rights advocates, the yellow-brown group consisting of farmers and agricultural organizations, and the green group consisting of NVWA amongst others. The algorithms provided descriptives of each node: betweenness centrality, PageRank, and degree. Betweenness centrality describes how often the node is passed through when calculating the shortest paths through the network (Brandes Citation2001). PageRank is the popularity of the node based on the number of mentions by important others, and the degree is the number of sent and received messages per node. The descriptives, averaged for all the nodes within the groups, are presented in .
Figure 1. The Gephi network of all nodes and edges, colored by group.
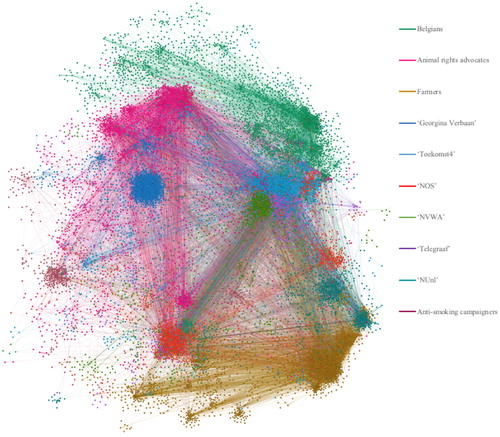
Table 3. Descriptives of the groups.
4.2. Groups over time
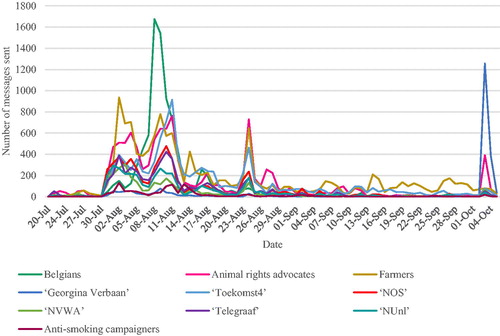
The number of messages that was sent per group per day is depicted in . As shown, there was little activity on Twitter in the first week; in the second week, the number of tweets greatly increased, and a peak is visible in the third week due to a high number of tweets sent by the Belgian – dark green – group. A chi-square test ((110), 43684.23, p < .001) shows that the groups differed significantly in the number of tweets and the timing of the tweets. shows an early involvement of three groups: The group represented by animal rights advocates (pink), the group with the NVWA as one of the nodes (green), and the group with a specific social media account that shared news as one of the nodes (toekomst4, blue). In the second week of the fipronil discussion, the group containing (among others) several farmers (yellow-brown) became involved, and the interactions between people increased.
Figure 2. Number of messages sent per group per day.
We were able to distinguish groups in the network and thus confirm the first hypothesis based on the entire dataset (87,454 messages). For the subsequent hypotheses, the annotated subset of tweets (1,374 messages) was analyzed. Groups 4, 9 and 10 had few coded messages because of the high prevalence of retweets and irrelevant tweets in these groups; they were excluded from further analysis because of their lack of data. Group 11 was also excluded from further analysis because it is composed of many small groups and cannot be viewed as a homogeneous group. Accordingly, groups 1, 2, 3, 5, 6, 7, and 8 were analyzed in this phase of the research. Due to the loss of messages that were not coded because of irrelevance based on the codebook and the removal of several groups, 513 coded messages were analyzed for their attribution of responsibility and framing.
4.3. Attribution of responsibility
For each of the groups, the number of messages, the number of coded messages and the number of messages in which responsibility was attributed are given (). Some degree of attribution of responsibility was mentioned in 54% of the annotated tweets. Some actors were not attributed responsibility at all; they were excluded from further analysis. The NVWA was held responsible in the tweets most frequently, with a tweet mentioning some degree of responsibility 67 times (32%), followed by the government (44 times, 21%) and farmers (31 times, 15%). , based on a cross-tabulation of actors by problem and by attribution, shows that the NVWA was held most responsible for its policy choices (36 out of 74 attributions) and communication (21 out of 74), the government for policy choices and food safety (15 and 13, respectively, out of 66) and farmers for food safety and economic losses (17 and 13, respectively, out of 38). The differences between groups in the frequency of attributing responsibility were significant based on a chi-square test of groups by attribution ((6) 21.21, p = .002).
Figure 3. Attributions of responsibility per actor.
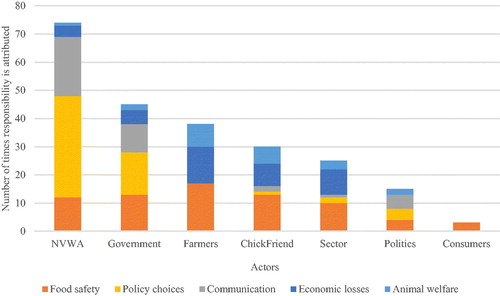
Table 4. Coded message and attributions per group.
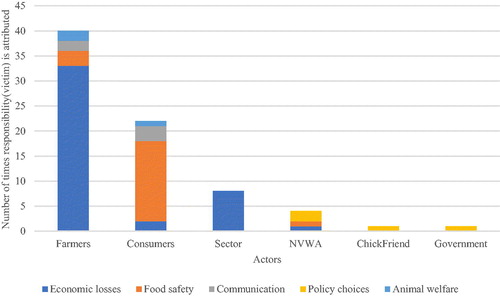
Victimization was mentioned in 66 of the 513 annotated tweets, and the actors most considered victimized were the farmers, followed by consumers. A chi-square test of the differences between groups in the frequency of attributing responsibility as a victim was significant ((6) 45.14, p < .001). The most remarkable finding was that group 3, consisting of farmers and farmer advocates, considered farmers to be the most victimized, indicating that this group often mentioned the problems and losses that they or their colleagues face. The other actor associated with victimization is the consumer, mentioned by many different groups. , based on a cross-tabulation of actors by problem and by attribution of responsibility as a victim, shows that the victimization of consumers was most associated with food safety (16 out of 22 victim annotations) and that the victimization of farmers was most associated with economic losses (33 out of 40 victim annotations).
Figure 4. Attributions of victim responsibility per actor.
H2 – different groups attribute responsibility differently – is confirmed; the groups differ in the frequency in which responsibility was attributed in the form of either victim, accidental or intentional behavior. In addition, the actor to whom most responsibility was attributed differs between the different groups.
4.4. Opinion leaders
The most influential people in the network can be viewed as either the people with the highest PageRank or the people who were most central in the network (a high betweenness centrality). The PageRank cutoff point was 0.003 to include authors from all ten largest groups with a reasonably large rank. Looking at people with the highest PageRank, we observed that within the annotated tweets, the 27 authors with the highest PageRank attributed responsibility just 9 times, of which 4 times were as a victim. No responsibility was attributed 8 times. Because of the random sampling, only seven of these opinion leaders had tweets coded.
Looking at people with the highest betweenness centrality (>1,000,000), we observed that in the annotated tweets, the 29 authors with the highest betweenness centrality attributed responsibility 30 times, of which 11 times as a victim. No responsibility was attributed 33 times. In this group of opinion leaders, 21 authors had tweets coded. In both cases, close to half of the tweets contained some form of attribution of responsibility, but for the highest PageRank group, only a few messages were coded, making the betweenness centrality group a better measure in this particular case. In the annotated dataset, responsibility was attributed 436 times – of which 104 times were as a victim – out of a total of 719 annotations, which is 60% of all tweets. Opinion leaders had a lower percentage of attribution than overall, but this result was based on a small sample size.
When reversing the procedure by comparing the mean PageRank of the authors who attributed responsibility and the authors who did not, no significant differences were found. However, when comparing the average betweenness centrality of the authors, we found that differences between the types of attribution were visible. The 286 authors who attributed responsibility as accidental/intentional had an average betweenness centrality of 217,029, and the 244 authors attributing no responsibility had an average betweenness centrality of 293,599. The 98 authors attributing responsibility as a victim, however, had a significantly higher average betweenness centrality, 398,815.
Based on these outcomes, H3 – opinion leaders attribute responsibility more often than others – is partly confirmed. Authors who deemed someone responsible for accidental/intentional behavior have a lower average betweenness centrality than authors attributing no responsibility, while authors who attribute responsibility as a victim to someone had a significantly higher average betweenness centrality than authors who did not attribute responsibility.
4.5. Framing
The most mentioned problem in the tweets was food safety (199), followed by economic losses and communication (both 117). The problem framing differed between the groups, as shown in . Notably, group 3, the farmers, discuss economic problems relatively often, while group 5 – to which the NVWA belongs – was most concerned about food safety.
Table 5. Group differences for three prominent groups within the network.
Chi-square tests showed highly significant differences in frequencies per group for the animal welfare problem ((6) 21.69, p = .001) and the economic loss problem ((6) 31.95, p < .001). Framing the problem as a food safety issue ((6) 13.55, p = .035) or as policy choices ((6) 12.98, p = .043) showed significant differences in frequency per group, and the framing of the problem as communication does not differ significantly per group ((6) 10.46, p = .106).
Further tests on the four most prominent groups (Belgians, animal rights activists, farmers, NVWA) showed that the frequency of framing the problem as a food safety issue differs significantly between farmers and group 7 (NVWA). The frequency of framing the problem in terms of economic losses was significantly higher for farmers than for all other groups. The animal rights activists differed significantly from the Belgians and farmers in the frequency of framing the problem as an animal welfare issue. The frequency of framing the problem as a communication error differed significantly between the NVWA and animal rights activists.
H4 – different groups use different frames – is partly confirmed. There were some significant differences in the frequency with which each of the problems is framed between the groups, but no specific frame was uniquely used by a particular group. Groups used one frame more often than others, and some frames were more present in one group than in the others.
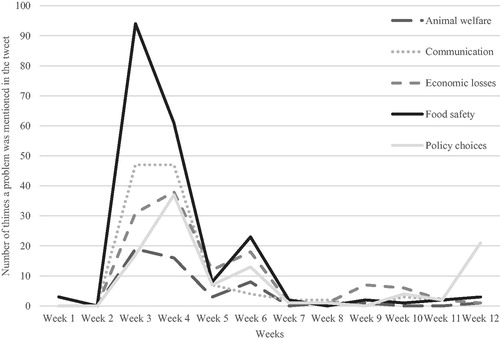
displays the number of times a specific problem was mentioned in the tweets per week. The first week is the week in which the fipronil crisis started, from July 17 to 23, 2017, followed by consecutive weeks until October 5 (week 12). In the first three weeks, food safety was the main problem mentioned in the tweets, with a strong decrease after week 3 and a small increase in week 6. The other problems showed similar patterns in the first 6 weeks. From week 8 onwards, an increase in the economic loss problem was visible, and notably for week 12, there was a clear increase in the number of mentions of policy choices. This was mainly caused by the introduction of a new issue in that week. Many people suggested that the new issue had priority over solving the fipronil issue, which made people question the policy choices and handling of the fipronil issue by the government and NVWA.
Figure 5. Problem framing over time.
5. Discussion
Through network analysis, we analyzed the dynamics of the online discussion on Twitter about fipronil use in the Netherlands to find that there are different groups in the discussion. Specific groups were identifiable within the network based on the frequency of communication and the retweet/mention relations of the users with each other, thereby confirming the first hypothesis. This result has consequences for Coombs’ (2007) notion of ‘the stakeholder’. In his approach, Coombs suggests a method for finding the most appropriate communication strategy whereby one actor reacts to one homogenous group of stakeholders. Coombs states that the level of responsibility attributed to an organization influences the choice of the best communication strategy for that organization, whereby one organization chooses one communication strategy based on one homogeneous group of stakeholders. This research implies that deciding on a single communication strategy might not be effective because many different groups emerged through our network analysis (e.g. farmers, consumers, animal rights advocates, governmental bodies, politicians) and these groups differ in their framing and attribution of responsibility.
As expected in hypothesis 2, different groups attribute responsibility differently in terms of frequency, type and actor. Some groups attributed responsibility more often than others, indicating a greater proneness to diagnosing the causes of the crisis. Some groups expressed the attribution of responsibility as a victim more often than others; this result was prevalent in the group of farmers, who often portrayed themselves as a victim. This attribution can be considered one of the strategies distinguished by Coombs: declaring one’s own victim status and completely denying responsibility for the crisis. The attribution of responsibility as accidental or intentional was more common. Interestingly, the actor who is factually and clearly responsible for the emergence of this crisis – ChickFriend – is not mentioned that often. Rather, the NVWA, the government and the farmers are attributed responsibility. In particular, if farmers and the sector are taken together as the agricultural business, the farmers are mentioned almost as frequently as the NVWA, which contradicts the victim attribution by the farmers – apparently, groups differ in their opinion about the role of the farmers in this crisis. The government and the NVWA are viewed as the actors who dealt with the crisis wrongly, either through bad (or no) communication about the crisis or by making the wrong policy choices. Because groups differ in their attribution of responsibility, it is hard to use Coombs’ method to decide upon a communication strategy.
The centrality of authors within the network had an influence on their attribution of responsibility. Opinion leaders attribute victim responsibility more often, while less influential people attribute accidental or intentional responsibility more often. This indicates that the opinion leaders within this network are important for the establishment of actors regarded as victims in this crisis.
Different groups within this network use different frames to address the problem of the crisis, which is in line with hypothesis 4. The group consisting of farmers uses the economic loss frame more often than other actors, and the group consisting of animal rights advocates frame the fipronil crisis as an animal welfare problem more often. This result reaffirms the necessity of specifying a communication strategy to reach the right people, although caution must be taken when interpreting these results. Because this research is based on Twitter messages and groups are formed by our analyses, it is difficult to determine whether users are part of the same group based on relationships or shared views, and thus, it is difficult to determine their framing of this crisis. Some users might be connected merely because they share the same frame, which influences how framing differences can be interpreted.
Examining the role of opinion leaders within a group is also important for deciding upon the communication strategy, especially for how an organization communicates the message to a group. Opinion leaders, who are authors with a more central position in the network, have a tendency to address the innocence of actors more often than other authors. This tendency may impact the choice of communication channel: finding opinion leaders in a group and communicating with them to disperse a message throughout the group might be more effective than communicating to the group as a whole.
After the initial news item about fipronil, there was little attention to the subject on Twitter. However, soon after, the discussion took off, resulting in attention from a highly diverse public on Twitter. The framing of the crisis changed slightly over time. It started off as merely a food safety issue and gradually evolved to more diverse issues: animal welfare, communication, economic losses and policy choices were mentioned more often, and the discussion began to focus more on the way in which the actors handled the crisis and the consequences of the crisis for different parties. Especially when a new issue was introduced in the discussion, questions about the urgency of solving the fipronil issue dramatically increased. This finding is in line with Entman’s findings that frames tend to develop over time as people become more informed and are better able to understand the issue (Entman Citation1993). At first, the participants in the discussion use frames to define problems and diagnose causes; after a while, they use frames to make moral judgments and suggest remedies.
5.1. Mixed methods
In this research, we tried to find a balance between studies with a theoretical basis that use a relatively small dataset for their research and studies that focus on methodological advances by using larger datasets to verify their proposed method. We performed a quantitative network analysis based on the complete dataset of 87,454 tweets that referred to the fipronil crisis, which provided us with information about group formation and the opinion leaders within the network. We then manually coded a subset of tweets to obtain information about the framing and attribution of responsibility by selecting a representative random sample from the complete dataset. Other scholars have used automatic content analysis on tweets. For example, Barbera et al. (Citation2015) used automatic content analysis on tweets in their research but focused on the political position (liberal or conservative) of the author rather than the tweet content. We found that this method was not suitable for our research. Frames and attributions are difficult to detect in a tweet by automatic content analysis because the short messages give extra importance to the context of the words, influenced the meaning of them. We applied the tf-idf as a metric to obtain insights into the word use in the complete dataset among the different groups. However, this approach did not lead to clear differences based on which insights into the word use in the groups could be obtained. For this research, human coding seemed a better fit because of the subtle differences in word meanings and contextual influences. Finding the frames and adding new frames when others did not fit were possible by manually reading and annotating the tweets. The downside of human coding is that it led to a much smaller sample of tweets to be analyzed for this study. Especially with the analysis of multiple variables, since the data were already spread over ten groups, the data became scarce. An optimal balance between quality and quantity has yet to be found.
5.2. Limitations
One limitation of this study was that during the coding process, deciding whether Twitter users meant to attribute responsibility for an intentional or an accidental act appeared difficult. In this study, both were coded together, and even then, we reached Krippendorff’s alpha, which might have influenced the results and hampered conclusions about the best communication strategy. Coombs states that anticipating the level of responsibility attributed to a party is important; however, determining the level of attributed responsibility is not particularly straightforward, especially when using tweets as a source of information. More detailed guidelines on how to determine attributions of responsibility are needed to help communication managers understand the level of responsibility attributed.
Because only a subset of the tweets, albeit a random sample large enough to extrapolate to the entire group, was coded, some important tweets might have been missed in the analysis. Many messages were not used in this analysis because of duplication or irrelevance. Due to the somewhat small subset of coded messages, not all aspects of framing could be accurately established. This is a pity because the moral judgments and solutions provided in the tweets could not be analyzed, which might have provided interesting insights into the development of the discussion and could have yielded additional suggestions for improving communication during and after a crisis. Furthermore, the selection of the medium Twitter and the choice to export the tweets from Coosto via a search query might have affected the representability of the dataset. Not all people with a stake in this discussion may be active on Twitter, and not all messages sent may have been incorporated in the dataset through the selection of this specific query. Nonetheless, Twitter messages provided unobtrusive messages while giving us the opportunity to create a network of authors. In addition, Coosto enabled an easy and effective retrieval of the tweets over a longer time period, and the chosen query was carefully selected to retrieve all messages related to fipronil without receiving messages unrelated to the topic. Future research could focus on coding more tweets, enabling a full view of the framing aspects to be analyzed.
6. Conclusion
This study shows that with regard to the communication strategy decision, deciding upon one actor and one (homogeneous) stakeholder group is not the right strategy. There are several actors active in a crisis who all frame the crisis in a different manner. The Twitter users active in this discussion are both the actors in the actual crisis and people who have a certain stake in the outcome of the crisis; their stake is represented by the group with which they interact and the frames that they use. The notion of a network in which groups are active provides important insights into the communication structure. By studying the changing relations of Twitter authors, knowledge about the connections that people make and the information that they access and share is gained. This knowledge could form an important basis for developing a communication strategy because different groups have different opinion leaders for accessing the groups and because different groups require different approaches through which to obtain the right information. When considering a specific actor within this crisis, we can advise taking the perspectives of the multiple stakeholders into account when deciding upon the communication strategies to use and to refrain from introducing a new, unrelated, issue in the discussion before the original issue is handled. The extent to which communication strategies tailored to specific groups based on these insights are effective is an avenue of future research.
Disclosure statement
No potential conflict of interest was reported by the authors.
References
- Barbera, P., J. T. Jost, J. Nagler, J. A. Tucker, and R. Bonneau. 2015. “Tweeting from Left to Right: Is Online Political Communication More than an Echo Chamber?” Psychological Science 26(10): 1531–1542.doi:10.1177/0956797615594620.
- Bastos, M. T., R. L. G. Raimundo, and R. Travitzki. 2013. “Gatekeeping Twitter: Message Diffusion in Political Hashtags.” Media, Culture & Society 35(2): 260–270. doi:10.1177/0163443712467594.
- Brandes, U. 2001. “A Faster Algorithm for Betweenness Centrality.” Journal of Mathematical Sociology 25(2): 163–177. doi:10.1080/0022250X.2001.9990249.
- Brin, S., and L. Page. 1998. “The Anatomy of a Large‐Scale Hypertextual Web Search Engine.” Computer Networks 30: 107–117. doi:10.1016/S0169-7552(98)00110-X.
- Bruns, A. 2012. “How Long Is a Tweet? Mapping Dynamic Conversation Networks Ontwitterusing Gawk and Gephi.” Information, Communication & Society 15(9): 1323–1351. doi:10.1080/1369118X.2011.635214.
- Chong, D., and J. Druckman. 2007. “Framing Theory.” Annual Review of Political Science 10(1): 103–126. doi:10.1146/annurev.polisci.10.072805.103054.
- Colleoni, E., A. Rozza, and A. Arvidsson. 2014. “Echo Chamber or Public Sphere? Predicting Political Orientation and Measuring Political Homophily in Twitter Using Big Data.” Journal of Communication 64(2): 317–332. doi:10.1111/jcom.12084.
- Coombs, W. T. 2007. “Protecting Organization Reputations during a Crisis: The Development and Application of Situational Crisis Communication Theory.” Corporate Reputation Review 10(3): 163–176. doi:10.1057/palgrave.crr.1550049.
- Coombs, W. T. 2016. “Reflections on a Meta-Analysis: Crystallizing Thinking about SCCT.” Journal of Public Relations Research 28(2): 120–122. doi:10.1080/1062726X.2016.1167479.
- De Swert, K. 2012. Calculating Inter-Coder Reliability in Media Content Analysis Using Krippendorff's Alpha. Amsterdam: Center for Politics and Communication.
- Entman, R. M. 1993. “Framing: Toward Clarification of a Fractured Paradigm.” Journal of Communication 43(4): 51–58.
- Gaspar, R., S. Gorjão, B. Seibt, L. Lima, J. Barnett, A. Moss, and J. Wills. 2014. “Tweeting during Food Crises: A Psychosocial Analysis of Threat Coping Expressions in Spain, during the 2011 European EHEC Outbreak.” International Journal of Human-Computer Studies 72(2): 239–254. doi:10.1016/j.ijhcs.2013.10.001.
- Gaspar, R., C. Pedro, P. Panagiotopoulos, and B. Seibt. 2016. “Beyond Positive or Negative: Qualitative Sentiment Analysis of Social Media Reactions to Unexpected Stressful Events.” Computers in Human Behavior 56:179–191. doi:10.1016/j.chb.2015.11.040.
- Getchell, M. C., and T. L. Sellnow. 2016. “A Network Analysis of Official Twitter Accounts during the West Virginia Water Crisis.” Computers in Human Behavior 54: 597–606. doi:10.1016/j.chb.2015.06.044.
- Hayes, A. F., and K. Krippendorff. 2007. “Answering the Call for a Standard Reliability Measure for Coding Data.” Communication Methods and Measures 1(1): 77–89. doi:10.1080/19312450709336664.
- He, W., F.-K. Wang, and V. Akula. 2017. “Managing Extracted Knowledge from Big Social Media Data for Business Decision Making.” Journal of Knowledge Management 21(2): 275–294. doi:10.1108/JKM-07-2015-0296.
- Jin, Y., B. F. Liu, and L. L. Austin. 2014. “Examining the Role of Social Media in Effective Crisis Management: The Effects of Crisis Origin, Information Form, and Source on Publics’ Crisis Responses.” Communication Research 4(1): 74–94. doi:10.1177/0093650211423918.
- Kaplan, A., and M. Haenlein. 2010. “Users of the World, Unite! the Challenges and Opportunities of Social Media.” Business Horizons 53(1): 59–68. doi:10.1016/j.bushor.2009.09.003.
- Kwak, H., C. Lee, H. Park, and S. Moon. 2010. “What Is Twitter, a Social Network or a News Media?” Paper presented at the 19th international conference on World Wide Web, Raleigh, North Carolina, USA.
- Lazer, D., A. Pentland, L. Adamic, S. Aral, A.-L. Barabasi, D. Brewer, N. Christakis, et al. 2009. “ Social science. Computational social science.” Science (New York, N.Y.) 323(5915): 721–723. doi:10.1126/science.1167742.
- Liu, J., E. R. Weitzman, and R. Chunara. 2017. “Assessing Behavioral Stages from Social Media Data.” CSCW: Proceedings of the Conference on Computer-Supported Cooperative Work. Conference on Computer-Supported Cooperative Work 2017:1320–1333. doi:10.1145/2998181.2998336.
- Martin, S., W. M. Brown, R. Klavans, and K. W. Boyack. 2011. “OpenOrd: An Open-Source Toolbox for Large Graph Layout.” Proceedings Volume 7868, Visualization and Data Analysis.
- McCombs, M. E. 2004. Setting the Agenda: The Mass Media and Public Opinion. Malden, MA: Blackwell.
- McPherson, M.,. L. Smith-Lovin, and J. Cook. 2001. “Birds of a Feather: Homophily in Social Networks.” Annual Review of Sociology 27(1): 415–444. doi:10.1146/annurev.soc.27.1.415.
- Mukkamala, R. R., J. I. Sorensen, A. Hussain, and R. Vatrapu. 2015. “Social Set Analysis of Corporate Social Media Crises on Facebook.” Paper presented at the 2015 IEEE 19th International Enterprise Distributed Object Computing Conference.
- Murnane, E. L., and S. Counts. 2014. “Unraveling Abstinence and Relapse.” Paper presented at the Proceedings of the 32nd annual ACM conference on Human factors in computing systems - CHI '14.
- Palomino, M., T. Taylor, A. Goker, J. Isaacs, and S. Warber. 2016. “The Online Dissemination of Nature-Health Concepts: Lessons from Sentiment Analysis of Social Media Relating to "Nature-Deficit Disorder.” International Journal of Environmental Research and Public Health 13(1): 142.
- Price, V., and D. Tewksbury. 1997. “News Values and Public Opinion: A Theoretical Account of Media Priming and Framing.” In Progress in Communication Sciences: Advances in Persuasion, edited by G. A. Barett & F. J. Boster, Vol. 13, 173–212. Greenwich, CT: Ablex.
- Scheufele, D. A., and D. Tewksbury. 2007. “Framing, Agenda Setting, and Priming: The Evolution of Three Media Effects Models.” Journal of Communication 57: 9–20. doi:10.1111/j.0021-9916.2007.00326.x.
- Sorgdrager, W. 2018. Onderzoek Fipronil in Eieren. Enschede: Ipskamp printing.
- Tremayne, M. 2014. “Anatomy of Protest in the Digital Era: A Network Analysis of Twitter and Occupy Wall Street.” Social Movement Studies 13(1): 110–126. doi:10.1080/14742837.2013.830969.
- Weiner, B. 2008. “Reflections on the History of Attribution Theory and Research.” Social Psychology 39(3): 151–156. doi:10.1027/1864-9335.39.3.151.
- Weng, J., E. P. Lim, J. Jiang, and Q. He. 2010. “Twitterrank: Finding Topic-Sensitive Influential Twitterers.” Paper presented at the third ACM international conference on Web search and data mining, New York, New York, USA.
- White, D. M. 1950. “The ‘Gate Keeper’: A Case Study in the Selection of News.” Journalism Quarterly 27(4): 383–390. doi:10.1177/107769905002700403.
- Wu, S., J. M. Hofman, W. A. Mason, and D. J. Watts. 2011. Who says what to whom on Twitter. In: Proceedings of the 20th ACM International World Wide Web Conference, Hyderabad, India, 28 March–1 April.
- Yin, R. K. 2018. Case Study Research and Applications: Design and Methods. 6th revised edition. London and Singapore: Sage.
Appendix: Tables of actors and problems mentioned in the tweets
Table A1. Actor mentioned in the tweet.
Table A2. Problem mentioned in the tweet.