
Abstract
In this study, we present results from five cross-sectional surveys on public risk perception of COVID-19 and its association with health protective behaviours in the UK over a 10-month period (March 2020 to January 2021). Samples were nationally balanced on age, gender, and ethnicity (total N = 6,281). We find that although risk perception varies between the time points surveyed, it is consistently, significantly, and positively correlated with the reported adoption of protective health behaviours, such as wearing face masks or social distancing. There is also an increase in reported health protective behaviours in the UK between March 2020 and January 2021. The strength of the association between risk perception and behaviour varies by time point, with a stronger relationship in January 2021 compared to March and May 2020. We also assess the stability of the psychological determinants of risk perception over time. People’s prosocial tendencies and individualistic worldviews, experience with the virus, trust in government, science, and medical professionals, as well as personal and collective efficacy all emerged as significant predictors. With few exceptions, these predictors remained consistent in their relationship with risk perception over time. Lastly, we find that psychological factors are more predictive of risk perception than an objective measure of situational severity, i.e. the number of confirmed COVID-19 cases at the time of data collection. Implications for risk communication are discussed.
Introduction
The COVID-19 pandemic has affected people’s lives across the globe as probably no other single event in recent history. In fact, it has been described as “the most severe global health challenge since the Spanish Flu one century ago” (Cori et al. Citation2020, p. 2). The pandemic has significantly impacted people’s lives around the world over the past year, due both to direct effects of the virus on physical and mental health, as well as indirect economic and social effects as a result of attempts to control its spread. Understanding people’s perceptions of the risks associated with the virus, their reactions to the pandemic, and their behavioural response is therefore important for helping to navigate and manage the global pandemic (Cori et al. Citation2020; Van Bavel et al. Citation2020; Wardman and Lofstedt Citation2020).
Scholars have argued that COVID-19 is a risk that is “unfamiliar, invisible, dreaded, potentially endemic, involuntary, and disproportionally impacts vulnerable populations such as the elderly” (Chakraborty, 2020, p.1). Since the start of the pandemic researchers around the world have begun to investigate the determinants of risk perceptions of COVID-19 (e.g., Abdel Wahed et al. Citation2020; Bruine de Bruin, Saw, and Goldman Citation2020; Ding et al. Citation2020; Dryhurst et al. Citation2020; He et al. Citation2020; Karasneh et al. Citation2021; Liu, Zhang, and Huang Citation2020; Mertens et al. Citation2020; Qian and Li Citation2020; Shao and Hao Citation2020; Zhong et al. Citation2021). Perhaps the largest comparative international study of risk perception is reported by Dryhurst et al. (Citation2020), who found that across ten countries in Europe, America, and Asia people’s personal experience with the virus, their individualistic and prosocial values, trust in government, science, and medical professionals as well as a sense of personal and collective efficacy were among the most important predictors of people’s holistic perception of the risk of COVID-19 (Dryhurst et al. Citation2020).
Dryhurst et al. (Citation2020) also noted that risk perception significantly correlated with self-reported public health compliance in ten countries. Since then, various studies have assessed the factors that influence behavioural response, such as people’s risk perception (Plohl and Musil Citation2021). In fact, scholars have proposed that diverging behavioural responses to the pandemic, such as compliance versus non-compliance with public health mandates, are directly related to differences in risk perceptions (Cori et al. Citation2020). Some empirical work has started to provide evidence for the role of risk perception in predicting and explaining compliance with COVID-19 guidelines (Bruine de Bruin and Bennett Citation2020; Plohl and Musil Citation2021; Savadori and Lauriola Citation2020). For example, Nelson et al. (Citation2020) found a positive association between concern about COVID-19 and self-quarantining behaviour in the US, Canada, and Europe, and Abdelrahman (Citation2020) identified risk perception as a significant predictor of social distancing behaviour in Qatar. Sobkow et al. (Citation2020) reported a relationship between risk perception and intentions to carry out preventative behaviours, such as frequent hand washing or disinfecting of surfaces, in young adults in Poland.
Although important, a significant shortcoming of existing research on risk perception is that it focuses on one point in time or a very narrow time span and does not assess risk perception, behaviour, or their association over time (e.g., Abdel Wahed et al. Citation2020; Ding et al. Citation2020; Dryhurst et al. Citation2020; He et al. Citation2020; Karasneh et al. Citation2021; Liu, Zhang, and Huang Citation2020; Loewenstein and Mather Citation1990; Mertens et al. Citation2020; Qian and Li Citation2020; Shao and Hao Citation2020; Zhong et al. Citation2021). In a fast-changing context such as during a global pandemic, it is important to investigate the stability of proposed models over time, from both a theoretical and practical perspective. On a theoretical level, replicating findings over time provides more confidence in the stability of models of risk perception and in the robustness of the findings. From a practical perspective, it is important to know whether any associations are time-point-specific or whether they are more persistent and durable. This can help in the design of appropriate risk communication strategies. In fact, scholars have highlighted the need for and importance of dynamic and longitudinal studies in risk perception research (Loewenstein and Mather Citation1990; Siegrist, 2013).
To our knowledge, few studies have been published that have investigated elements of risk perception and behavioural response to COVID-19 longitudinally. For example, Bruine de Bruin and Bennett (Citation2020) note that US participants with higher risk perceptions were more likely to take protective action later versus earlier in March 2020, a conclusion the authors arrived at by splitting their sample between those who filled out the survey at the beginning versus the end of the month. Yet the survey itself was still cross-sectional (i.e., conducted at a single time point). We have only been able to identify three truly longitudinal studies that gathered data at more than one time point. The first study was conducted at the beginning of the pandemic in the United States and followed participants over a period of one week finding a significant relationship between risk perception and engagement in protective behaviours (Wise et al. Citation2020). The second study collected data relating to travel risk perception and travel behaviour in the Germany-Austria-Switzerland region at two time points, the first in March 2020 and the second two weeks later (Neuburger and Egger Citation2020). The third study looked at the influence of media exposure on risk perception and protective behaviour in Italy (Rubaltelli et al. Citation2020). Data was collected in two rounds: the first in February 2020, at the beginning of the outbreak in Italy, and the second in March 2020, just after the country had entered a national lockdown. The authors found that the effect of risk perception on protective behaviours was moderated by emotion regulation. As far as we have been able to identify, no studies have yet looked at risk perception and behaviour over a longer timeframe using more data points, so the long-term stability of predictors of risk perception as well as the relationship between perceived COVID-19 risk and behaviour remains unknown.
Current study
The current paper tackles this gap in the existing literature. We surveyed people in the United Kingdom over a period of 10 months. Longitudinal data is generally defined as containing repeated observations of the same set of items (e.g., people, variables). Although the unit of interest is often people, repeated cross-sectional studies of the same variables for different people also constitute a longitudinal design and global time-trends can still be inferred if the variables under consideration are measured with high consistency (Menard Citation1991; Ruspini Citation1999). Here we provide five national quota samples of the UK population, stratified by age, gender, and ethnicity, collected at multiple time points: March (before the first national lock-down and government preventative measures were put in place), May, July, September 2020 (when there were varying levels of government measures and restrictions in place) and January 2021 (during the third national lockdown). Please refer to the supplementary materials for an overview of data collection dates per survey as well as a time line of COVID-19 government measures and restrictions in the UK between March 2020 and January 2021. One limitation of our original approach (Dryhurst et al. Citation2020)Footnote1 to model holistic risk perception as a function of a set of cognitive, experiential, and socio-cultural determinants is that the process underlying the risk perception model is implicitly assumed to be in some state of statistical equilibrium (Coleman Citation1981; Ruspini Citation1999). Accordingly, in the current study, we asked the same questions regarding participants’ risk perceptions and specific behaviours they have taken in response to the pandemic as in Dryhurst et al. (Citation2020) but over five repeated surveys. This rich data allows us to explore levels of risk perception, to model the stability of its psychological predictors, as well as to assess behavioural responses and their relationship with risk perception over time.
Methods
Participants and procedure
We surveyed residents of the United Kingdom over a time frame of 10 months, at five time points: March, May, July, and September 2020, and again in January 2021. Participants were recruited through Prolific (prolific.co) which provided national quota samples stratified by age, gender, and ethnicityFootnote2. We sampled 700 participants for our first data point in March 2020, and more than 1,000 participants for the remaining four data points, amounting to a total sample of N = 6,281 (exact sample sizes per survey and demographic characteristics are listed in Table S3 of the supplementary materials).
Measures
Our previous work (Dryhurst et al. Citation2020) had reported on COVID-19 risk perception around the world using the data collected in March 2020. To enable repeated cross-sectional analyses of risk perception and its predictors, we kept all measures identical for the follow-up surveys. “COVID-19 Risk Perception” was a holistic measure composed of an index encompassing cognitive, affective, and temporal-spatial dimensions of risk perception (six items, pooled across time points αstd = 0.79). We refer the reader to the supplementary materials for a full list of items, correlations, and alphas (see Tables S4 and S5 in the supplementary material).
Psychological predictors
The psychological predictor variables were taken from Dryhurst et al. (Citation2020), and included items on understanding of government strategy (personal knowledge), belief in scientists’ understanding of the virus (social knowledge), direct personal experience with the virus, belief in the importance of doing things for the benefit of others and society even at personal cost (prosocial values), individualistic worldviews (measured via the individualism-communitarianism dimension of Kahan’s cultural cognition scale (Kahan Citation2012)), trust (trust in government, trust in science, trust in medical practitioners/professionals), and efficacy (personal and collective)Footnote3. Some of the predictors were single item measures while some were indices of several items. A complete list of items per predictor variable is available in the supplementary materials (Table S4, supplementary material). Finally, the surveys collected basic demographic variables including gender (binary: male, female), age, political ideology (left-wing/liberal, right-wing/conservative), and education (ranging from “no formal education above 16” to “PhD”). Please see for an overview of the measures including example items for each predictor.
Table 1. Survey measures (example items).
Health protective behaviours
We collected data on a range of health protective behaviours that people could engage in, such as ‘washing hands more often’, ‘using alcohol-based hand sanitizer more often’, or ‘avoiding public transport’. Participants indicated all behaviours they engaged in over the last month and the sum of these behaviours was used for analysis purposesFootnote4. Please refer to the supplementary materials for a full list of items, including details on item inter-correlations, reliabilities, and variable distributions (Tables S4 and S5 and Figure S1 in the supplementary material). In addition to our survey data, we used the open dataset of the Oxford COVID-19 Government Response TrackerFootnote5 to provide UK data on total confirmed new COVID-19 cases recorded on the day prior to each participant completing our surveys, to investigate the potential relationship between this exogenous variable and people’s risk perception of COVID-19.
Results
Risk perception across time
We first investigated risk perception scores in the UK for each of our five successive time points, which varied from a minimum of 4.90 (July 2020) to a maximum of 5.45 (March 2020) on a 7-point scale ().
Figure 1. Risk perception over time in the UK.
Note: Y-axis denotes level of perceived risk (1-low to 7-high). X-axis denotes time points at which survey data was collected. The UK1 data from March 2020 (data depicted in red) serves as the baseline and has been reported in Dryhurst et al. (Citation2020).
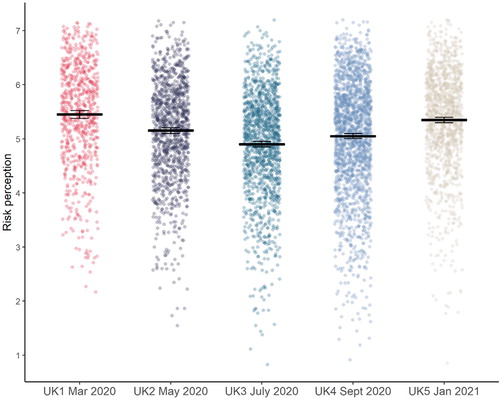
Using a One-Way Analysis of Variance (ANOVA), we found a significant difference between time points in levels of risk perception (F(4, 6275) = 56.31, p<.001, η2 = 0.035). Post-hoc tests using Tukey’s HSD demonstrated significant differences between all time points relative to each other (see supplementary material, Table S6), except between our first time point in March 2020 (M = 5.45, SD = 0.98) and our most recent time point in January 2021 (M = 5.35, SD = 0.91, p = .179). The starkest mean difference was between March 2020 and July 2020 (M = 4.90, SD = 0.97, p <.001, dcorr = 0.56).
Psychological predictors of risk perception
To examine the temporal stability of the predictors that emerged as playing a role in COVID-19 risk perception in Dryhurst et al. (Citation2020), we first ran a linear regression model of our predictors from this previous study, pooled across all of our five survey time points for a general overviewFootnote6 ().
Table 2. Risk perception regression model output.
Gender, political leaning, experience with the virus, prosocial tendencies, relative position on our individualistic worldviews measure, trust in government, science, and medical professionals, as well as personal and collective efficacy all emerged as significant predictors of risk perception in the UK, pooled across our five samples. The only changes between the March 2020 data reported in Dryhurst et al. (Citation2020)—which constitutes the first of the five samples across time reported in this paper—and the pooled data across all five time points, are that personal understanding of the government’s strategy emerged as a significant predictor in the March only model while it is not significant in the pooled model across time points; and political ideology plays a significant role in the pooled model while it did not in March 2020. All other effects remained stable and consistent in direction between the March 2020 model and the model pooled across the full five time points. Specifically, the pooled model shows that predictors of lower risk perception were being male, having no direct experience with COVID-19, being more politically right-wing or conservative, having more individualistic worldviews, higher trust in government and a sense of higher collective efficacy. By contrast, predictors of higher risk perception were being female, having direct experience with COVID-19, having greater prosocial tendencies, higher trust in science and medical professionals, and higher personal efficacy.
Relative contributions of psychological predictors
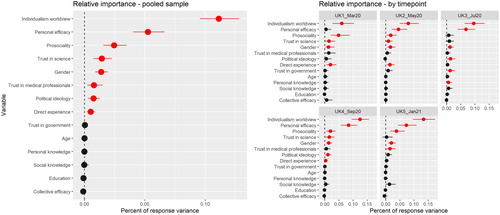
In line with Dryhurst et al. (Citation2020) we used Pratt’s (Pratt Citation1987) variance partitioning method to assess the relative importance of each of our predictors in the regression model in further detail. This method provides more robust insights into the importance of variables than does comparing betas in the regression output alone (Darlington Citation1968; Pratt Citation1987; Tonidandel and LeBreton Citation2011; van der Linden Citation2015). shows the relative contributions of each predictor variable to the adjusted R2 for the pooled and per time point models. The extent to which people hold individualistic worldviews was the most important predictor of risk perception in the pooled as well as all time point models, explaining 11.13% (95% CI [9.59, 12.81]) of the variance in our pooled model. The second most important predictor in the pooled model was our measure of personal efficacy (5.25% [4.02, 6.62]). It was also the second most important predictor in all time point models, except for March 2020, where it did not emerge as a significant predictor of risk perception in the UK. Prosociality emerged as the third most important predictor of risk perception in the pooled model (2.45% [1.58, 3.49]), and was also a consistently important predictor in all individual surveys, except in July of 2020. We refer the reader to Table S7 (supplementary material) for detailed results of the variance decomposition analysis for the pooled and by time point models.
Figure 2. Relative importance of individual predictors for the pooled model (all five time points combined) and models per time point (all five surveys separately).
Note: Error bars denote 1,000 bootstrapped 95% confidence intervals. Confidence intervals that do not include zero are depicted in red. The figure visualizes the percent that each variable contributes out of the total variance explained.
Changes in predictors of risk perception over time
To explore possible changes in the relationship between risk perception and the various predictors over time, we next fitted the same model where each predictor interacts with time point as a five-level factor. Our measures of experience with the virus, individualistic worldviews, trust in government, scientists and medical professionals, collective efficacy, gender and political ideology did not vary in their nature as significant predictors across the five time points. However, our measures of prosociality (p = .017) and personal efficacy (p < .001) did show variation over time, as indicated by significant interactions with time in our model which persisted after adjustment for multiple comparisons in the post-hoc testing. Please see supplementary material (Tables S8 and S9) for the full results of the interaction model.
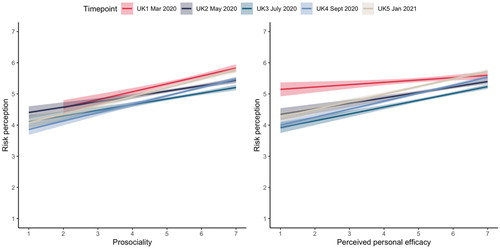
Post-hoc tests revealed that while prosociality was positively related to risk perception for all time points, there was a significant difference in the strength of the relationship between March and July 2020 (padj = .008). The relationship was stronger in March compared to July, meaning that a given increase in prosociality was associated with a larger increase in risk perception in March than in July. The role of personal efficacy showed the biggest differences between time points. Although personal efficacy was positively related to risk perception across all time points, the strength of the relationship varied significantly between March and all other time points, i.e., May 2020 (padj = .019), July 2020 (padj < .001), September 2020 (padj < .001), and January 2021 (padj = .029), such that a given increase in personal efficacy was associated with a smaller increase in risk perception in March than in all other months ().
Figure 3. Panel plot for significant time by predictor interactions in risk perception model.
Note: Interaction between time and prosociality depicted on the left hand side. Interaction between time and perceived personal efficacy depicted on the right hand side. Y-axis denotes level of perceived risk (1-low to 7-high). X-axis denotes level of prosociality (left panel) and level of perceived personal efficacy (right panel). Survey time points are depicted in the colour legend on top of the panel. The UK1 data from March 2020 that has been reported in Dryhurst et al. (Citation2020) is depicted in red in both panels.
Confirmed COVID-19 cases and relationship to risk perception
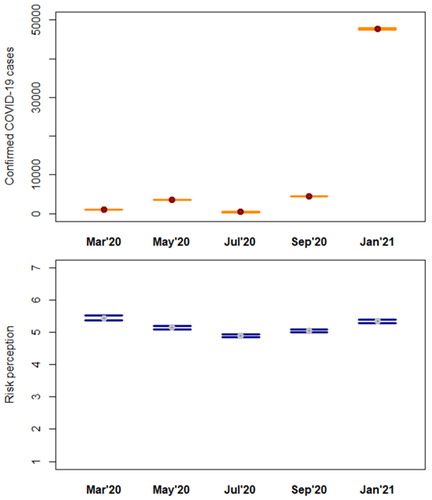
Since the number of confirmed COVID-19 cases has played an important role in the media and public discourse throughout the pandemic (e.g., through discussions of the ‘R’ number), we wanted to explore whether there was a relationship between the number of reported confirmed COVID-19 cases and people’s risk perception. We found a significant positive correlation, albeit small, between confirmed COVID-19 cases and people’s reported risk perception level (r = 0.10, t = 8.36, df = 6278, p < .001)Footnote7. Similar to Wong and Sam (Citation2010) who studied the relationship between people’s psychobehavioural responses to the 2009 H1N1 influenza outbreak in Malaysia and reported deaths, we visualize confirmed COVID-19 cases and risk perception in . As shows, while the two are correlated, risk perception did not vary in complete unison with new cases across time. For instance, while cases went up from March to May, risk perception went down. Overall, there is a positive trend, with risk perception rising as cases are rising (at least within the scope of our sampled time points). Of interest is also that although cases rose steeply between our September 2020 and January 2021 samples, the rise in risk perception between those time points was comparatively smaller.
Figure 4. Risk perception and confirmed COVID-19 cases per time point.
Note: Y-axis denotes number of confirmed COVID-19 cases (upper panel) and level of perceived risk (1-low to 7-high) (lower panel). X-axis denotes time points at which survey data was collected. Data points show means and 95% confidence intervals.
Of greater interest was to explore the role that confirmed COVID-19 cases would play for risk perception in light of our psychological predictors. We therefore included confirmed cases as an additional covariate in our psychological predictor model. Confirmed COVID-19 cases emerged as a significant predictor in the model, being positively related to risk perception (). All previously observed effects in the psychological predictor model remained consistent. We also explored the relative importance of the different variables in the model. Pratt’s decomposition analyses (Pratt Citation1987) demonstrated that while confirmed COVID-19 cases are a significant predictor of risk perception in the model, the importance of other psychological variables is larger. Individualism worldviews, personal efficacy, and prosociality still emerged as the three most important predictors of risk perception, explaining the most variance (, and supplementary material, Table S10).
Figure 5. Relative importance of psychological predictors and confirmed COVID-19 cases for the pooled model (all five time points combined).
Note: Error bars denote 1,000 bootstrapped 95% confidence intervals. Confidence intervals that do not include zero are depicted in red. The figure visualizes the percent that each variable contributes out of the total variance explained.
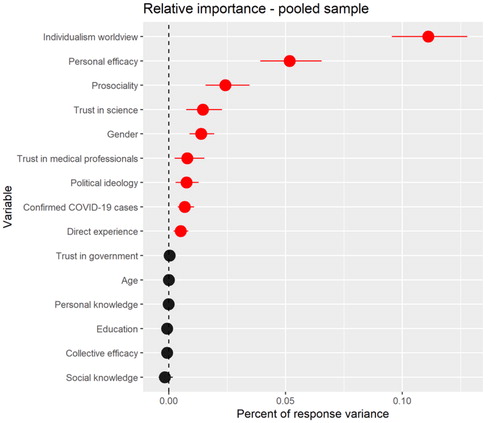
Table 3. Risk perception predictor model including COVID-19 cases.
Health protective behaviours over time
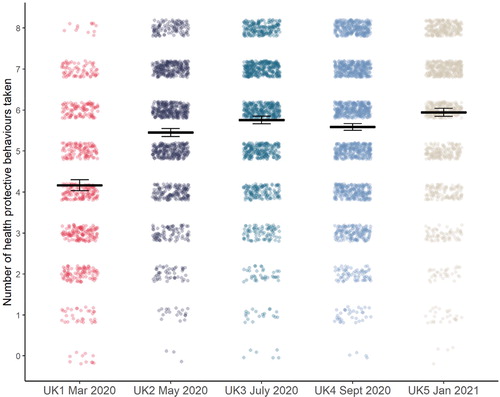
We next analysed people’s reported health protective behaviours over time (). One-way Analysis of Variance (ANOVA) revealed a significant difference between time points (F(4, 6263) = 128.96, p<.001, η2 = 0.076). Post-hoc testing using Tukey HSD showed significant differences in behaviour between time points, except between May 2020 (M = 5.45, SD = 1.68) and September 2020 (M = 5.59, SD = 1.81, p = .233), as well as between July 2020 (M = 5.76, SD = 1.71) and September 2020 (p = .050), and July 2020 and January 2021 (M = 5.94, SD = 1.78, p = .061) (see supplementary material, Table S11 for full results). The biggest difference for consecutive time points was between March (pre lock-down and national measures) and May 2020 (when restrictions started to gradually ease) with a substantial increase in protective behaviours (dHedges’ corrected=0.73). Notably, except for a dip in September 2020, the data shows a constant increase in protective behaviours between March 2020 and January 2021.
Figure 6. Health protective behaviours over time in the UK.
Note: Y-axis denotes number of actions taken ranging from 0 to 8. X-axis denotes time points at which survey data was collected. The UK1 data from March 2020 (data depicted in red) has been reported in Dryhurst et al. (Citation2020).
Relationship between health behaviours and risk perception over time
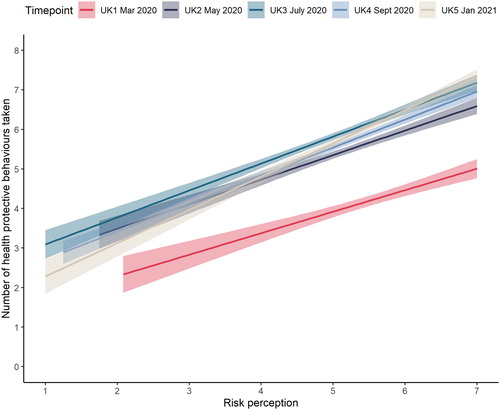
We were interested in investigating the relationship between people’s reported health protective behaviours and their levels of risk perception. We first looked at the relationship between the two variables in our whole sample, i.e. pooled across time points. Regressing health protective behaviours on risk perception revealed a significant positive association between the two variables (b = 0.63, SE = 0.02, p < .001, model R2 = 0.11). We next set to investigate possible changes in the relationship over time. Analysis of Covariance (ANCOVA), modelling time point as a five level factor and risk perception as a continuous covariate, revealed a significant interaction between risk perception and time on health protective behaviours (F(4, 6257) = 4.08, p = .003, partial η2 = 0.003). Across all time points there was a positive relationship between risk perception and reported health protective behaviours, meaning higher levels of risk perception were associated with higher amounts of protective behaviours. However, the strength of the association varied by time point. Specifically, we found a significant difference between March 2020 and January 2021 (padj = .002), as well as between May 2020 and January 2021 (padj = .021) (see supplementary material, Table S12 for full interaction analysis results). The relationship between risk perception and behaviour was significantly stronger in January 2021 than it was in March and May 2020, such that an increase in risk perception of one unit was associated with a larger increase in protective health behaviours in January 2021 than in March and May 2020. Also of note is that the association between risk perception and health protective behaviours was strongest in January 2021 out of all our sampled time points, meaning that a one unit increase in risk perception was associated with the largest increase in protective behaviours in January 2021 ().
Figure 7. Plot of time by risk perception interaction on health protective behaviours.
Note: Y-axis denotes number of health protective behaviours taken (0-8). X-axis denotes level of perceived risk (1-low, 7-high). Survey time point depicted in color legend on top of the panel.
Discussion
Cross-sectional research on risk perception is like a snapshot of a scene. It gives an overall picture, but provides no information about how the scene is evolving over time. Thus a snapshot can present a highly selective or even misleading image if the landscape it depicts is changing over time. Time series research, on the other hand, is like a movie; it provides information about how a scene changes over time, but often fails to present the big picture.
(Loewenstein and Mather Citation1990, p.173)
Risk perception over time
Across five surveys conducted between March 2020 and January 2021 we investigated people’s risk perception of COVID-19 and behavioural response in the United Kingdom. For both risk perception and behaviour our data showed a number of interesting changes over the timeframe. Risk perception generally remained high with means between 4.9 (July 2020) and 5.45 (March 2020) on a 7-point scale for the various time points. However, there have been significant fluctuations in risk perception between time points. Risk perception levels were high in March 2020, then dropped consistently in our May and July 2020 samples, to then rise again in September 2020 and January 2021. In fact, reported risk perception in our samples was consistently and significantly different between all consecutive time points.
This illustrates that risk perception is a dynamic process (Loewenstein and Mather Citation1990). Of particular note here is that risk perception in January 2021 was at the same level as almost a year earlier, in March 2020, at the onset of the pandemic in the UK (the difference in risk perception levels between these two time points was non-significant). The decline in risk perception levels between March and the summer of 2020 could be a reflection of the first national lockdown in the UK which took place between March and July 2020 (with partial ‘easing’ of restrictions from May onwards, to the complete lifting of lockdown in July). The autumn then started seeing a renewed uptick in infections, with another national lockdown in November 2020 and again in December 2020 extending into January 2021 (ongoing at the time of writing) in an attempt to control infection rates. The new B1.1.7. variant which was announced in December 2020, and its effects on prevalence and deaths might have played an additional role in the heightened perception of risk observed in our January 2021 survey.
Health protective behaviours over time
The adoption of health protective behaviours in the United Kingdom also shows a changing pattern along our sampled time points. Reported levels of protective behaviours were lowest in March 2020, our first data point at the beginning of the pandemic, with a general increase in behaviours towards January 2021, which revealed the highest observed level of all of our samples, and a slight plateau in between (as shown through a non-significant difference between our July and September 2020 samples). Since our behavioural index does not include items mandated by official rules (such as guidelines surrounding social gatherings) but represents behaviours that are at the discretion of each individual, the increase in reported health protective behaviours suggests that people in the UK—at least in our surveyed samples—have increased their own personal actions voluntarily in response to the pandemic threat.
Predictors of risk perception
With regards to the psychological and socio-demographic predictors of risk perception our combined data set encompassing all five surveys revealed a pattern remarkably consistent with the first survey, reported in Dryhurst et al. (Citation2020). Participants’ prosocial tendencies and the extent to which they hold individualistic worldviews, their experience with the virus, trust in government, science, and medical professionals, as well as perceptions of personal and collective efficacy all correlated significantly with risk perception in the pooled data. Higher prosocial tendencies, trust in science and medical professionals, and personal efficacy were associated with higher levels of risk perception, while higher individualistic worldviews, trust in government, and collective efficacy were associated with lower risk perception. Males also consistently reported lower risk perception than females. Direct personal experience with the virus was related to higher risk perception. This finding is in line with results reported in Dryhurst et al. (Citation2020), as well as Qian and Li (Citation2020) who reported a positive link between risk involvement and increased risk perception in China. Understanding of the government strategy (personal knowledge) and belief in scientist’s understanding of the virus (social knowledge) were not significantly related to risk perception in our model. Although studies on COVID-19 have reported associations between knowledge and risk perception (Zhong et al. Citation2021), our data—both at the onset of the pandemic in the UK (Dryhurst et al. Citation2020) as well as longitudinally over the course of a year reported here—suggests that socio-cultural and experiential factors play a larger role for risk perception compared to more ‘objective’ and cognitive factors, such as personal knowledge and COVID-19 case reports. This finding is consistent with work on “risk as feelings”, i.e. accounts that the affective system often dominates human risk response (Leiserowitz Citation2006; Loewenstein et al. Citation2001; Slovic et al. Citation2004; van der Linden Citation2014; van der Linden Citation2015; Weber Citation2006), including in the context of other risks, such as climate change (e.g. see Leiserowitz Citation2006; van der Linden Citation2015; Xie et al. Citation2019).
Interestingly, political leaning was not a significant predictor in our model in March 2020 (Dryhurst et al. Citation2020), however, our results here show a significant influence of political ideology on risk perception in the later stages of the pandemic (July 2020 onwards), as well as in the pooled model across time. Specifically, results indicate that those with a more conservative or right-wing ideology tended to report lower levels of risk perception. These findings are in line with other recent work on the relationship between political ideology and risk perception surrounding COVID-19 in the US (e.g., Bruine de Bruin, Saw, and Goldman Citation2020; Calvillo et al. Citation2020, Kerr et al. Citation2020). The gender effect (males being less concerned) is consistent with Dryhurst et al. (Citation2020) for our March 2020 data, as well as with recent findings on the link between gender and risk perception of COVID-19 specifically (e.g., Ding et al. Citation2020; Karasneh et al. Citation2021) and with other findings on gender effects in the risk perception literature more generally (e.g., Finucane et al. Citation2000).
Relative importance of predictor variables of risk perception
Potentially more interesting than ‘raw’ associations between predictor variables and risk perception, are the results reported for the relative importance of our variables. The extent to which people hold individualistic worldviews explained most of the variance in our pooled model, followed by their feelings of personal efficacy, and prosocial tendencies. Trust in science ranked four and gender fifth. Interestingly, the importance of direct personal experience with the virus dropped in our overall model compared to the March 2020 data (Dryhurst et al. Citation2020).
Changes in predictors of risk perception over time
In addition to assessing predictors of risk perception in our overall dataset, we investigated potential changes over time. Our data showed that prosociality and personal efficacy varied in their relationship with risk perception between our various surveys, as evidenced by a significant interaction with time for both predictor variables. Prosociality showed a stronger relationship with risk perception in March compared to July 2020, and for personal efficacy the relationship with risk perception was significantly different between March 2020, the onset of the pandemic in the UK, and all subsequent time points we sampled. This could possibly be due to an enhanced awareness of prosocial values and their importance for tackling the spread of COVID-19 at the beginning of the pandemic, as people ‘pulled together’ for the common cause. An increase in government messaging about personal actions to limit the spread of the virus, which started as part of the national lockdown after our first survey, may have affected the relationship between people’s sense of personal efficacy and risk perception over time.
Risk perception – behaviour relationship over time
Looking at the relationship between risk perception and health protective behaviours over time we consistently find a positive relationship, i.e. higher risk perception is associated with more reported health behaviours. We also find a significant interaction with time. Risk perception and behaviour were more strongly correlated in January 2021 compared to both March and May 2020, suggesting that later in the pandemic a given increase in risk perception was associated with a larger increase in reported health behaviours compared to earlier in the pandemic. These findings are generally consistent with the literature that has highlighted the important link between risk perception and health protective behaviours, both generally and during pandemics (Abdelrahman Citation2020; Bish and Michie Citation2010; Bruine de Bruin and Bennett Citation2020; Floyd, Prentice-Dunn, and Rogers Citation2000; Nelson et al. Citation2020; Plohl and Musil Citation2021; Rudisill Citation2013; Savadori and Lauriola Citation2020; Sobkow et al. Citation2020; van der Weerd et al. Citation2011; Wise et al. Citation2020).
External versus psychological predictors of risk perception
It is also noteworthy that when including the number of confirmed COVID-19 cases in our pooled psychological predictor model, all significant effects previously observed (in the psychological predictor model), remained significant and effects did not change direction. Our results furthermore suggest that personal and socio-cultural psychological predictors play a more important role for risk perception than an objective measure of situational severity. Overall, these results speak to the relative importance and stability of personal and socio-cultural dimensions in explaining COVID-19 risk perceptions over time. Descriptively, risk perception tracked COVID-19 cases over time in our data, except for one disparity; when cases went up from March to May, risk perception went down. This overall pattern is in line with findings by Loewenstein and Mather (Citation1990) who state that “for a variety of problems, subjective risk perceptions track the objective levels of problems surprisingly closely” (p.173). However, regarding the magnitude of the descriptive trends in our data, we find that risk perception did not mirror changes in the number of confirmed COVID-19 cases exactly. For instance, we observed that while confirmed cases rose steeply between September 2020 and January 2021, the increase in risk perception between the two time points was comparatively small. This observation may point to other factors playing a larger role in shaping risk perception, apart from objective situational severity. Raude et al. (Citation2019), who investigated risk perception of an epidemic of mosquito-borne disease in French Guiana over time, suggest risk habituation effects as one such potential factor.
Limitations and future research
Of course, our research is not without limitations. First, we rely on correlational and not experimental data. All findings presented are therefore associations and we cannot claim causality (or directionality). We do not know, for instance, whether risk perception drives behaviour or vice versa (or both), especially because we did not repeatedly survey the same individuals. Future work could examine the direction of the risk perception-behaviour link over time. Importantly, other work that has looked at the relationship between risk perception and behaviour on COVID-19 does suggest risk perception as an antecedent of behaviour (Savadori and Lauriola Citation2020), but the use of cross-lagged panel models would allow for a more detailed examination.
Second, although we use national quota samples for all of our surveys, we did not obtain true probability samples. We thus cannot draw conclusions about how our observed effects would play out in populations who are not traditionally included in survey research. We note however, that our research is based on relatively high-quality samples compared to other research conducted on coronavirus perceptions which has primarily relied on student (e.g., Ding et al. Citation2020; Sobkow et al. Citation2020) or online convenience samples (e.g., Nelson et al. Citation2020), leading to non-representative distributions on, for instance, gender and ethnicity as noted by the authors (Karasneh et al. Citation2021; Nelson et al. Citation2020).
Third, for the presented analyses of confirmed COVID-19 cases an important limitation to keep in mind is that it is an exogenous, not a psychological variable. In other words, we did not measure people’s perceptions of the number of confirmed cases at the time they took the survey. It might be that people were not aware of the number of cases as they completed the survey or that they thought it was different from the actual number used in the model. Results may therefore differ if an assessment of each participants’ perception of the COVID-19 case number had been included in the surveys. Lastly, our surveys across time were not taken from the same people but from independent samples. Hence, any trends across time and any comparisons we draw between time points have to be evaluated in that light: They constitute a snapshot of the overall sampled population at each time point, but it is not a repeated assessment of how risk perception and behaviour have changed in the same people over time.
Conclusion
In this paper we relied on five surveys assessing risk perception and health protective behaviours related to COVID-19 in the UK over a timeframe of nearly a year, which provides important insights into how the public has perceived and reacted to the pandemic. Our work goes beyond traditional cross-sectional research by assessing the stability of a psychological risk perception model over time and thereby makes an important contribution to the literature on predictors of risk perception in an emotive context and its relationship to health protective behaviours. For example, we found that socio-cultural factors may play more of a role in risk perception than knowledge and objective information, and that these conclusions remain robust and generalizable over time. Risk communicators can benefit from these insights about the underpinnings of people’s psychological reactions to the pandemic in their development of risk communication strategies. For example, our results suggest that risk perception is not primarily shaped by the objective severity of the situation but rather by a host of psychological considerations, including people’s values and worldviews and the degree to which people feel they can make a difference to reduce the spread of the virus. Moreover, our data show that while health protective behaviours are indeed linked to risk perception, other factors are likely to play a role as well given that risk perception only explained about 11% of the variance in health behaviour pooled across waves. Although risk communicators may be tempted to try to increase perception of the risk of COVID-19 as a means of ramping up greater protective behaviour in the population, we caution that a fearful population is not necessarily a desirable endpoint. Risk is dynamic and public risk perception may be underestimating or overestimating (panic) the actual risk at different times. We therefore encourage evidence-based risk communication and urge future research to paint a more complete picture of the drivers and inhibitors of health protective behaviours to help with the development of appropriate risk communication strategies.
Supplemental Material
Download MS Word (858.6 KB)Acknowledgments
We would like to thank all the participants and those who helped to administer the study.
Data Availability Statement
All data are publicly available on the Open Science Framework (OSF) website: https://osf.io/jnu74
Disclosure statement
No potential conflict of interest was reported by the author(s).
Additional information
Funding
Notes
1 Because the same constructs were not consistently included in each follow-up survey for each of the ten countries included in the original paper from Dryhurst et al. (Citation2020), we decided to focus only on the country for which we have high consistency in the repeated measurements: the United Kingdom.
2 We note that while all set quotas were largely met in the earlier rounds of the survey, some age quotas set by the provider were not fully met in the later rounds of data collection. As we fit age as a predictor in our main models, we don’t believe this to be a significant concern for our results.
3 One item from the predictor list used for the March 2020 survey in Dryhurst et al. (Citation2020) was dropped and not collected in subsequent survey rounds: social amplification of risk through friends and family. This item asked participants whether they had received information about COVID-19 from friends and family. This measure was deemed appropriate during the initial phase of the pandemic, but dropped later on as we assumed that most people would have heard about the virus from their social circles by then.
4 The full list of behaviours, which was designed in March 2020, included items which have since been externally mandated at times (e.g., during full lockdowns), such as ‘avoiding social events (e.g., parties, family gatherings)’, ‘eating out less at restaurants’, and ‘staying home from work’. To avoid a potential confound for our analysis over time, these items were excluded from the list, and only voluntary behaviours were used for analysis. Please see the results for an analysis using all behavioural items in the supplementary materials. Results were largely in line with the voluntary behavioural index presented here, except that the interaction between health behaviours and risk perception over time did not stay significant in the post-hoc testing phase when adjusting for multiple comparisons.
6 For all reported models, we assessed multi-collinearity between variables, as well as homogeneity of variance, normality of residual distributions, and the presence of influential outliers. Please refer to the supplementary materials (section ‘Model Diagnostics’) for the results of these analyses.
7 Results of a non-parametric correlation analysis, performed as a robustness check, were in line with the parametric findings. Spearman’s rank correlation rho = 0.10, p < .001. Please note that we also investigated all reported analyses for the COVID-19 cases-risk perception relationship using deaths instead of cases. Results for deaths are in line with the reported results for cases.
8 Participants were given a broad range of possible answers. Those who reported they had tested positive for the virus, or suspected that they were infected were coded as having direct experience with the COVID-19 virus. Suspected infections were included here as many countries did not undertake tests for low risk cases in the early months of the pandemic. The coding followed Dryhurst et al. (Citation2020) for comparability.
References
- Abdel Wahed, W. Y., E. M. Hefzy, M. I. Ahmed, and N. S. Hamed. 2020. “Assessment of Knowledge, Attitudes, and Perception of Health Care Workers Regarding COVID-19, a Cross-Sectional Study from Egypt.” Journal of Community Health 45 (6): 1242–1251. doi:https://doi.org/10.1007/s10900-020-00882-0.
- Abdelrahman, M. 2020. “Personality Traits, Risk Perception, and Protective Behaviors of Arab Residents of Qatar during the COVID-19 Pandemic.” International Journal of Mental Health and Addiction. doi:https://doi.org/10.1007/s11469-020-00352-7.
- Bish, A., and S. Michie. 2010. “Demographic and Attitudinal Determinants of Protective Behaviours during a Pandemic: A Review.” British Journal of Health Psychology 15 (Pt 4): 797–824. doi:https://doi.org/10.1348/135910710X485826.
- Bruine de Bruin, W., and D. Bennett. 2020. “Relationships between Initial COVID-19 Risk Perceptions and Protective Health Behaviors: A National Survey.” American Journal of Preventive Medicine 59 (2): 157–167. doi:https://doi.org/10.1016/j.amepre.2020.05.001.
- Bruine de Bruin, W., H.-W. Saw, and D. P. Goldman. 2020. “Political Polarization in US Residents’ COVID-19 Risk Perceptions, Policy Preferences, and Protective Behaviors.” Journal of Risk and Uncertainty 61 (2): 177–194. doi:https://doi.org/10.1007/s11166-020-09336-3.
- Calvillo, D. P., B. J. Ross, R. J. B. Garcia, T. J. Smelter, and A. M. Rutchick. 2020. “Political Ideology Predicts Perceptions of the Threat of COVID-19 (and Susceptibility to Fake News about It).” Social Psychological and Personality Science 11 (8): 1119–1128. doi:https://doi.org/10.1177/1948550620940539.
- Coleman, J. S. 1981. Longitudinal Data Analysis. New York, NY: Basic Books.
- Cori, L., F. Bianchi, E. Cadum, and C. Anthonj. 2020. “Risk Perception and COVID-19.” International Journal of Environmental Research and Public Health 17 (9): 3114. doi:https://doi.org/10.3390/ijerph17093114.
- Darlington, R. B. 1968. “Multiple Regression in Psychological Research and Practice.” Psychological Bulletin 69 (3): 161–182. doi:https://doi.org/10.1037/h0025471.
- Ding, Y., X. Du, Q. Li, M. Zhang, Q. Zhang, X. Tan, and Q. Liu. 2020. “Risk Perception of Coronavirus Disease 2019 (COVID-19) and Its Related Factors Among College Students in China during Quarantine.” Plos ONE 15 (8): e0237626. doi:https://doi.org/10.1371/journal.pone.0237626.
- Dryhurst, S., C. R. Schneider, J. Kerr, A. L. J. Freeman, G. Recchia, A. M. van der Bles, D. Spiegelhalter, and S. van der Linden. 2020. “Risk Perceptions of COVID-19 Around the World.” Journal of Risk Research 23 (7/8): 994–4461. doi:https://doi.org/10.1080/13669877.2020.1758193.
- Finucane, M. L., P. Slovic, C. K. Mertz, J. Flynn, and T. A. Satterfield. 2000. “Gender, Race, and Perceived Risk: The “White Male” Effect.” Health, Risk and Society 2 (2): 159–172. doi:https://doi.org/10.1080/713670162.
- Floyd, D. L., S. Prentice-Dunn, and R. W. Rogers. 2000. “A Meta-Analysis of Research on Protection Motivation Theory.” Journal of Applied Social Psychology 30 (2): 407–429. doi:https://doi.org/10.1111/j.1559-1816.2000.tb02323.x.
- He, S., S. Chen, L. Kong, and W. Liu. 2020. “Analysis of Risk Perceptions and Related Factors concerning COVID-19 Epidemic in Chongqing, China.” Journal of Community Health doi:https://doi.org/10.1007/s10900-020-00870-4.
- Kahan, D. M. 2012. “Cultural Cognition as a Conception of the Cultural Theory of Risk.” In Handbook of Risk Theory: Epistemology, Decision Theory, Ethics, and Social Implications of Risk, edited by S. Roeser, R. Hillerbrand, P. Sandin, M. Peterson, 725–759. Dordrecht, NL: Springer. doi:https://doi.org/10.1007/978-94-007-1433-5_28.
- Karasneh, R., S. Al-Azzam, S. Muflih, O. Soudah, S. Hawamdeh, and Y. Khader. 2021. “Media’s Effect on Shaping Knowledge, Awareness Risk Perceptions and Communication Practices of Pandemic COVID-19 among Pharmacists.” Research in Social and Administrative Pharmacy 17 (1): 1897–1902. doi:https://doi.org/10.1016/j.sapharm.2020.04.027.
- Kerr, J. R., C. R. Schneider, G. Recchia, S. Dryhurst, U. Sahlin, C. Dufouil, P. Arwidson, A. L. J. Freeman, and S. van der Linden. 2020. “Predictors of COVID-19 Vaccine Acceptance across Time and Countries.” MedRxiv. The Preprint Server for Health Sciences 1–39.
- Leiserowitz, A. 2006. “Climate Change Risk Perception and Policy Preferences: The Role of Affect, Imagery, and Values.” Climatic Change 77 (1/2): 45–72. doi:https://doi.org/10.1007/s10584-006-9059-9.
- Liu, M., H. Zhang, and H. Huang. 2020. “Media Exposure to COVID-19 Information, Risk Perception, Social and Geographical Proximity, and Self-Rated Anxiety in China.” BMC Public Health 20 (1): 1649. doi:https://doi.org/10.1186/s12889-020-09761-8.
- Loewenstein, G., and J. Mather. 1990. “Dynamic Processes in Risk Perception.” Journal of Risk and Uncertainty 3 (2): 155–175. doi:https://doi.org/10.1007/BF00056370.
- Loewenstein, G. F., E. U. Weber, C. K. C. Hsee, N. Welch, E. U. Weber, and N. Welch. 2001. “Risk as Feelings.” Psychological Bulletin 127 (2): 267–286. doi:https://doi.org/10.1037/0033-2909.127.2.267.
- Menard, S. 1991. Longitudinal Research. Newbury Park: Sage Publications.
- Mertens, G., L. Gerritsen, S. Duijndam, E. Salemink, and I. M. Engelhard. 2020. “Fear of the Coronavirus (COVID-19): Predictors in an Online Study Conducted in March 2020.” Journal of Anxiety Disorders 74: 102258. doi:https://doi.org/10.1016/j.janxdis.2020.102258.
- Nelson, B. W., A. Pettitt, J. E. Flannery, and N. B. Allen. 2020. “Rapid Assessment of Psychological and Epidemiological Correlates of COVID-19 Concern, Financial Strain, and Health-Related Behavior Change in a Large Online Sample.” PLoS ONE 15 (11): e0241990. (11 November). doi:https://doi.org/10.1371/journal.pone.0241990.
- Neuburger, L., and R. Egger. 2020. “Travel Risk Perception and Travel Behaviour during the COVID-19 Pandemic 2020: A Case Study of the DACH Region.” Current Issues in Tourism 1–14. doi:https://doi.org/10.1080/13683500.2020.1803807.
- Plohl, N., and B. Musil. 2021. “Modeling Compliance with COVID-19 Prevention Guidelines: The Critical Role of Trust in Science.” Psychology, Health & Medicine 26 (1): 1–12. doi:https://doi.org/10.1080/13548506.2020.1772988.
- Pratt, J. W. 1987. “Dividing the Indivisible: Using Simple Symmetry to Partition Variance Explained.” Proceedings of the Second International Tampere Conference in Statistics, 245–260.
- Qian, D., and O. Li. 2020. “The Relationship between Risk Event Involvement and Risk Perception during the COVID-19 Outbreak in China.” Appl Psychol Health Well Being 12 (4): 983–999. doi:https://doi.org/10.1111/aphw.12219.
- Raude, J., K. MCColl, C. Flamand, and T. Apostolidis. 2019. “Understanding Health Behaviour Changes in Response to Outbreaks: Findings from a Longitudinal Study of a Large Epidemic of Mosquito-Borne Disease.” Social Science & Medicine (1982) 230 (April): 184–193. doi:https://doi.org/10.1016/j.socscimed.2019.04.009.
- Rubaltelli, E., E. Tedaldi, N. Orabona, and S. Scrimin. 2020. “Environmental and Psychological Variables Influencing Reactions to the COVID-19 outbreak.” British Journal of Health Psychology 25 (4): 1020–1038. doi:https://doi.org/10.1111/bjhp.12473.
- Rudisill, C. 2013. “How Do we Handle New Health Risks? Risk Perception, Optimism, and Behaviors regarding the H1N1 Virus.” Journal of Risk Research 16 (8): 959–980. doi:https://doi.org/10.1080/13669877.2012.761271.
- Ruspini, E. 1999. “Longitudinal Research and the Analysis of Social Change.” Quality and Quantity 33 (3): 219–227. doi:https://doi.org/10.1023/A:1004692619235.
- Savadori, L., and M. Lauriola. 2020. “Risk Perception and Protective Behaviors during the Rise of the COVID-19 Outbreak in Italy.” Frontiers in Psychology 11: 577331. doi:https://doi.org/10.3389/fpsyg.2020.577331.
- Shao, W., and F. Hao. 2020. “Confidence in Political Leaders Can Slant Risk Perceptions of COVID-19 in a Highly Polarized Environment.” Social Science Medicine 261: 113235. doi:https://doi.org/10.1016/j.socscimed.2020.113235.
- Slovic, P., M. L. Finucane, E. Peters, and D. G. MacGregor. 2004. “Risk as Analysis and Risk as Feelings: Some Thoughts About Affect, Reason, Risk, and Rationality.” Risk Analysis : An Official Publication of the Society for Risk Analysis 24 (2): 311–322. doi:https://doi.org/10.1111/j.0272-4332.2004.00433.x.
- Sobkow, A., T. Zaleskiewicz, D. Petrova, R. Garcia-Retamero, and J. Traczyk. 2020. “Worry, Risk Perception, and Controllability Predict Intentions toward COVID-19 Preventive Behaviors.” Frontiers in Psychology 11: 582720. doi:https://doi.org/10.3389/fpsyg.2020.582720.
- Tonidandel, S., and J. M. LeBreton. 2011. “Relative Importance Analysis: A Useful Supplement to Regression Analysis.” Journal of Business and Psychology 26 (1): 1–9. doi:https://doi.org/10.1007/s10869-010-9204-3.
- Van Bavel, J. J., K. Baicker, P. S. Boggio, V. Capraro, A. Cichocka, M. Cikara, M. J. Crockett, et al. 2020. “Using Social and Behavioural Science to Support COVID-19 Pandemic response.” Nature Human Behaviour 4 (5): 460–471. doi:https://doi.org/10.1038/s41562-020-0884-z.
- Van Der Linden, S. 2014. “On the Relationship between Personal Experience, Affect and Risk Perception: The Case of Climate Change.” European Journal of Social Psychology 44 (5): 430–440. doi:https://doi.org/10.1002/ejsp.2008.
- van der Linden, Sander. 2015. “The Social-Psychological Determinants of Climate Change Risk Perceptions: Towards a Comprehensive Model.” Journal of Environmental Psychology 41: 112–124. doi:https://doi.org/10.1016/j.jenvp.2014.11.012.
- Van Der Weerd, W.,. D. R. M. Timmermans, D. J. M. A. Beaujean, J. Oudhoff, and J. E. Van Steenbergen. 2011. “Monitoring the Level of Government Trust, Risk Perception and Intention of the General Public to Adopt Protective Measures during the Influenza A (H1N1) Pandemic in The Netherlands.” BMC Public Health 11 (1) doi:https://doi.org/10.1186/1471-2458-11-575.
- Wardman, J. K., and R. Lofstedt. 2020. “COVID-19: confronting a New World Risk.” Journal of Risk Research 23 (7/8): 833–837. doi:https://doi.org/10.1080/13669877.2020.1842988.
- Weber, E. U. 2006. “Experience-Based and Description-Based Perceptions of Long-Term Risk: Why Global Warming Does Not Scare us (yet).” Climatic Change 77 (1/2): 103–120. doi:https://doi.org/10.1007/s10584-006-9060-3.
- Wise, T., T. D. Zbozinek, G. Michelini, C. C. Hagan, and D. Mobbs. 2020. “Changes in Risk Perception and Self-Reported Protective Behaviour during the First Week of the COVID-19 Pandemic in the United States.” Royal Society Open Science 7 (9): 200742. doi:https://doi.org/10.1098/rsos.200742.
- Wong, L. P., and I. C. Sam. 2010. “Temporal Changes in Psychobehavioral Responses during the 2009 H1N1 Influenza pandemic.” Preventive Medicine 51 (1): 92–93. doi:https://doi.org/10.1016/j.ypmed.2010.04.010.
- Xie, B., M. B. Brewer, B. K. Hayes, R. I. McDonald, and B. R. Newell. 2019. “Predicting Climate Change Risk Perception and Willingness to Act.” Journal of Environmental Psychology 65: 101331. doi:https://doi.org/10.1016/j.jenvp.2019.101331.
- Zhong, Y., W. Liu, T.-Y. Lee, H. Zhao, and J. Ji. 2021. “Risk Perception, Knowledge, Information Sources and Emotional States among COVID-19 Patients in Wuhan, China.” Nursing Outlook 69 (1): 13–21. doi:https://doi.org/10.1016/j.outlook.2020.08.005.