
Abstract
In an increasingly complex and interdependent world, it has become increasingly difficult and costly to identify and protect systems, communities or organizations against all possible threats. Resilience approaches, however, provide capacities or abilities to respond to hazards and threats beyond existing scenarios and associated response plans, as well as learn from these disturbances and improve performance. Thus, resilience approaches provides increased capabilities for strengthening beyond traditional risk, crisis and business continuity approaches. However, there are inherent challenges of contextualizing resilience indicators for specific uses for specific critical infrastructures while also designing a comprehensive and multidimensional approach as well as for comparison across various infrastructures. Based upon the development and application of an indicator-based decision-support system for resilience in a Horizon 2020 project, we describe and analyse how we addressed such challenges, providing opportunities for improving resilience for drinking water supply and distribution in Sweden. The findings show the value of a modular approach, iterative indicator design processes with relevant stakeholders, the necessity to attend to their organizational processes, to the regulatory context as well as to the assignments, evaluation criteria and cognitive regimes among various target audiences. The approach is a useful methodology to achieve policy objectives for critical infrastructures from a systemic perspective, such as identifying and evaluating resilience, development of measures to increase resilience and the development of performance metric as well as facilitating information-sharing and training.
Introduction
In an increasingly complex and interdependent world, it has become increasingly difficult and costly to identify and protect systems, communities or organizations against all possible threats (e.g. Thekdi and Chatterjee Citation2019). Resilience approaches, however, provide capacities or abilities to respond to hazards and threats beyond existing scenarios and associated response plans, as well as learn from these disturbances and improve performance. Therefore, resilience approaches provides increased capabilities for strengthening systems, communities or organizations beyond traditional risk, crisis and business continuity approaches (e.g. Øien et al. Citation2018). For these reasons, resilience approaches are increasingly adopted in both research and practice across the globe (e.g. Australian Government Citation2010; OECD Citation2019; Wilson and Wilson Citation2019). However, while promising, resilience approaches also poses a number of challenges, in terms of conceptualization and operationalization (e.g. Doorn Citation2015) as well as in terms of contextualizing the measures to be used. That is, identifying variables that represent salient components of resilience in specific cases, allowing for a relevant measure and for taking action that achieves required objectives (e.g. Hernantes et al. Citation2013), while also applying a coherent and conceptually appropriate approach across cases (Beccari Citation2016).
This article addresses how, within a project as part of the EU Research and Innovation programme Horizon 2020 (Smart Resilience, running in the years 2016-2019), we addressed the challenges associated with contextualizing indicators for specific critical infrastructures while also designing a generic and systematic design, allowing for a comprehensive and multidimensional methodology and for comparison across various infrastructures. Based upon the development and application of an indicator-based decision-support system for resilience, we describe and analyse how we addressed contextualization challenges, providing opportunities for improving resilience for drinking water supply and distribution in Sweden. We argue that the findings are of interest for researchers and stakeholders within critical infrastructure policy and practice.
Literature review: contextualization challenges
Contextualization challenges include the use of top-down vs bottom-up models (e.g. Wilson and Wilson Citation2019), theory-based vs stakeholder-based models (e.g. Beccari Citation2016), the design and choice of specific vs generic indicators (e.g. Kuhlicke et al. Citation2011), and the design of useful composite indicators (e.g. Doorn Citation2015).
Most assessments of resilience or vulnerability are not intended to serve stakeholders’ practical work with understanding and managing risks or disturbances (Birkmann Citation2007). Either they are designed for research use (Al-Dahidi and Liu Citation2015) or for policy use (Auerswald et al. Citation2005) but not for end users’ direct use. Publications by governments, offering guidance to various local governments or companies (see e.g. Australian Government Citation2010), or publications offering guidance to improve resilience in certain domains, most often do not specify the means or models to be used. This is because a common regulatory approach: the regulator specifies the goals to be reached by the regulated organizations but leave to them how to achieve them. Thus, it is not possible to tell how well these assessments correspond to the organizations’ resources, skills, assignments and current processes.
To be useful to end users, indicators need contextualization to their intended domain, users and uses (Birkmann Citation2007). In the following literature review, the first, question why one seeks to assess resilience is assessed: what should the assessments and indicators be useful for? Secondly, we review studies that focused on for whom to construct indicators. Thirdly, we review literature regarding how to design useful indicators and methods for doing so.
Indicators for what?
Prior and Hagmann (Citation2014) suggest five different reasons to measure resilience in terms of safety of critical infrastructures:
Characterize or model resilience
Raise awareness or share information about critical risks
Allocate resources among various competing areas or issues
Build resilience
Monitor policy performance
They review three different resilience models and suggest several overall considerations. For example, if an indicator is aimed at reducing complexity in assessing the resilience of a complex system: ‘how can you simplify a complex process or concept so that it is understandable and measurable without losing the very complexity and deepness of meaning you are trying to capture?’ (Prior and Hagmann Citation2014, 293). Similarly, Beccari (Citation2016) identified three key motivations for developing indices and indicator frameworks: ranking relative performance; influencing or driving change in performance and; understanding and diagnosing performance. These different motivations may require different choice, type and manipulation of data.
Birkmann (Citation2007) investigated the usefulness of three different indicator models for natural hazards. Usefulness here refers to both reliability (whether the models accurately represent actual vulnerability and resilience) and guidance to decision-making. He stresses the need to contextualize indicators to local contexts, uses and users. First, there is a need to operationalize and translate vulnerabilities into quantitative and qualitative measures. Secondly, there is a need to design and adjust the indicators for specific functions (e.g. risk identification or evaluation or risk management performance) and for specific user groups (e.g. disaster manager or urban planners).
Indicators for whom?
Indicators infer the object, state or capacity that they represent. Case studies of vulnerability to flooding in three Atlantic coastal communities in the US shows that even if the disturbance is the same (Harrald Citation2012), different measures need to be taken in different cases, because the communities are so different in terms of topography and socio-demographics. The ‘classical’, top-down indicators, often used by governments and other public bodies, easily retracted from official statistics and easily quantified and modelled, often obscures salient resilience capacities specific to the case (Wilson and Wilson Citation2019). Testing top-down indicator-based studies of flooding in Europe shows that the same kind of indicator may have different interpretation and impact in different contexts (Kuhlicke et al. Citation2011) or phases over the resilience cycle because of highly different social contexts, making them less specific and accurate than they first appear (Beccari Citation2016). Moreover, the availability of these data, rather than an appropriate conceptual model, may be the primary factor in the selection of variables for inclusion in an index (Beccari Citation2016). This is also reflected in a high degree of overlap of indicators between generic development indices and risk and disaster ones (Beccari Citation2016). Therefore, the risk and disaster indices do not add much specific explanatory power to that of the generic indices.
However, on the other hand, bottom-up, stakeholder-focused approaches, often lack a theory-based model, making it difficult to compare different cases: indicators are often unique to the cases they are designed to fit, thus making it difficult to learn beyond these cases or prioritizing among different instances (Beccari Citation2016).
Because many stakeholder-based approaches are self-assessment and others are being driven by a single small research group it is difficult to ascertain their full geographical coverage. Aside from pilot locations, their implementation is often not reported. This makes it difficult to assess implementation difficulties or conduct reliability analysis to identify a shorter list of questions (Beccari Citation2016, 15).
Thus, an index that can be useful to improve resilience need a theory-based approach, related to systemic performance.
Similar to top-down indicators, composite indices allow for an easy comparison among various cases. Composite indicators are often criticised because they often have complex design, obscuring the influence of individual variables, producing outcomes that serves certain interests over others, in ways that are far from transparent (Doorn Citation2015). However, rather than taking a stand between opposite camps, Nardo et al. (Citation2008, 14) suggests that composite indicators or indices should be justified based upon their ‘fitness for the intended purposes and in peer acceptance’ (see also Beccari Citation2016), thus calling for contextualization and user participation in the design process. One way of doing this is to demonstrate the ‘business case’ for assessment of organizational resilience through its ability to quantify improvements in their resilience and tracking changes in that measurement over time (Lee, Vargo, and Seville Citation2013). To that end, there is a need for leading indicators that proactively assess resilience towards future challenges, rather than simply rely on lagging indicators, that is data from past performance.
Based on the shortcomings identified in a comprehensive review of composite indicators, Beccari (Citation2016) suggests several improvement areas, of which four are addressed through this article: (a) serve different purposes and tailor these to individual users and uses; (b) add value to existing tools and approaches in the target area; (c) present the results of the compilation in a range of formats allowing for increased user involvement and engagement and for communication of results from their use to various audiences and; (d) attempt to validate the index values.
Thus, a framework for assessing and managing resilience needs to be adapted to local circumstances, through a mixed approach, combining a top-down and bottom-up design process (e.g. Tasic et al. Citation2020), in collaboration with users (Thekdi and Chatterjee Citation2019; Hernantes et al. Citation2013).
How to design resilience indicators in collaboration with end-users?
In a few cases, resilience indicators are designed in cooperation with affected stakeholders. Only sometimes though, are the indicators designed to be used for specific users in mind, that is, contextualized. There are quite a few EU funded projects in the area of protection of critical infrastructures that involve end user participation to assess needs, requirements and the value of developed measures to assess and manage vulnerabilities. In a few cases, practitioners struggle with resilience concepts compared to concepts of business continuity and risk management (e.g. RESILENS Citation2015).
In an EU research project within the Critical Infrastructures Programme, Hernantes et al. (Citation2013), based upon a literature review, designed a framework with four dimensions of resilience: technical, organizational, economic and social resilience. Domain experts within different fields (energy companies, first responders, civil protection, healthcare and organizations responsible for critical infrastructures) joined for three workshops to define relevant policies that affect resilience and how they related to each other, based upon various scenarios for power outage. Between the workshops, simulation and Delphi calculations were used to judge the various impacts of these policies. The resulting framework was subsequently used by experts to assess the resilience levels and opportunities to enhance resilience of a nuclear power plant and a water distribution company, through documents, interviews and observations. The collaborative modelling with recurring workshops provided two advantages: shared learning across experts from interdependent critical infrastructures and learning over time, from crisis to crisis. Although a very productive project, there are two important limitations from this project: (a) the model has not been subject to empirical testing as a means for end users’ work with assessing resilience and (b) there remains work to define the quantitative metrics.
Reflecting common principles for emergency management, the Swedish Civil Contingencies Agency (Citation2014) stresses that the same organizations that are responsible for a critical infrastructure in normal operations are also responsible to manage the infrastructure in crisis situations and that crisis preparedness and management needs to be integrated in existing management processes. It is rare that research addresses how this could be done though. In a recent review of more than 30 different frameworks to assess the resilience of critical infrastructures, Bialas (Citation2016) argue that none of them were based on a continuous improvement model such as the Deming Cycle (PDCA).
Research questions and expected contributions
We suggest three research questions that will contribute to address knowledge gaps identified in the review.
RQ1: Involving users: How do we involve users in designing indicators which supports existing organizational processes? This research question will help to address validating indicators for specific uses, how to design for a relevant business case adding to existing practices and tools, integrating them into existing processes for improving resilience as well as validating indicators for specific users.
RQ2: Operationalizing: How do we design resilience indicators that represent salient components of resilience in specific cases in various cases, for various uses and users based upon a generic model of resilience? This research question will help to address issues such as the relation between indicators, continuous improvement processes for improving resilience, and the relevance of the indicated issue/capacity important for resilience.
RQ3: Appropriate aggregation: How do we define composite indicators that do not obscure salient resilience components and relations? This research question will help to address how to design a model covering various phases over the resilience cycle, as well as how to construct coherent but adapted indices for various purposes and users in various formats, quantifying and testing indicators.
Methods and data
Introduction
Cross-case, comparative analysis, particularly across different national contexts, is valuable in exploring similarities, commonalities and differences of cases, thereby strengthening generalization of results (Yin Citation2009). The Smart Resilience EU project was particularly useful to illustrate how to address contextualization challenges because it was explicitly designed to be both a common approach and to be adaptable to specific cases. The project included resilience experts, modelling experts and stakeholder managing experts. The project involved iterative collaboration over the development processes with a range of stakeholders from eight different critical infrastructures, in different countries: banking (UK); energy distribution (DE); healthcare (AT); airport security (HU); oil refinery (RS); drinking water production (SE/FI); flooding (EI) and underground coal storage (FI). The variation of settings and types of critical infrastructures was designed according to a theoretical sampling approach (Patton Citation1990) to maximize variation, while keeping focused on the same topic. That is, we addressed contextualization challenges for developing indicators/indices and methodology that are both generic, allowing comparison across cases and adaptable to specific, cases, users and uses. Below, we will briefly describe the Smart Resilience methodology, providing the necessary context for the discussion on contextualization.
The smart resilience methodology
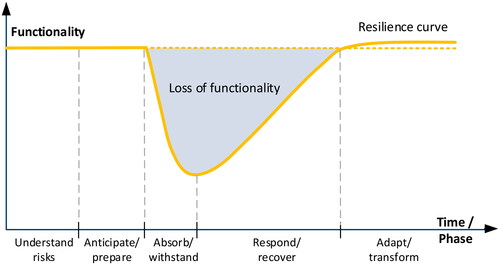
Smart Resilience developed an indicator-based decision support to identify, visualize and assess risks to Smart Critical Infrastructures, tested in eight different infrastructures in different European countries. The methodology was based upon previous indicator-based projects, defining five successive phases over the resilience cycle in relation to a threat or disturbance (Øien et al. Citation2019, 14):
The ability to anticipate possible adverse scenarios/events (including the new/emerging ones) representing threats and leading to possible disruptions in operation/functionality of the infrastructure, prepare for them, withstand/absorb their impacts, recover from disruptions caused by them and adapt to the changing conditions.
Based on this definition, the project derived the following five phases of the resilience cycle: understand risks, anticipate/prepare, absorb/withstand, respond/recover and adapt/learn. In addition, five dimensions of resilience were defined as heuristics to prompt the development of a multi-dimensional approach: system/physical; information/data, organizational/business; societal/political and; cognitive/decision-making. The basis for the methodology is based upon using issues (or functional elements) to define anything (factors, conditions, functions, actions, capacities, capabilities, etc.) that is important in order to be resilient against severe threats such as terror attacks, cyber threats and extreme weather. Issues are used for resilience assessment. Each issue is allocated to only one of the five phases in the resilience cycle: e.g. it can be ‘training’ performed in the anticipate/prepare phase. Functional elements are used for stress-tests: each of them measure for all the resilience phases.
To measure the issues or functional elements, partners and stakeholders constructed indicators, assigning one or more to each issue or functional elements. The indicators were assigned a scale from 0 (worst) to 5 (best) as a means to quantify resilience. The methodology was used to enable several types of uses, serving different purposes, such as (see www.smartresilience.eu-vri.eu/):
Following up own development over time (trending) and analyse status.
Comparing with others (e.g. through a benchmarking).
Providing overview of strengths and weaknesses and point at improvement needs (e.g. through a stress test).
Evaluating various improvement options (e.g. through a multicriteria decision analysis).
For most of the case studies (including drinking water), it was not possible to use real data (either not available or for security reasons), meaning that the indicator values used were tentative. Therefore, validation took place through workshops, considered equivalent to TRL 4 (validated in a lab), complying with project ambitions.
The methodology is a mixed approach (Doorn Citation2015), with a generic approach to be used by everyone (top-down) although allowing for adaption to specific uses and users (bottom-up), permitting benchmarking or stress test for the same threat across cases. All the specific uses depart from a shared definition of resilience and a specific design of the resilience. At the same time users can design and choose their own indicators and they can aggregate indicators on a chosen level, depending on their purposes (Jovanović et al. Citation2019), creating a dynamic checklist or DCL. DCLs are designed using the common methodology but adapted to the specific infrastructure and to a specific use. Even if two users create their own DCLs because their circumstances differ they can still be compared at a chosen level. For example, if two organisations use the same issues for a benchmarking exercise, they might choose different indicators for these issues because they are different in some respects. Moreover, even if issues differ, the issues for each level in a resilience level measurement might be comparable for each time phase or similar disturbance for a stress-test.
An indicator was defined as a way to operationalize/quantify an ability (‘issue’), ideally with a value from 0 to 5. Seven criteria for useful indicators were used, based upon prior research (Øien et al. Citation2017):
Measurable with available knowledge, methods and instruments
Possible to influence through the decisions and processes over which the organization has control
Provide sufficient data to be used to control processes and make decisions
Controllable – can be validated
Individually valid and together sufficient coverage of the topic
Easy to understand, simple and unambiguous
Easy to find data for staff (preferably automatic generated)
The Smart Resilience model does not use weighting of indicators by default as one cannot beforehand know what issues or indicators to weight differently in relation to each other for every possible case or use. However, the model allows weighting if users find that it is useful.
Methods for contextualization
The indicators to be used were designed through dialogue with stakeholders in the relevant case studies. First, we did some ‘homework’ to learn what was already in place and how the resilience concept and the project methodology could add to existing practices and tools within risk analysis, crisis management and business continuity processes. We identified stakeholders challenges, needs and requirements for assessing resilience (Buhr et al. Citation2016), providing a baseline assessment for the project, predominantly based on qualitative methods, consisting of semi-structured individual or group interviews with key stakeholders in critical infrastructures, carried out desktop studies of secondary material, searching in databases and through a literature review. Second, we conducted a review of the legal and knowledge base for assessing and improving resilience in critical infrastructures (Vollmer et al. Citation2018). Third, we identified a number of salient threats and assessed resilience for them, through setting up preliminary scenarios, using the 5 × 5 matrix (Walther et al. 2017). Fourth, we compiled a database of appropriate indicators, drawn from our “homework’ and through workshops with experts and practitioners as well as suggested from previous resilience engineering and research, providing a theory-base for the methodology (Øien et al. Citation2017). Fifth, we iterated scenarios and DCLs through repeated workshops with practitioners (e.g. Sanne, Matschke Ekholm, and Rahmberg Citation2019). The scenarios were used as examples of disturbances, causing consequences for which the different infrastructures need to be resilient. Six, we fine-tuned indicator development procedures, tips and guidance (Sanne et al. Citation2020).
These efforts were guided by common protocols for how to identify stakeholders, what questions to ask in interviews, how to identify relevant regulations, how to design indicators, how to conduct and evaluate workshops etc., based upon an ‘actor analysis’ approach, allowing for a coherent approach across the case studies but also allowing for adaptations to local context (Buhr et al. Citation2016, Sanne et al. Citation2020). See for an overview of the workshops and interviews, participants and purpose of each occasion. More data can be found in the supplementary material provided.
Table 1. Overview over data collection.
Most of the work was carried out in close collaboration with stakeholders. The interviews were made using relevant ethical requirements, such as informed consent procedures. The scenarios used to validate the Smart Resilience methodology were based upon relevant threats that the infrastructures need to withstand. The workshops illustrated how the infrastructure may indicate, evaluate and improve resilience using the Smart Resilience methodology and shows the value of the methodology for the specific critical infrastructures, achieving TRL4 (equal to validated in lab).
For drinking water, managers and experts from two waterworks participated in three consecutive workshops, as well as experts from the Swedish Food Agency, the Emergency Management Agency and the Swedish Water and Wastewater Association, DRICKS, the Swedish national centre for drinking water research and from SINTEF.
Results
Involving users: developing requirements for indicator design
As part of baseline assessment, stakeholders in the case studies (experts and decision makers) highlighted the following important challenges for the project in relation to their own needs:
To develop the value of the concept of resilience for one's own organization in addition to and integrated with existing tools and assignments such as risk analysis, continuity planning and emergency preparedness.
Being able to identify and evaluate external threats (e.g. climate change, cyber-attacks, terrorist attacks, floods) and the complexity of critical infrastructures.
Finding methods for developing methodologies that work in relation to very high demands for secure data management in an uncertain environment.
The drinking water producers particularly emphasized the importance of the concept of resilience and that the decision support being developed must add value to the industry that justifies the time and costs they require to be incorporated into existing concepts and analyses. Resilience is currently not an established concept among drinking water producers, but the representatives of the industry (Swedish Civil Contingencies Agency, the National Food Administration, drinking water producers, researchers) who were interviewed perceived that there might be a value in using it. Nor are indicators used to any great extent: traditional risk analysis is more common. There are also different needs for different drinking water producers and the indicators need to be adapted to that.
For drinking water, we analyzed three different threats: cyberattacks, drought and microbial contamination, based upon the phases and dimensions of resilience used in the project. We analyzed research, investigations and manuals as well as interviewed representatives of the industry and others to identify existing indicators and develop new ones based on existing knowledge and regulations. See .
Table 2. Baseline assessment of resilience challenges in the drinking water sector. Copyright: the authors.
Based on the needs inventory, we developed the following requirements for indicator design to increase resilience in critical infrastructures. First, indicators and indices should be developed with an appropriate end-user in mind. This means asking questions such as: Which organization, and what function or user group, will use it? What is their interest in using indicators? What is their legitimacy for spreading the indicator in the critical infrastructure? Second, indicators should be developed in dialogue with end users to increase the likelihood that they cover relevant areas and are currently not adequately covered. Designing useful indicators requires end-user commitment to: (a) integrate the indicators into existing organizational processes; (b) ensure that they are relevant, understandable and legitimate and (c) ensure they are designed to support end users' own ability to assess resilience and perceptions of usability. Third, indicators should be developed to support end-users’ organizational missions or assignments. There is a need to define the “work’ that the indicators should do. This means that the project will develop indicators that are easy to understand to reduce dependency on individual expertise and different interpretations between different organizations. The indicators should also allow end users to collect, process and share (large) data with due regard to data security.
Composite indicators: using the methodology
The tests for drinking water production were made for three different uses (resilience assessment, stress-test and multicriteria decision-making) that are supported by the Smart Resilience methodology, all based on a scenario that we produced in collaboration with end users and experts on microbial contamination of raw water.
The scenario is set in a medium-sized Swedish city with a water plant that supplies drinking water to about 10,000 people. The water is taken from a surface water source. It's been raining for about a week. Then a so-called 100-year rain occurs in the city. The rain leads to flooding in the surface water source. Part of the sewage treatment plant has been affected by power failure and has lost its functionality and automatic controls. Fecal indicators are measured in the surface water after the flood. The treatment process for drinking water production is precipitation in combination with sand filters and chlorine treatment or UV treatment. A number of pipelines have also been affected, of which two large pipes are completely exhausted. This causes the water towers to drain quickly.
Resilience level assessment
illustrate how the Resilience Level Assessment may look like, with an extract of examples from the DCL used for assessing resilience for drinking water production (the full DCL consists of 27 issues and 41 indicators). For each phase a number of issues important to achieve resilience are identified and for each of these issues, one or more indicators are designed. Tentative figures for the indicators were used to illustrate the functioning of the methodology. As these figures cannot be compared to a baseline or to another drinking water facility, they are not included here.
Table 3. Extract from the Dynamic Checklist for assessing resilience levels for drinking water in Sweden.
The workshop participants considered that the resilience level assessment is appropriate for regularly (e.g. yearly) ‘taking the temperature’ at a selected organizational level (Sanne, Matschke Ekholm, and Rahmberg Citation2019). It is appropriate for them to follow up on their own development over time and analyze the status, compare with others (benchmarking), give an overview of strengths and weaknesses, point to improvement needs and making any gaps visible (lack of relevant indicators). The assessment provides a method for identifying long-term resilience. It can be used as a methodology for a diagnostic analysis at a given time. It can also be used to identify new threats where the user needs to identify vulnerabilities and consequences, e.g. benchmark against others and/or evaluation of their own organization. Another drinking water facility may assess its resilience level using the same issues but with a slightly different set up of indicators, because it is differently designed, e.g. uses a different filter for incoming water so that the barriers against poor raw water are different.
The methodology can be used when the perspectives change or rulebound, such as once a year or every three years, when something in the organization changes or when there is a new threat or phenomenon. It can be used in relation to various assignments, e.g. risk analysis, continuity planning, budget process or climate adaptation. It can be applied at different levels. It can be at a strategic level in the municipal organization or at a strategic level in the waterworks. The methodology should, above all, be used by actors within the organization, e.g. operating technicians, operations engineer, water production manager, and risk strategist.
Stress-testing the process
The stress test measures whether the loss of functionality (i.e. the consequences for the system’s performance) due to an event is less than required throughout the resilience cycle (Sanne et al. Citation2019). The same scenario was used as above. Purpose: Support to reduce the number of disturbances, reduce the consequences and shorten the time for disturbances. shows an event that radically reduces the production of safe drinking water in relation to a specified tolerance level.
Figure 1. The resilience stress-test. Copyright: EU-VRi. From Øien et al. (Citation2019).
The workshop participants modified the project group's proposed DCL and reformulated the purpose as well as designed four functionalities, see below.
The stress test was considered a good methodology for self-assessment as a contribution to crisis management. It was seen as a good complement to e.g. the Sustainability Index (Svenskt Vatten Citation2020), for which a lot of data is provided but without specific feedback to the own organization (Sustainability index is primarily a benchmark). The stress test was also considered useful as a complement to the current reporting format to politicians, not least because it visualizes resilience in different phases of the cycle. One way to design a useful dynamic stress test checklist is to formulate functionalities that aim to reduce the impact of disruptions on affected critical consumers, reduce recovery time, and learn to mitigate the consequences better.
A stress test can be a stand-alone exercise that involves the crisis management group and is used to evaluate how the group organizes. The results can be reported to management in terms of areas of improvement, focusing on the most cost-effective alternatives. Alternatively, the stress test can be integrated within existing crisis management, either for the water and wastewater department or for the entire municipality, which involves crisis management strategists and city planners. Important results are the learning process and a list of improvement measures, including an evaluation or prioritization of measures. The workshop suggested that it should be possible to both aggregate and break down the various functional elements, as decision makers sometimes want to consider different aspects and the calculations behind them, a suggestion followed up in the project. Also a stress-test can be compared, either across time for the same organization or across facilities, using the same functional elements but a slightly different DCL. Alternatively, the same user might change the DCL somewhat if the stress-test uses another scenario as example.
Multi-criteria decision-support
A multi-criteria analysis is used to support decisions in situations with multiple, conflicting criteria, such as cost, time and results. The same scenario was used as above. The participants modified the project group's proposal for solutions to increase resilience in relation to the scenario. Three of these were selected, suitable indicators were chosen to measure these, and we selected three decision criteria: estimated cost values; time to implementation/effect and increased resilience. In below we show an example with tentative figures to illustrate how the methodology can be used.
Table 4. The Dynamic Checklist used for stress-testing the drinking water sector.
Table 5. The MDCA used for deciding on measures to improve barriers for the drinking water facility.
If the criteria are given equal weight in the calculation, option 3 becomes the highest priority, then option 2 and last option 1. End users and experts suggested that time must sometimes be weighed as the most important criterion. For large investments, various sustainability criteria were also considered necessary, such as climate impact due to e.g. increased energy use. The participants considered that the methodology was good as a basis for planning, for decisions on strategies for investment in barriers and smart sensors and/or support for prioritization. This use of the methodology was considered to be the most tangible and easily understandable of the three as well as useful when presenting and choosing from a small number of decision options, e.g. in municipal committees or boards (Sanne et al. Citation2019).
Summary
The representatives of various drinking water producers considered the Smart Resilience methodology useful for increasing resilience to serious disruptions that threaten the ability to supply drinking water in a time of increasing uncertainty due to climate change, cyber threats and political instability. They can be used to support assignments and processes internally at the waterworks or at a higher level. They can also be used at an overall municipal/regional level for assignments such as climate adaptation and urban planning and/or crisis and continuity planning, planning for civil defense and as support for external monitoring.
They can be used to identify, visualize and evaluate the resilience of the waterworks with regard to maintenance and investment planning, risk analysis and continuity. Resilience methodology provide better support for dealing especially with the later stages of the resilience cycle, when the disruptions have occurred, for how they are best managed and what conclusions are drawn to improve operations next time.
The methodology can be used as a clear way to quantify resilience beyond yes/no answers for various purposes: (a) complement to existing tools; (b) as an additional exercise to evaluate the consequences of worst-case scenarios and c) to support investment decision-making and maintenance.
Discussion
In this section, we will discuss the findings in light of the knowledge gaps to assess the contributions to contextualizing resilience indicators with a generic, multidimensional approach and we compare it with a few other similar studies addressing indicators for improving resilience within critical infrastructures.
RQ1: Involving users: How do we involve users in designing indicators which support existing organizational processes? Through collaborative scenario-building and the construction of tailored DCLs, the Smart Resilience approach has proved an added value over existing tools and approaches used in the critical infrastructures and can be used integrated with existing processes for improving resilience, answering to calls by Bialas (Citation2016) for methods for continuous improvement of resilience. Through exercises and workshops, stakeholders validated the index values to a certain extent (compare to Beccari Citation2016).
RQ2: Operationalizing: How do we design resilience indicators that represent salient components of resilience in specific cases in various cases, for various uses and users based upon a generic model of resilience? The project used a modular approach to operationalize indicators, assigning Dynamic Checklists, allowing for a generic approach while also adapting to various uses and users (compare to Beccari Citation2016). It also allowed for sharing indicators across infrastructures. The generic approach also allows for learning and fine-tuning over time, thus addressing calls for how to design a model covering various phases over the resilience cycle (Wilson and Wilson 2019) as well as how to quantify and test indicators for various uses (Beccari Citation2016).
RQ3: Appropriate aggregation: How do we define composite indicators that do not obscure salient resilience components and relations? The project developed a methodology that can be applied at a chosen level of aggregation for various purposes: resilience level assessment, stress-test, multi-criteria decision support etc., and for tailoring these to individual users and uses (Beccari Citation2016). This answered to calls for various levels of analysis and the way it was carried out validated several business cases for the methodology (Lee, Vargo, and Seville Citation2013). The interactive dashboard and the visualization allows for increased user involvement and engagement and for communication of results from their use to various audiences, answering to calls for presentation in a range of formats (Beccari Citation2016).
The findings should be compared to a few other studies with similar approaches or findings. Brown, Seville, and Vargo (Citation2017) assessed a regional cluster of infrastructures in New Zealand, using a method for assessing the organizational resilience of critical infrastructure providers. The model was useful to establish a common language, a baseline measure and for identifying areas for improvement. The major contribution that the Smart Resilience methodology adds is the ability to use the same approach while adapting to specific infrastructures, in addition to a holistic set of indicators. Thekdi and Chatterjee (Citation2019) identified hidden performance measures for assessing resilience in critical infrastructures, to support prioritizing investments, to model uncertainties and to identify appropriate performance measures. Tasic et al. (Citation2020) constructed a theory-based framework to enhance organizational resilience: identifying (through interviews) and validating (through questionnaires) salient variables, based upon a case study of a small response organization (n = 30). The framework was useful to review and monitor context, test preparedness, analyse and assess resilience and for strengthening capabilities. However, in contrast to Smart Resilience, these studies lack a methodology that allows for a tailored approach addressing the different purposes they suggest. Compared to Smart Resilience however, their approach lacks the overall coverage of various dimensions of resilience in a critical infrastructure (although the socio-material component in Tasic et al. adds salient value).
Beccari (Citation2016) also identifies challenges related to the conceptualization of resilience behind the various indices, specifically in stakeholder focused approaches, with regard to addressing systemic performance, based upon expert competence and research evidence. Smart Resilience used an eclectic approach to address this issue: the default checklist is partly based upon resilience theory, partly on expert rating. Users may then add indicators that fit their understanding, their availability of data and their purposes.
Conclusions
The study addressed the challenges involved in contextualization of resilience indicators, that is, how to construct indicators that simultaneously allow a comprehensive approach and tailored uses. The Smart Resilience project used an eclectic, iterative and module-based approach, as well as a business case approach and an individually adapted but coherent actor analysis that was useful to address these challenges. The limitations are clear: the eclectic approach may risk that the explanatory value becomes diluted if the methodology is applied without due expertise. There is also a need to increase the TRL through implementing and refining the Dynamic Checklists. In this way, one can test of the robustness of the various resilience assessments or stress tests, realise the added value of the methodology in relation to existing tool such as risk analysis and business continuity management as suggested by the findings, as well as integrate it with existing processes.
The Smart Resilience methodology can be used to accomplish national and international regulations and policy objectives for protecting critical infrastructures in relation to various threats (e.g. EU Directive 2008:114; the NIS directive and OECD Citation2019). Specifically, the methodology can be used to understand vulnerabilities in order to prioritise investments across sectors, building partnerships and creating a governance structure, but also in relation to e.g. regulations regarding civil protection and climate adaptation.
Disclosure statement
No potential conflict of interest was reported by the authors.
Additional information
Funding
References
- Al-Dahidi, S., and X. Liu. 2015. “Resilience analysis of critical infrastructures exposed to external disturbances and affected by uncertainty.” In 25th European Safety and Reliability Conference, Zürich, Sep 7–10, 2015, CRC Press, pp. 2703–2710.621.
- Auerswald, P., L. Branscomb, T. La Porte, and E. Michel-Kerjan. 2005. “The Challenge of Protecting Critical Infrastructure.” Issues in Science and Technology 22 (1): 77–83.
- Australian Government. 2010. Critical Infrastructure Resilience Strategy. Canberra: Australian Government.
- Beccari, B. 2016. “A Comparative Analysis of Disaster Risk, Vulnerability and Resilience Composite Indicators.” PLoS Currents 8.
- Bialas, A. 2016. “Critical Infrastructure Protection—How to Assess the Protection Efficiency.” In Dependability Engineering and Complex Systems, Advances in Intelligent Systems and Computing, edited by W. Zamojski, J. Mazurkiewicz, J. Sugier, T. Walkowiak, J. Kacprzyk, 25–37. Switzerland: Springer.
- Birkmann, J. 2007. “Risk and Vulnerability Indicators at Different Scales: applicability, Usefulness and Policy Implications.” Environmental Hazards 7 (1): 20–31. doi:https://doi.org/10.1016/j.envhaz.2007.04.002.
- Brown, C., E. Seville, and J. Vargo. 2017. “Measuring the Organizational Resilience of Critical Infrastructure Providers: A New Zealand Case Study.” International Journal of Critical Infrastructure Protection 18: 37–49.
- Buhr, K., A. Karlsson, J. M. Sanne, N. Albrecht, N. A. Santamaria, S. Antonsen, D. Bezrukov, et al. 2016. SmartResilience D1.3: End Users’ Challenges, Needs and Requirements for Assessing Resilience. EU project SmartResilience, Project No. 700621.
- Doorn, N. 2015. “Resilience Indicators: Opportunities for Including Distributive Justice Concerns in Disaster Management.” Journal of Risk Research 20 (6): 711–731.
- Harrald, J. 2012. “The Case for Resilience: A Comparative Analysis.” International Journal of Critical Infrastructures 8 (1): 3–21. doi:https://doi.org/10.1504/IJCIS.2012.046550.
- Hernantes, J., E. Rich, A. Lauge, L. Labaka, and J. M. Sarriegi. 2013. “Learning before the Storm: Modelling Multiple Stakeholder Activities in Support of Crisis Management, a Practical Case.” Technological Forecasting and Social Change 80 (9): 1742–1755. doi:https://doi.org/10.1016/j.techfore.2013.01.002.
- Jovanović, A., M. Jelić, T. Rosen, P. Klimek, S. Macika, and K. Øien. 2019. Smart Resilience D3.7: The “ResilienceTool” of the SmartResilience project. EU project SmartResilience, Project No. 700621.
- Kuhlicke, C., A. Scolobig, S. M. Tapsell, A. Steinführer, and B. De Marchi. 2011. “Contextualizing Social Vulnerability: Findings from Case Studies across.” Natural Hazards 58 (2): 789–810. doi:https://doi.org/10.1007/s11069-011-9751-6.
- Lee, A. V., J. Vargo, and E. Seville. 2013. “Developing a Tool to Measure and Compare Organizations' Resilience.” Natural Hazards Review 14 (1): 29–41. doi:https://doi.org/10.1061/(ASCE)NH.1527-6996.0000075.
- Nardo, M., M. Saisana, A. A. Saltelli, and S. Tarantola. 2008. Handbook on Constructing Composite Indicators: Methodology and User Guide. Paris: OECD.
- OECD. 2019. Good Governance for Critical Infrastructure Resilience. Paris: OECD.
- Øien, K., L. Bodsberg, A. Hoem, A. Øren, T. O. Grøtan, A. Jovanović, A. Choudhary, et al. 2017. SmartResilience D4.1: Supervised RIs: Defining Resilience Indicators Based on Risk Assessment Frameworks. EU project SmartResilience, No. 700621.
- Øien, K., A. Jovanović, L. Bodsberg, A. Øren, A. Choudhary, J. M. Sanne, L. Bergfors, et al. 2018. SmartResilience D3.6: Guideline for assessing, predicting and monitoring resilience of Smart Critical Infrastructures SCIs. EU project SmartResilience, Project No. 700621.
- Øien, K., A. Jovanović, T. O. Grøtan, A. Choudhary, A. Øren, K. Tetlak, L. Bodsberg, and M. Jelic. 2019. SmartResilience D3.8: Assessing Resilience Level of Smart Critical Infrastructures Based on Indicators. EU project SmartResilience, Project Nr. 700621.
- Patton, M. 1990. Qualitative Evaluation and Research Methods. Beverly Hills, CA: Sage.
- Prior, T., and J. Hagmann. 2014. “Measuring Resilience: Methodological and Political Challenges of a Trend Security Concept.” Journal of Risk Research 17 (3): 281–298. doi:https://doi.org/10.1080/13669877.2013.808686.
- RESILENS. 2015. Stakeholder Consultation Report. EU project RESILENS, Project No. 653260.
- Sanne, J. M., H. Matschke Ekholm, and M. Rahmberg. 2019. SmartResilience D5.8: FOXTROT: Drinking Water Supply System. EU project SmartResilience, Project Nr. 700621.
- Sanne, J. M., H. Matschke Ekholm, R. Molarius, P. Auerkari, R. Koivisto, P. Thörn, M. Rahmberg, et al. 2020. SmartResilience D4.4: Expert Workshops for Definition, Selection and Refinement of Indicators. EU Project SmartResilience, Project Nr. 700621.
- Svenskt Vatten. 2020. Resultatrapport för Hållbarhetsindex 2019 [Performance Report for Sustainability Index 2019]. Stockholm: Svenskt Vatten.
- Swedish Civil Contingencies Agency. 2014. Övergripande Inriktning för Samhällsskydd Och Beredskap [Overall Orientation for Civil Protection and Preparedness]. Karlstad: Swedish Civil Contingencies Agency.
- Tasic, J., A. Sulfikar, T. Jethro, and M. Khader. 2020. “A Multilevel Framework to Enhance Organizational Resilience.” Journal of Risk Research 23 (6): 713–738. doi:https://doi.org/10.1080/13669877.2019.1617340.
- Thekdi, S. A., and S. Chatterjee. 2019. “Toward Adaptive Decision Support for Assessing Infrastructure System Resilience Using Hidden Performance Measures.” Journal of Risk Research 22 (8): 1020–1043. doi:https://doi.org/10.1080/13669877.2018.1440412.
- Vollmer, M., G. Walther, P. Sendrowski, A. Choudhary, A. Jovanovic, J. Gehrke, F. Brauner, J. Sanne, and L. Bergfors. 2018. SmartResilience D3.1: Contextual Factors Related to Resilience. EU project SmartResilience, Project Nr. 700621.
- Walther, G., M. Jovanovic, M. Vollmer, A. Choudhary, J. M. Sanne, P. Klimek, F. Brauner, et al. 2017. SmartResilience D2.2: Report on challenges for SCIs. EU project SmartResilience, Project Nr. 700621.
- Wilson, G. A., and O. J. Wilson. 2019. “Assessing the Resilience of Human Systems: A Critical Evaluation of Universal and Contextual Resilience Variables.” Resilience 7 (2): 126–148. doi:https://doi.org/10.1080/21693293.2018.1539205.
- Yin, R. K. 2009. Case Study Research: Design and Methods. 4th ed. London: Sage.