
Abstract
Despite great promise of using personalized risks of treatment outcomes during shared decision-making, patients often experience difficulty evaluating and using them. We examined the effects of providing comparative information of the average person’s risk when discussing personalized risks on people’s cognitive, emotional, and behavioural responses. Participants (n = 1,807) from a representative sample of the Dutch population received personalized risks of treatment side-effects in three different health scenarios. Participants either received only their own personalized risk statistic, or with comparative data indicating that their risk was below or above average. Furthermore, we examined whether the effects would be influenced by message format (natural frequencies with or without icon arrays) and individual differences (subjective numeracy, health literacy, and graph literacy). Providing comparative information did not influence participants’ risk perceptions, affective evaluations, nor their treatment intention. However, participants who were told that their personalized risks were above average, estimated their own risk as lower than participants who received the same personalized risks that were below average or that were without any comparative data. Message format and individual differences did not influence people’s responses to comparative data. Healthcare professionals can consider providing comparative data for helping people make sense of their personalized risks.
Introduction
Communicating probability information about risks and benefits of health interventions or treatment options to patients is becoming an essential part of modern-day health care and shared decision-making (Bonner et al. Citation2021; Elwyn et al. Citation2017). In light of the growing emphasis on personalized medicine and open access of ‘big health data’ (Chawla and Davis Citation2013; Lyles et al. Citation2020; Schilsky Citation2010), there has been rapid growth in the development of personalized risk information tools for patients in different health context (Trevena et al. Citation2021), ranging from cardiovascular diseases to the oncology setting (Thurtle et al. Citation2021; Vromans et al. Citation2022; Tillier et al. 2021). These tools are aimed at providing patients personalized risks and health statistics that take into account personal and clinical characteristics of unique patients. These personalized risks are—compared to generic risks—perceived as more personally relevant (Vromans et al. Citation2020), which increases the likelihood of being better processed and understood by patients (Lustria et al. Citation2016; Petty and Cacioppo Citation1986).
Even though personalized risk may be more useful and relevant for patients, a critical problem is that they still have low evaluability: they are often unfamiliar, lack inherent meaning, and therefore make it difficult to evaluate whether they are good or bad (Zikmund-Fisher Citation2019). Following theory on ‘information evaluability’ (Hsee Citation1996; Hsee and Zhang Citation2010), providing context may improve evaluability of personalized risks by helping patients to derive meaning from unknown risks (Zikmund-Fisher Citation2019), for instance by telling patients how good or bad a 70% risk is (Waters, Fagerlin, and Zikmund-Fisher Citation2016; Bonner et al. Citation2021). Another promising contextual strategy for improving evaluability of personalized risks is by adding comparative information of the average person’s risk to the patient’s individual risk estimate. Indeed, patients often report that they want to see their own risk score for a particular outcome in comparison with scores of other patients (Vromans et al. Citation2021), especially for determining whether they are above or below average (Oerlemans et al. Citation2017). When personalized risks are presented with other data of the average risk, people are better able to interpret even unfamiliar risks because both types of risks serve as a reference for each other, which enables people to evaluate the ‘goodness’ or ‘badness’ of the risks (Waters, Fagerlin, and Zikmund-Fisher Citation2016).
However, a much-debated question is whether patients should be provided with comparative risks at all. To some, comparative statements should not be communicated (or at least with caution), since such data could unintentionally influence patients’ risk perceptions, affective evaluation or levels of worry, and subsequent treatment intentions (Zikmund-Fisher, Fagerlin, and Ubel Citation2010; Fagerlin, Zikmund-Fisher, and Ubel Citation2007; French et al. Citation2004; Klein Citation2003; Han et al. Citation2011). For instance, people who are above average risk feel more worried and compelled to take a treatment, even though this may not always be the best option based. To others, however, patients should always be informed about whether their personalized risk is above or below average, since most patients will make such comparisons on their own anyway (Schwartz Citation2009, Citation2016). In this case, providing context would be useful for correcting inaccurate beliefs and risk perceptions. To date, little is known about interpretations that people derive from comparative information and whether this may depend on what type of comparative data are communicated and in what specific health decision context (Waters, Fagerlin, and Zikmund-Fisher Citation2016; Schmiege, Klein, and Bryan Citation2010). Therefore, the first aim of this study is to examine people’s responses to comparative information when communicating personalized risks of treatment side-effects. We hypothesize that (H1) people receiving personalized risks that are above average report higher (a) risk estimates, (b) risk perceptions, and (c) affective evaluations than participants viewing the same personalized risks that are below average or without any comparative data.
Yet, the communication of comparative information may be influenced by various factors, including the way in which comparative data is communicated and individual differences (Han et al. Citation2011). Arguably, the most common way to communicate risks in healthcare is through numbers such as percentages or natural frequencies (e.g. ‘5 out of 100 people’), but such formats are typically misinterpreted by less literate and numerate patients. Consistent with dual coding theory (Paivio Citation1986), adding visual representations of statistical data such as pictographs to numbers can influence people’s understanding and perceptions of risk, and might therefore be a better strategy for communicating personalized risks with comparative data (Garcia-Retamero and Galesic Citation2010; Lipkus Citation2007; Bonner et al. Citation2021). However, pictographs have also been shown to have the highest affective impact through automatic associations (e.g. the color red associates with danger) compared to numbers, which in turn may impact people’s perceptions and evaluations (Chua, Yates, and Shah Citation2006; Timmermans, Ockhuysen-Vermey, and Henneman Citation2008; Visschers et al. Citation2012). Especially in a situation when a patient’s personalized risk is above average, communicating this both numerically and visually may cause people to be unintentionally worried about the information. As such, the second aim of this study was to determine whether people’s responses to comparative information might be influenced by the message format. We hypothesize that (H2) people receiving personalized risks presented in a numerical + visual format will show higher (a) risk estimates, (b) risk perceptions, and (c) affective evaluations than participants viewing the same personalized risks presented in a numerical-only format, especially when people receive personalized risks that are above average (H3).
Finally, as an exploratory objective, we also wanted to examine the extent to which individual differences might influence people’s responses to comparative risk data. Indeed, a substantial body of research suggest that people may differ in their perceptions and interpretations of the same risk information. For instance, females tend to have higher risk perceptions than men for a wide range of risks (Slovic Citation1999; Xiao and McCright Citation2015; van der Linden Citation2015). In addition to gender, age (being older) and education (having limited formal education) also tend to be associated with increased risk perceptions (van der Linden Citation2015; Akerlof et al. Citation2013). Similarly, in all segments of society, people who are less numerate, health literate, or graph literate typically have higher risk perceptions and/or problems interpreting multiple risks compared to their counterparts (Peters Citation2020; Galesic and Garcia-Retamero Citation2011; van der Heide et al. Citation2013; Nelson et al. Citation2008). Therefore, a third aim of our study was to explore whether the effects differ for people with different sociodemographics, subjective numeracy, health literacy, and graph literacy skills. The study design, hypotheses, exploratory objectives, and analysis plan were pre-registered prior to data collection (https://tiu.nu/osf/q2dcz).
Materials and methods
Study design and sampling
In a large-scale experiment, participants were presented with three health scenarios and personalized risk of treatment side-effects, for which we adopted a 3 (comparative information: personalized-risk only, personalized risk above average, personalized risk below average) × 2 (message format: numerical-only, numerical + visual) between-subjects design. Ethical approval was granted by the Research Ethics and Data Management Committee of the Tilburg School of Humanities and Digital Sciences (ID.REDC.2019.26a).
A representative sample of the Dutch population (age ≥ 16) was recruited through CentERdata’s Longitudinal Internet Studies for the Social Sciences panel. This panel consists of 5,000 households in the Netherlands, comprising approximately 7,500 individuals, and represents a true probability sample of households drawn from the population register by Statistics Netherlands (Scherpenzeel Citation2011). Panel members complete online questionnaires every month for which they receive financial compensation. As part of the pre-registration, power calculations were conducted to determine our sample size using G*Power 3.1.9.2 (Faul et al. Citation2007). To detect a small effect for the primary measures with a 3 × 2 between-subject design, a sample of 1269 participants was calculated to be needed for the experiment (power = 0.9, α = .05). Given that we were interested in exploring individual difference measures, we aimed for a total of 1800 participants (300 per experimental condition).
Materials
Health scenarios and personalized risks
Participants read three health scenarios and treatment information in a randomized order: chemotherapy for advanced colon cancer, medication for increased cholesterol levels, and surgery for skin cancer. We selected these scenarios to represent various diseases, treatment options, and associated side-effects, as well as for variation in the actual probability estimate of experiencing side-effects. In each scenario, participants were asked to imagine being diagnosed with that specific disease and that they were given a website from their doctor including information about treatment and its associated side-effects. Participants received personalized risks of experiencing a treatment side-effect, which was always a fictitious number and held constant for each participant across experimental conditions. Participants were informed that their risks were personalized based on their reported gender, age, and specific information about the disease as stated in the scenario. For colon cancer, the risk of experiencing neuropathy after chemotherapy was 38%. For increased cholesterol, the risk of gastrointestinal complaints after medication was 25%. For skin cancer, the risk of inflammation of the skin surrounding the wound after surgery was 17%.
Comparative information
Participants either received their personalized risk without comparative data (personalized risk-only), or they received their personalized risk together with a lower generic risk (personalized risk above average) or together with a higher generic risk (personalized risk below average). A generic risk was defined as the risk for all people of all ages diagnosed with all forms of colon/skin cancer or all cholesterol levels. We varied the absolute risk difference between the personalized and generic risks in the three health scenarios. These absolute risk differences were arbitrarily chosen, and were ± 20% for the colon cancer scenario, ± 15% for the increased cholesterol scenario, and ± 10% for the skin cancer scenario.
Message format
Half of the participants received the risk in numbers (numerical-only format) using natural frequencies. The other half received the risk in a combination of natural frequencies and visual aids using icon arrays (numerical + visual format). As recommended by Zikmund-Fisher et al. (Citation2014), the icons included a matrix of 100 restroom icons displayed in different colors to represent the number of individuals with (red) or without (grey) experiencing the side-effect ().
Figure 1. Structure of stimulus material within the 3 [comparative risk information: personalized risk-only, personalized risk above average, and personalized risk below average] × 2 [format: numerical-only, numerical + visual) between-subject design, shown for male participants receiving risks about neuropathy after chemotherapy for colon cancer. Participants either received their personalized risk without comparative data, or they received their personalized risk together with a lower generic risk or together with a higher generic risk.
![Figure 1. Structure of stimulus material within the 3 [comparative risk information: personalized risk-only, personalized risk above average, and personalized risk below average] × 2 [format: numerical-only, numerical + visual) between-subject design, shown for male participants receiving risks about neuropathy after chemotherapy for colon cancer. Participants either received their personalized risk without comparative data, or they received their personalized risk together with a lower generic risk or together with a higher generic risk.](/cms/asset/d56619b3-8c17-4510-b9c2-133b0c403d8d/rjrr_a_2128392_f0001_c.jpg)
Measures
After participants had read the risk information, we measured their risk estimate, risk perception, and affective evaluation (primary measures) and their perceived personal relevance and treatment intention (secondary measure). The risk information was always visible when participants were answering the questions, to ensure that we tapped into their interpretations and assessment rather than their memory. This method was repeated for each health scenario, after which we assessed the individual difference measures, background questions, and the participants’ need for personalized and comparative data.
Primary measures
Risk estimates was measured using the question ‘What do you think is the probability you will experience this side-effect’ (measured as a percentage between 0 and 100) (Büchter et al. Citation2014; Vromans et al. Citation2020). Risk perception was measured with two items (‘How likely do you think you would be to experience this side-effect after treatment?’ and ‘How big do you think is the chance that you would be to experience this side-effect after treatment?’, Cronbach’s α = .85) measured on 5-point scales, with 1 as ‘not likely at all’/‘not big’ and 5 as ‘very likely’/‘very big’) (Büchter et al. Citation2014; Vromans et al. Citation2020). Affective evaluation of the risks was measured with three items (‘How frightening/worrisome/serious do you think the information about this side-effect was?’, Cronbach’s α = .90) measured on a 5-point scale, with 1 as ‘not frightening’/‘not worrisome’/‘not serious’ and 5 as ‘very frightening’/‘very worrisome’/‘very serious’ (Timmermans, Ockhuysen-Vermey, and Henneman Citation2008).
Secondary measures
Perceived personal relevance was measured using two items (‘The risk information about the side-effect was made personally for me’ and ‘The way how the risk information was being presented was relevant to me’, Cronbach’s α = .85) measured on 5-point scales, with 1 as ‘strongly disagree’ and 5 as ‘strongly agree’ (Lustria et al. Citation2016). Treatment intention was measured using the question ‘Based on the information that you just read, how likely it is that you will choose this treatment?’ measured on a 5-point scale, with 1 as ‘not likely at all’ and 5 as ‘very likely’ (Timmermans, Ockhuysen-Vermey, and Henneman Citation2008).
Individual difference measures
Subjective numeracy was assessed by the Subjective Numeracy Scale (SNS; Fagerlin, Zikmund-Fisher, and Ubel Citation2007), which is an 8-item self-assessment for determining participants’ quantitative ability and preferences for receiving numerical information (measured on a 6-point scale, with 1 as ‘least numerate’ and 6 as ‘most numerate’, α = .87). The SNS has proven to be a valid and reliable measure, and correlates strongly with objective numeracy measures (Zikmund-Fisher et al. Citation2007). For the current study, we used the Dutch version of the SNS (Heringa et al. Citation2018; Vromans et al. Citation2020). The mean subjective numeracy score was determined by computing the average score of the eight items, with higher scores indicating higher numeracy skills.
Health literacy was measured with the 13-item version of the Short Assessment of Health Literacy in Dutch (SAHL-D; Maat et al. Citation2014). Participants were exposed to multiple choice questions in a randomized order in which they had to select the accurate meaning of health-related words. Each answer was coded as 1 (correct) or 0 (incorrect). A sum score was calculated (range: 0 − 13) with higher scores representing higher health literacy skills.
Graph literacy was assessed with the 4-item version of the Graph Literacy Scale in Dutch (Galesic and Garcia-Retamero Citation2011; Okan et al. Citation2019; van Weert et al. Citation2021), presenting different types of graphs and questions (two open-ended and two multiple choice, in a randomized order) about understanding the information in the graphs. Each answer was scored 1 (correct) or 0 (incorrect). A sum score was calculated (range: 0–4) with higher scores representing higher graph literacy skills.
Background measures
Demographic data (i.e. age (groups), gender and educational level) were extracted from the LISSPANEL database. We also controlled for prior (indirect) experience with the three diseases and/or treatments and/or side-effects that were used in the experiment.
Need for personalized risks and comparative data
We assessed participants’ need for receiving their personalized risks of treatment outcomes by asking ‘Imagine that you’re being informed about potential risks of a treatment. In general, to what extent do you have a need for knowing your personalized risk of experiencing treatment side-effects?’ (measured on a 4-point scale, with 1 as ‘not at all’ and 4 as ‘very much’). Participants’ need for comparative data was assessed by asking ‘Imagine that you’re being informed about your personalized risks of experiencing side-effects after treatment. Would you also want to know what your personalized risk is compared to the average risk?’ (answer options: yes always, yes but only when my personalized risk is better than average, yes but only when my personalized risk is worse than average, no I don’t want to know).
Statistical analyses
We conducted three separate two-way multivariate analyses of covariance (one for each health scenario) with risk estimates, risk perception, and affective evaluation as dependent variables, and comparative information and message format as independent variables. We controlled for age, gender, education, and individual differences (numeracy, health literacy, and graph literacy) by entering them as covariates. If applicable, significant interaction effects were further analyzed by means of simple effect analyses. We used pre-specified contrasts to assess whether personalized risks above average yielded higher levels of (a) estimated risks, (b) perceived risks and (c) affective evaluations compared to the other two comparative strategies. We further conducted separate two-way ANCOVAs, with perceived personal relevance and treatment intention as dependent variables, and comparative information and message format as independent variables, and the same demographics and individual differences as covariates.
As an exploratory analysis, we converted numeracy into a binary variable consisting of less (SNS ≤ 4) and highly (SNS ≥ 4) numerate people (Zikmund-Fisher et al. Citation2014), and subsequently tested its association with specific probability estimates (e.g. fifty-fifty response) using chi-square tests for the different comparative risk strategies.
Data on demographics and individual differences for the (1) respondents and non-respondents, and for the (2) six experimental conditions were compared using chi-square tests for categorical variables and ANOVAs for continuous variables. All statistical analyses were performed using SPSS version 24.0 (IBM Corporation, Somers, NY, USA). Tests were two-sided and considered statistically significant at p <. 05.
Results
Sample characteristics
Out of 2,409 people who were invited to participate, 1,807 (75%) clicked the link to launch the survey. Of those, 1753 (97%) fully completed the survey (). Completion rates were high across experimental conditions (range = 90–99%), and only completed cases were analyzed. Fifty-four percent of the sample was female, and the mean age of participants was 53.9 years (SD = 18.3, range = 16–95 years). Overall, this sample was largely representative of the Dutch population.Footnote1 There were no differences between respondents and non-respondents when comparing gender and education (). However, non-respondents were on average younger (ps < .001). Finally, the participants in all six experimental conditions were comparable in terms of sociodemographic characteristics, numeracy, health literacy, and graph literacy skills (all p values >. 590, , Appendix A).
Figure 2. Flowchart of the data collection process.
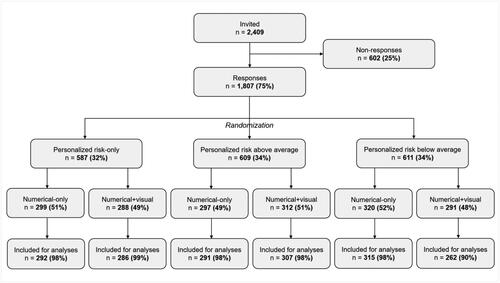
Table 1. Sociodemographic characteristics of respondents and non-respondents.
Table A1. Sociodemographic characteristics and individual difference scores by experimental condition.
Effects on outcomes in the colon cancer scenario
Descriptive statistics for all outcomes in the colon cancer scenario are shown in , and all test statistics can be found in Appendix B (). There was a significant effect of comparative information on people’s estimated risks, F(2, 1741) = 8.27, p < .001, ηp2 = .009. Participants who received personalized risks that were above average reported significantly lower probability estimates than participants who received the same personalized risks that were below average (p < .001) or that were without any comparative information (p = .008) (). However, there were no significant main effects of comparative information on perceived risk, affective evaluations, perceived personal relevance, or treatment intention (all ps > .182). Overall, these (non-)effects of comparative information did not depend on the message format (all ps > .120).
Figure 3. Risk estimates as a function of comparative risk strategy, shown for all three health scenarios.
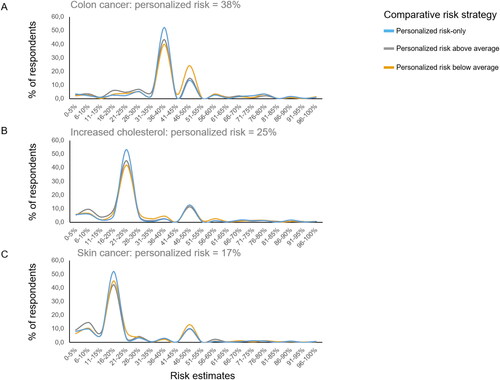
Table 2. Participants’ mean scores on the primary and secondary outcomes in the colon cancer scenario across all experimental conditions.
Table B1. Main and interaction effects on primary outcome measures resulting from a 3 × 2 MANCOVA and on the secondary outcome variables resulting from two separate 3 × 2 ANCOVAs for the colon cancer scenario.
Furthermore, there was no effect of message format on people’s estimated risks, perceived risks, affective evaluations, or perceived personal relevance (all ps > .834). However, participants who received risk information in a numerical-only format were more likely to take the treatment compared to participants who received the information in a numerical + visual format (F(1, 1741) = 4.04, p = .045, ηp2 = .002).
Effects on outcomes in the increased cholesterol scenario
Descriptive statistics for all outcomes in the increased cholesterol scenario are shown in , and all test statistics can be found in (Appendix B). The pattern of results for the effects of comparative information are almost similar to that of the first health scenario. There was a significant effect of comparative information on people’s estimated risks, F(2, 1741) = 3.65, p < .026, ηp2 = .004. Participants who received personalized risks that were above average reported significantly lower probability estimates than participants who received the same personalized risks that were below average (p < .010) or that were without any comparative information (p = .048) (). Again, there were no significant main effects of comparative information on perceived risk, affective evaluations, or treatment intention (all ps > .244). However, there was a significant main effect of comparative information on perceived personal relevance (F(2, 1741) = 3.73, p = .024, ηp2 = .004), with participants perceiving personalized risks that were below average as more personally relevant than personalized risks without comparative data (p = .022). Similar to the previous scenario, these (non-)effects of comparative information did not depend on the message format (all ps > .083).
Table 3. Participants’ mean scores on the primary and secondary outcomes in the increased cholesterol scenario across all experimental conditions.
Table B2. Main and interaction effects on primary outcome measures resulting from a 3 × 2 MANCOVA and on the secondary outcome variables resulting from two separate 3 × 2 ANCOVAs for the increased cholesterol scenario.
Furthermore, there was a significant main effect of message format on risk perception (F(1, 1741) = 5.47, p = .019, ηp2 = .003) and affective evaluation (F(1, 1741) = 4.20, p = .041, ηp2 = .002). Participants in the numerical + visual format reported lower levels of perceived risk and affective impact of the risk information compared to participants who received the same personalized risks in a numerical-only format. There were no significant main effects of message format on risk estimates, perceived relevance, or treatment intention (all ps > .681).
Effects on outcomes in the skin cancer scenario
Descriptive statistics for all outcomes in the skin cancer scenario are shown in , and all test statistics can be found in (Appendix B). The pattern of results for the effects of comparative information are almost similar to that of the other two health scenarios; there were again no significant main effects of comparative information on people’s perceived risks, affective evaluations, or treatment intentions (all ps > .272). However, this time, there was no effect of comparative information on participants’ estimated risks, F(2, 1741) = 1.28, p = .279, ηp2 = .001. Furthermore, similar to the previous scenario, there was a significant main effect on perceived personal relevance (F(2, 1741) = 3.26, p = .039, ηp2 = .004), with participants perceiving personalized risks that were below average as more personally relevant than personalized risks without comparative data (p = .034). Overall, these (non-)effects of comparative information did not depend on the message format (all ps > .099).
Table 4. Participants’ mean scores on the primary and secondary outcomes in the skin cancer scenario across all experimental conditions.
Table B3. Main and interaction effects on primary outcome measures resulting from a 3 × 2 MANCOVA and on the secondary outcome variables resulting from two separate 3 × 2 ANCOVAs for the skin cancer scenario.
Furthermore, similar to the second scenario, there was a significant main effect of message format on affective evaluation (F(1, 1741) = 10.15, p = .001, ηp2 = .006). Participants in the numerical + visual format reported lower levels of affective impact of the risk information compared to participants who received the same personalized risks in a numerical-only format. Again, there were no significant main effects of message format on risk estimates, risk perception, perceived relevance, or treatment intention (all ps > .062).
Exploratory findings: individual differences and need for personalized risks
We observed some important differences between people with different subjective numeracy skills on a range of different measures. First, regardless of message format or comparative risk strategy, less numerate people had less accurate risk estimates and were less likely to take over the personalized risk they were provided with compared to highly numerate participants in all three health scenarios (χ2skincancer(1, 1784) = 153.25, p < .001; χ2cholesterol(1, 1784) = 142.20, p < .001; χ2coloncancer(1, 1784) = 158.08 p < .001). Moreover, less numerate people were more likely to estimate their risk as 50% percent compared to highly numerate people (χ2skincancer(1, 1784) = 35.81, p < .001; χ2cholesterol(1, 1784) = 44.59, p < .001; χ2coloncancer(1, 1784) = 18.16, p < .001).
Even though our sample showed great interest in receiving personalized risk of treatment side-effects (70.6% reported to have quite a bit or very much need, 22.5% a little need, and 6.9% no need at all), less numerate people also showed less interest in wanting personalized risks (M = 2.72, SD = 0.99) than highly numerate people (M = 3.19, SD = 0.86); t(1673) = 10.43, p < .001, d = 0.51). If people were being provided with their personalized risk score, the majority also wanted to receive comparative information (73.5%), whereas some only wanted to receive comparative data when their personalized risks were better (7.4%) or worse (11.7%), and few did not want to receive comparative data (7.4%). However, both less (65%) and highly (78.1%) numerate people showed great need for receiving comparative information.
Discussion
In this experimental study, we found that comparative data of the average person’s risk can be used by people for estimating their own personalized risk, without negatively impacting their risk perceptions, affective evaluations, or treatment intentions. Processing of comparative information was not influenced by whether it was presented via numbers-only or combined with visual information, nor did it not differ for people with varying sociodemographic characteristics and different levels of subjective numeracy, health literacy, and graph literacy skills.
These findings are in contrast with our pre-registered hypothesis (H1) and previous research on this topic (Zikmund-Fisher, Fagerlin, and Ubel Citation2010; Fagerlin, Zikmund-Fisher, and Ubel Citation2007; French et al. Citation2004; Klein Citation2003; Han et al. Citation2011). People who received contextual information indicating that their personalized risk was above the generic risk did not report higher risk perceptions and did not evaluate the information as more frightening or worrisome compared to people who received the same personalized risks that were below average or without any comparative information. A possible explanation could be that we investigated the effects of comparative data in the context of personalized side-effect risks of treatment options, whereas previous research was carried out in the screening context, emphasizing the risk of getting a disease such as breast cancer (Fagerlin, Zikmund-Fisher, and Ubel Citation2007; Han et al. Citation2011). Moreover, given that we did not discuss any risk factors that contributed to the personalized risk score, it may also be that participants found it difficult to fully understand why exactly their personalized risk deviated from the average person’s risk (Vromans et al. Citation2022; Zikmund-Fisher Citation2019). However, our results do corroborate with researchers who are in favor of disclosing comparative information (Schwartz Citation2009, Citation2016), and are also strengthened by the fact that the vast majority of our sample reported a high need for receiving comparative data when being provided with personalized risks (Fagerlin, Zikmund-Fisher, and Ubel Citation2007).
One unanticipated finding was that, on average, people’s risk estimates were influenced by comparative information, but in the opposite direction of our hypothesis (H1). We expected that people’s risk estimates would—jointly with their risk perceptions and affective evaluations—increase when showing people that their personalized risk is above average. Generally, even when people are being provided with numerical risks, they tend to overestimate their own risk estimate (Knapp, Raynor, and Berry Citation2004; Knapp et al. Citation2010; Vromans et al. Citation2020). In two out of three health scenarios, people used the average risk for determining their own risk score by reporting lower risk estimates when being provided with relatively less favorable information, and higher risk estimates when being provided with more favorable risk information. These results suggest that people do not ignore comparative data when estimating their own risk. Additionally, distributions plots of people’s risk estimate showed that most people take over the personalized risk score they were provided with, thereby demonstrating accurate risk estimates. However, less numerate people were more likely to estimate their own risk as ‘fifty-fifty’ and less likely to take over their personalized risk score compared to highly numerate participants. These ‘fifty-fifty’ responses may represent answers such as ‘don’t know’, especially among less educated and numerate people (Bruine De Bruin and Carman Citation2012). Although people’s responses to comparative information did not depend on numeracy skills, the different risk estimates patterns of less numerate people may invite further research to examine whether providing comparative data may be beneficial or detrimental for less numerate people.
The results found for comparative information did not depend on whether risks were communicated via natural frequencies or combined with colored icon arrays. However, regardless of comparative risk strategy, in two out of three scenarios, numbers combined with visual information were evaluated as less affective compared to numerical risks without visual information. It has been suggested that some graphical formats, such as icon arrays or pictographs, may be affect-inducing formats through automatic associations (e.g. the color red may be associated with danger), which may have an impact on people’s risk perceptions and emotional responses (Chua, Yates, and Shah Citation2006; Visschers et al. Citation2012). Our result, which is the opposite of our expectation (H2), can thus possibly be explained by the fact that these health scenarios contained lower risk estimates, and therefore presented icon arrays displaying less people affected by the risks in red (and therefore more nonaffected people in grey). Overall, these findings did not depend on whether risks were presented with or without comparative information (H3), nor on people’s graphical literacy skills.
This study is an improvement over previous research, specifically by utilizing a large representative sample of the Dutch population. This allowed us to examine the effects of comparative information, while testing influential factors such as message format, and controlling for numeracy, health literacy, and graph literacy. Other strengths are that we tested the effects across three different health scenarios, and that we pre-registered our study before data collection. However, our findings are limited to the use of hypothetical treatment decision-making scenarios; even though this is a common research strategy, a general limitation of this method is that we cannot be sure whether results fully generalize to participants experiencing real consequences of their perceptions and decisions (Schmiege, Klein, and Bryan Citation2010). Whether our findings are similar or different in real-world clinical settings and decision-making contexts should be investigated in future research.
We believe that our study results have implications for both research and practice. First, the findings directly add to two recently published review articles on communicating outcome probabilities as part of the 2021 evidence update for the International Patient Decision Aids Standards Collaboration (Trevena et al. Citation2021; Bonner et al. Citation2021). These reviews particularly highlight (1) the need for more systematic research on the usage and effects of personalized risks in the context of treatment decision-making (Trevena et al. Citation2021), but also emphasize (2) the importance of communicating risk estimates in context and evaluative labels including strategies such as comparative data for helping people make sense of their health risks (Bonner et al. Citation2021). By experimentally testing different presentation format for conveying health risks that are personalized towards the user characteristics, and taking into account the variability in numeracy, health literacy, and graph literacy skills, the results of our study will make an important contribution to field of risk communication and shared decision-making. Second, our results may help decision aid developers who wish to personalize risk estimates within their tools (Vromans, Tenfelde et al., Citation2019; Vromans, van Eenbergen et al. Citation2019; Hommes et al. Citation2021). Knowing the conditions under which circumstances, for instance, comparative information and visual displays are most associated with risk perception, worry, or treatment decision-making might help the design of effective personalized risk information tools. This could help patients to become more involved in shared decision-making with their doctor, so that they can jointly make a well-informed decision about treatment.
Conclusion
Despite the ongoing debate, our results suggest that healthcare professionals can consider providing comparative data when communicating personalized risks of treatment outcomes. Comparative data can be used for especially estimating people’s own risk, without negatively impacting their risk perceptions, affective evaluations, or treatment intentions. Future research should confirm our findings in real-world decision-making scenarios, and explore which people are particularly influenced by comparative risk data.
Disclosure statement
This work was supported entirely by the Data Science Center Tilburg (DSC/t) and in part by the Netherlands Organisation for Scientific Research (NWO) (Grant No. 628.001.030).
Data availability statement
The data can be accessed via https://tiu.nu/osf/q2dcz.
Additional information
Funding
Notes
1 Our sample was slightly older than the mean age (49.5 years) of the Dutch population, Mdiff = 4.47, 95% CI [3.64, 5.32], t(1806) = 10.42, p < .001), and represented slightly more females (50.7%).
References
- Akerlof, Karen, Edward W. Maibach, Dennis Fitzgerald, Andrew Y. Cedeno, and Amanda Neuman. 2013. “Do People ‘Personally Experience’ Global Warming, and If so How, and Does It Matter?” Global Environmental Change 23 (1): 81–91. doi:10.1016/j.gloenvcha.2012.07.006.
- Bonner, Carissa, Lyndal J. Trevena, Wolfgang Gaissmaier, Paul K. J. Han, Yasmina Okan, Elissa Ozanne, Ellen Peters, Daniëlle Timmermans, and Brian J. Zikmund-Fisher. 2021. “Current Best Practice for Presenting Probabilities in Patient Decision Aids: Fundamental Principles.” Medical Decision Making 41 (7): 821–833. doi:10.1177/0272989X21996328.
- Bruine De Bruin, Wändi, and Katherine G. Carman. 2012. “Measuring Risk Perceptions: What Does the Excessive Use of 50% Mean?” Medical Decision Making: An International Journal of the Society for Medical Decision Making 32 (2): 232–236. doi:10.1177/0272989X11404077.
- Büchter, Roland Brian, Dennis Fechtelpeter, Marco Knelangen, Martina Ehrlich, and Andreas Waltering. 2014. “Words or Numbers? Communicating Risk of Adverse Effects in Written Consumer Health Information: A Systematic Review and Meta-Analysis.” BMC Medical Informatics and Decision Making 14 (1): S76. doi:10.1186/1472-6947-14-76.
- Chawla, Nitesh V, and Darcy A. Davis. 2013. “Bringing Big Data to Personalized Healthcare: A Patient-Centered Framework.” Journal of General Internal Medicine 28 (S3): 660–665. doi:10.1007/s11606-013-2455-8.
- Chua, H. F., F. Yates, and P. Shah. 2006. “Risk Avoidance: Graphs versus Numbers.” Memory & Cognition 34 (2): 399–410. doi:10.3758/bf03193417.
- Elwyn, Glyn, Marie Anne Durand, Julia Song, Johanna Aarts, Paul J. Barr, Zackary Berger, Nan Cochran, et al. 2017. “A Three-Talk Model for Shared Decision Making: Multistage Consultation Process.” BMJ (Clinical Research ed.) 359: j4891. doi:10.1136/bmj.j4891.
- Fagerlin, Angela, Brian J. Zikmund-Fisher, and Peter A. Ubel. 2007. “If I’m Better than Average, Then I’m Ok?’: Comparative Information Influences Beliefs about Risk and Benefits.” Patient Education and Counseling 69 (1-3): 140–144. doi:10.1016/j.pec.2007.08.008.
- Fagerlin, Angela, Brian J. Zikmund-Fisher, Peter A. Ubel, Aleksandra Jankovic, Holly A. Derry, and Dylan M. Smith. 2007. “Measuring Numeracy without a Math Test: Development of the Subjective Numeracy Scale.” Medical Decision Making 27 (5): 672–680. doi:10.1177/0272989X07304449.
- Faul, F., E. Erdfelder, A.-G. Lang, and A. Buchner. 2007. “G * Power 3: A Flexible Statistical Power Analysis Program for the Social, Behavioral, and Biomedical Sciences.” Behavior Research Methods 39 (2): 175–191. doi:10.3758/bf03193146.
- French, David P., Stephen R. Sutton, Theresa M. Marteau, and Ann Louise Kinmonth. 2004. “The Impact of Personal and Social Comparison Information about Health Risk.” British Journal of Health Psychology 9 (Pt 2): 187–200. doi:10.1348/135910704773891041.
- Galesic, Mirta, and Rocio Garcia-Retamero. 2011. “Graph Literacy: A Cross-Cultural Comparison.” Medical Decision Making: An International Journal of the Society for Medical Decision Making 31 (3): 444–457. doi:10.1177/0272989X10373805.
- Garcia-Retamero, Rocio, and Mirta Galesic. 2010. “Who Profits from Visual Aids: Overcoming Challenges in People’s Understanding of Risks.” Social Science & Medicine (1982) 70 (7): 1019–1025. doi:10.1016/j.socscimed.2009.11.031.
- Han, Paul K. J., William M. P. Klein, Tom Lehman, Bill Killam, Holly Massett, and Andrew N. Freedman. 2011. “Communication of Uncertainty regarding Individualized Cancer Risk Estimates: Effects and Influential Factors.” Medical Decision Making: An International Journal of the Society for Medical Decision Making 31 (2): 354–366. doi:10.1177/0272989X10371830.
- Heide, Iris van der, Jany Rademakers, Maarten Schipper, Mariël Droomers, Kristine Sorensen, and Ellen Uiters. 2013. “Health Literacy of Dutch Adults: A Cross Sectional Survey.” BMC Public Health 13 (1): 179. doi:10.1186/1471-2458-13-179.
- Heringa, Mette, Annemieke Floor-Schreudering, Hans Wouters, Peter A. G. M. De Smet, and Marcel L. Bouvy. 2018. “Preferences of Patients and pharmacists with Regard to the Management of Drug–Drug Interactions: A Choice-Based Conjoint Analysis.” Drug Safety 41 (2): 179–189. doi:10.1007/s40264-017-0601-7.
- Hommes, S., D. Ruben, F. J. Vromans, X. Clouth, I. de Hingh Verbeek, and Emiel J. Krahmer. 2021. “Communication in Decision Aids for Stage I-III Colorectal Cancer Patients : A Systematic Review.” BMJ Open 11 (4): e044472. doi:10.1136/bmjopen-2020-044472.
- Hsee, C. K. 1996. “The Evaluability Hypothesis: An Explanation for Preference Reversals between Joint and Separate Evaluations of Alternatives.” Organizational Behavior and Human Decision Processes 67 (3): 247–257. doi:10.1006/obhd.1996.0077.
- Hsee, Christopher K, and Jiao Zhang. 2010. “General Evaluability Theory.” Perspectives on Psychological Science: A Journal of the Association for Psychological Science 5 (4): 343–355. doi:10.1177/1745691610374586.
- Klein, William M. P. 2003. “Self-Prescriptive, Perceived, and Actual Ettention to Comparative Risk Information.” Psychology & Health 18 (5): 625–643. doi:10.1080/0887044031000118465.
- Knapp, P., D. K. Raynor, and D. C. Berry. 2004. “Comparison of Two Methods of Presenting Risk Information to Patients about the Side Effects of Medicines.” Quality and Safety in Health Care 13 (3): 176–180. doi:10.1136/qshc.2003.009076.
- Knapp, Peter, Peter H. Gardner, David K. Raynor, Elizabeth Woolf, and Brian McMillan. 2010. “Perceived Risk of Tamoxifen Side Effects: A Study of the Use of Absolute Frequencies or Frequency Bands, with or without Verbal Descriptors.” Patient Education and Counseling 79 (2): 267–271. doi:10.1016/j.pec.2009.10.002.
- Linden, Sander van der. 2015. “The Social-Psychological Determinants of Climate Change Risk Perceptions: Towards a Comprehensive Model.” Journal of Environmental Pstchology 41: 112–124. doi:10.1080/13504622.2015.1108391.
- Lipkus, Isaac M. 2007. “Numeric, Verbal, and Visual Formats of Conveying Health Risks: Suggested Best Practices and Future Recommendations.” Medical Decision Making: An International Journal of the Society for Medical Decision Making 27 (5): 696–713. doi:10.1177/0272989X07307271.
- Lustria, Mia Liza A., Juliann Cortese, Mary A. Gerend, Karla Schmitt, Ying Mai Kung, and Casey McLaughlin. 2016. “A Model of Tailoring Effects: A Randomized Controlled Trial Examining the Mechanisms of Tailoring in a Web-Based STD Screening Intervention.” Health Psychology : official Journal of the Division of Health Psychology, American Psychological Association 35 (11): 1214–1224. doi:10.1037/hea0000399.
- Lyles, C. R., E. C. Nelson, S. Frampton, P. C. Dykes, A. G. Cemballi, and U. Sarkar. 2020. “Using Electronic Health Record Portals to Improve Patient Engagement: Research Priorities and Best Practices.” Annals of Internal Medicine 172 (11 Suppl): S123–S129. doi:10.7326/M19-0876.
- Maat, Henk Pander, Marie-Louise Essink-Bot, Karlijn E. F. Leenaars, and Mirjam P. Fransen. 2014. “A Short Assessment of Health Literacy (SAHL) in The Netherlands.” BMC Public Health 14: 990–998. doi:10.1186/1471-2458-14-990.
- Nelson, Wendy, Valerie F. Reyna, Angela Fagerlin, Isaac Lipkus, and Ellen Peters. 2008. “Clinical Implications of Numeracy: Theory and Practice.” Annals of Behavioral Medicine: A Publication of the Society of Behavioral Medicine 35 (3): 261–274. and doi:10.1007/s12160-008-9037-8.
- Oerlemans, Simone, Lindy P. Arts, Nicole J. Horevoorts, and Lonneke V. Van De Poll-Franse. 2017. “Am I Normal?’ The Wishes of Patients with Lymphoma to Compare Their Patient-Reported Outcomes with Those of Their Peers.” Journal of Medical Internet Research 19 (8): e288. doi:10.2196/jmir.7079.
- Okan, Yasmina, Eva Janssen, Mirta Galesic, and Erika A. Waters. 2019. “Using the Short Graph Literacy Scale to Predict Precursors of Health Behavior Change.” Medical Decision Making: An International Journal of the Society for Medical Decision Making 39 (3): 183–195. doi:10.1177/0272989X19829728.
- Paivio, A. 1986. Mental Representations: A Dual-Coding Approach. New York, NY: Oxford University Press.
- Peters, Ellen. 2020. Innumeracy in the Wild: Misunderstanding and Misusing Numbers. Oxford: Oxford University Press.
- Petty, Richard E., and John T. Cacioppo. 1986. “The Elaboration Likelihood Model of Persuasion.” Advances in Experimental Social Psychology 19: 123–205. doi:10.1016/S0065-2601(08)60214-2.
- Scherpenzeel, Annette. 2011. “Data Collection in a Probability-Based Internet Panel: How the LISS Panel Was Built and How It Can Be Used.” Bulletin of Sociological Methodology/Bulletin de Méthodologie Sociologique 109 (1): 56–61. doi:10.1177/0759106310387713.
- Schilsky, R. L. 2010. “Personalized Medicine in Oncology: The Future is Now.” Nature Reviews Drug Discovery 9 (5): 363–366. doi:10.1511/2011.89.163.
- Schmiege, S. J., W. M. P. Klein, and A. D. Bryan. 2010. “The Effect of Peer Comparison Information in the Context of Expert Recommendations on Risk Perceptions and Subsequent Behavior.” European Journal of Social Psychology 40: 747–759. doi:10.1002/ejsp.
- Schwartz, Peter H. 2009. “Disclosure and Rationality: Comparative Risk Information and Decision-Making about Prevention.” Theoretical Medicine and Bioethics 30 (3): 199–213. doi:10.1007/s11017-009-9111-7.
- Schwartz, Peter H. 2016. “Comparative Risk: Good or Bad Heuristic?” The American Journal of Bioethics 16 (5): 20–22. doi:10.1080/15265161.2016.1159765.
- Slovic, Paul. 1999. “Trust, Emotion, Sex, Politics and Science: Surveying the Risk-Assessment Battlefield.” Risk Analysis 19 (4): 689–701. doi:10.1111/j.1539-6924.1999.tb00439.x.
- Thurtle, D., V. Jenkins, A. Freeman, M. Pearson, G. Recchia, P. Tamer, K. Leonard, et al. 2021. “Clinical Impact of the Predict Prostate Risk Communication Tool in Men Newly Diagnosed with Non-Metastatic Prostate Cancer: A Multi-Centre Randomised Controlled Trial.” European Urology 79: S1446–S1447. doi:10.1016/S0302-2838(21)01401-9.
- Tillier, Corinne N., Ruben D. Vromans, Annelies H. Boekhout, Hans Veerman, Barbara M. Wollersheim, Henricus A. M. van Muilekom, Thierry N. Boellaard, Pim J. van Leeuwen, Lonneke V. van de Poll-Franse, and Henk G. van der Poel. 2021. “Individual Risk Prediction of Urinary Incontinence after Prostatectomy and Impact on Treatment Choice in Patients with Localized Prostate Cancer.” Neurourology and Urodynamics 40 (6): 1550–1558. doi:10.1002/nau.24703.
- Timmermans, Daniëlle R. M., Caroline F. Ockhuysen-Vermey, and Lidewij Henneman. 2008. “Presenting Health Risk Information in Different Formats: The Effect on Participants’ Cognitive and Emotional Evaluation and Decisions.” Patient Education and Counseling 73 (3): 443–447. doi:10.1016/j.pec.2008.07.013.
- Trevena, Lyndal J., Carissa Bonner, Yasmina Okan, Ellen Peters, Wolfgang Gaissmaier, Paul K. J. Han, Elissa Ozanne, Danielle Timmermans, and Brian J. Zikmund-Fisher. 2021. “Current Challenges When Using Numbers in Patient Decision Aids: Advanced Concepts.” Medical Decision Making 41 (7): 834–847. doi:10.1177/0272989X21996342.
- Visschers, V. H. M., P. M. Wiedemann, H. Gutscher, S. Kurzenhäuser, R. Seidl, C. G. Jardine, and D. R. M. Timmermans. 2012. “Affect-Inducing Risk Communication: Current Knowledge and Future Directions.” Journal of Risk Research 15 (3): 257–271. doi:10.1080/13669877.2011.634521.
- Vromans, Ruben, Kim Tenfelde, Steffen Pauws, Mies Van Eenbergen, Ingeborg Mares-Engelberts, Galina Velikova, Lonneke Van De Poll-Franse, and Emiel Krahmer. 2019. “Assessing the Quality and Communicative Aspects of Patient Decision Aids for Early-Stage Breast Cancer Treatment: A Systematic Review.” Breast Cancer Research and Treatment 178 (1): 1–15. doi:10.1007/s10549-019-05351-4.31342311.
- Vromans, Ruben D., Mies C. H. J. van Eenbergen, Gijs Geleijnse, Steffen C. Pauws, Lonneke V. van de Poll-Franse, and Emiel J. Krahmer. 2021. “Exploring Cancer Survivor Needs and Preferences for Communicating Personalized Cancer Statistics from Registry Data: Qualitative Multimethod Study.” JMIR Cancer 7 (4): e25659. doi:10.2196/25659.
- Vromans, Ruben D., Mies C. van Eenbergen, Steffen C. Pauws, Gijs Geleijnse, Henk G. van der Poel, Lonneke V. van de Poll-Franse, and Emiel J. Krahmer. 2019. “Communicative Aspects of Decision Aids for Localized Prostate Cancer Treatment—A Systematic Review.” Urologic Oncology 37 (7): 409–429. doi:10.1016/j.urolonc.2019.04.005.
- Vromans, Ruben D., Steffen C. Pauws, Nadine Bol, Lonneke V. van de Poll-Franse, and Emiel J. Krahmer. 2020. “Communicating Tailored Risk Information of Cancer Treatment Side Effects: Only Words or Also Numbers?” BMC Medical Informatics and Decision Making 20 (1): 277. doi:10.1186/s12911-020-01296-7.
- Vromans, Ruben D., Corinne N. Tillier, Steffen C. Pauws, Henk G. Van Der Poel, Lonneke V. Van De Poll-Franse, and Emiel J. Krahmer. 2022. “Communication, Perception, and Use of Personalized Side-Effect Risks in Prostate Cancer Treatment-Decision Making: An Observational and Interview Study.” Patient Education and Counseling 105 (8): 2731–2739. doi:10.1016/j.pec.2022.04.017.
- Waters, Erika A., Angela Fagerlin, and Brian J. Zikmund-Fisher. 2016. “Overcoming the Many Pitfalls of Communicating Risk.” In Handbook of Health Decision Science, edited by Michael A. Diefenbach, S. Miller-Halegoua, and D. J. Bowen, 265–277. New York, NY: Springer.
- Weert, Julia C. M van, Monique C. Alblas, Liset van Dijk, and Jesse Jansen. 2021. “Preference for and Understanding of Graphs Presenting Health Risk Information. The Role of Age, Health Literacy, Numeracy and Graph Literacy.” Patient Education and Counseling 104 (1): 109–117. doi:10.1016/j.pec.2020.06.031.
- Xiao, Chenyang, and Aaron M. McCright. 2015. “Gender Differences in Environmental Concern: Revisiting the Institutional Trust Hypothesis in the USA.” Environment and Behavior 47 (1): 17–37. doi:10.1177/0013916513491571.
- Zikmund-Fisher, Brian J. 2019. “Helping People Know Whether Measurements Have Good or Bad Implications: Increasing the Evaluability of Health and Science Data Communications.” Policy Insights from the Behavioral and Brain Sciences 6 (1): 29–37. doi:10.1177/2372732218813377.
- Zikmund-Fisher, Brian J., Nicole L. Exe, and Holly O. Witteman. 2014. “Numeracy and Literacy Independently Predict Patients’ Ability to Identify out-of-Range Test Results.” Journal of Medical Internet Research 16 (8): e187. doi:10.2196/jmir.3241.
- Zikmund-Fisher, Brian J., Angela Fagerlin, and Peter A. Ubel. 2010. “Risky Feelings: Why a 6% Risk of Cancer Does Not Always Feel like 6%.” Patient Education and Counseling 81 (SUPPL. 1): S87–S93. doi:10.1016/j.pec.2010.07.041.
- Zikmund-Fisher, Brian J., Dylan M. Smith, Peter A. Ubel, and Angela Fagerlin. 2007. “Validation of the Subjective Numeracy Scale: Effects of Low Numeracy on Comprehension of Risk Communications and Utility Elicitations.” Medical Decision Making: An International Journal of the Society for Medical Decision Making 27 (5): 663–671. doi:10.1177/0272989X07303824.
- Zikmund-Fisher, Brian J., Holly O. Witteman, Mark Dickson, Andrea Fuhrel-Forbis, Valerie C. Kahn, Nicole L. Exe, Melissa Valerio, Lisa G. Holtzman, Laura D. Scherer, and Angela Fagerlin. 2014. “Blocks, Ovals, or People? Icon Type Affects Risk Perceptions and Recall of Pictographs.” Medical Decision Making 34 (4): 443–453. doi:10.1177/0272989X13511706.