?Mathematical formulae have been encoded as MathML and are displayed in this HTML version using MathJax in order to improve their display. Uncheck the box to turn MathJax off. This feature requires Javascript. Click on a formula to zoom.
Abstract
Understanding public debates on environmental problems is critical for enhancing the effectiveness and social acceptance of environmental policies. This article aims to understand how factual environmental condition and culture influence the perceived severity of environmental problems in China. Relying on Cultural Theory and Cultural Cognitive Theory, we measure grid with an egalitarianism-hierarchy scale and group with an individualism–communitarianism scale. We use a large scale nationwide representative survey data——the Chinese General Social Survey——to identify Chinese political subcultures and find that environmental condition alone rarely play a role in Chinese environmental perceptions, and that as hypothesized, moving from egalitarianism to hierarchy, people perceive six of eight environmental problems to be less severe, whereas moving from individualism to communitarianism, people perceive five of eight environmental problems to be more severe. Meanwhile, the effect of environmental condition on the relationship between cultural worldview and perceived severity is very limited. This study has implications for environmental communication.
1. Introduction
How concerned are Chinese about the environmental problems? How does actual condition of environmental problems (hereinafter environmental condition) and cultural worldviews influence the general public’s environmental perceptions of different types of environmental problems? Answering this question is important as existing research has suggested that although environmental concerns among Chinese citizens have become more pronounced in recent years, like their Western counterparts, Chinese citizens’ environmental concerns vary across types of environmental issues (Shen and Saijo Citation2008).
Scholars have investigated how the environmental condition influences environmental risk perceptions and provided evidence that severe environmental problems at place level, such as increasing soot and sulfur dioxide emissions and wastewater discharge, trigger increased public environmental concern (Zheng et al. Citation2014; Liu and Mu Citation2016; Spence et al. Citation2011; Zaval et al. Citation2014). Liu and Mu (Citation2016) further stratified their sample by rural vs. urban residence locations and found that the effects of provincial environmental quality were robust. However, others found no influence of environmental condition on environmental perceptions (Mutz Citation1993; Whitmarsh Citation2008). Inconsistency in empirical findings may be due, in part, to the diverse measurements of environmental conditions (e.g. reported experiences vs. objectively measured environmental risks) and environmental perceptions, and, in part, to variations in geographic scope and nonrepresentative samples, especially in non-U.S. countries ((Xiao, Dunlap and Hong Citation2013; Howe et al. Citation2019). In other cases, scholars investigated more nuanced hypotheses that cognitive reactions and behavioral intentions based on factual evidence of environmental problems could be dependent on other factors such as the types of risks (Terpstra, Lindell, and Gutteling Citation2009), subjective interpretation of environmental problems (Ogunbode et al. Citation2019), knowledge (Mutz Citation1993), and political predisposition including political identity (Egan and MUllin Citation2012; Ogunbode et al. Citation2019), pro-environmental values (Whitmarsh Citation2008), and culture and belief (Kahan, Jenkin-Smith, and Braman Citation2011; Xue et al. Citation2014; Moyer and Song Citation2019).
A stream of research has examined the influence of cultural worldviews or cultural cognitions on risk related perceptions in different types of risks, including climate change (Kahan et al. Citation2012; Kahan Citation2015, Citation2017; Xue et al. Citation2016), nuclear power (Johnson and Swedlow Citation2020), natural disasters (Yang Citation2015; Xue et al. Citation2016; Morss et al. Citation2020), vaccination (Song et al. Citation2014), crime (Yang Citation2015; Reardon and Govender Citation2013), gun-control, abortion (Johnson and Swedlow Citation2020; Kahan Citation2012), public health risks such as Zika (Johnson and Mayorga Citation2021), Ebola (Johnson Citation2017; Mayorga and Johnson Citation2019), and COVID-19 (Siegrist and Bearth Citation2021; Yuan Citation2022), based on the Grid Group Culture Theory (GGCT) (Douglas Citation1970; Douglas and Wildavsky Citation1982). GGCT has not only been applied in risk analyses in Western countries such as the U.S. and European countries but also in non-western countries such as South Africa (Reardon and Govender Citation2013) and South Korea (Yang Citation2015; Kim and Kim Citation2019; Kim and Jung Citation2019) and China (Xue et al. Citation2016; Yuan Citation2022), although some mixed results have caused criticism and some rejection of GGCT from risk analyses scholars (Marris, Langford, and O’Riordan Citation1998; Rippl Citation2002; also review by Johnson and Swedlow Citation2021). More recently, scholars have used GGCT to explain the effects of Chinese citizens’ culture and belief on risk perception of climate change (Xue et al. Citation2014; Xue et al. Citation2016) and environmental concern of ecological environment (Yuan et al. Citation2022).
GGCT defines that culture or social relations vary along two dimensions: group and grid, which yield compatible cultural worldviews influencing public risk perceptions. The traditional measurements of cultural worldview in GGCT are Dake and Wildavsky’s four Cultural Theory Scales (CTS) corresponding to the four cultural worldviews: hierarchy, individualism, egalitarianism, and fatalism (Dake Citation1991, Citation1992; Wildavsky and Dake Citation1990). Inspired by Dake-Wildavsky’s operationalization, Kahan and his colleagues (Kahan et al. Citation2007; Kahan Citation2012) developed CCT that utilizes two indices that fall along a continuum from egalitarian to hierarchy on grid dimension and individualism to communitarianism on group dimension. Specifically, on grid dimension, lower values are more egalitarian and higher values are more hierarchical. On group dimension, lower values are more individualistic and higher values are more communitarian. Existing research found that both CTS and CCT survey measures often cluster as expected (i.e. four worldviews in CTS or two hypothesized dimensions in CCT) in factor analyses (Johnson, Swedlow, and Mayorga Citation2020). Others found that CCT has a higher reliability for the survey items from CCT measurement across countries (Xue et al. Citation2014; Johnson and Swedlow Citation2020). However, CCT only partially captures the meaning of GGCT’s grid and group dimensions (Swedlow et al. Citation2020; Johnson and Swedlow Citation2021) and CTS explain more variance in risk perceptions (Johnson and Swedlow Citation2020). For example, theoretically, both egalitarianism and individualism manifest low grid, and both are opposed to hierarchy. Similarly, studies following Dake-Wildavsky tradition also find hybrids, i.e. strong correlations between hierarchy and individualism in samples from the U.S. (Johnson, Swedlow, and Mayorga Citation2020; Johnson and Swedlow Citation2020; Johnson and Swedlow Citation2021), China (Yuan Citation2022; Yuan et al. Citation2022), and France (Chauvin and Chassang Citation2022). Xue et al. (Citation2016) found that neither set of items from CTS and CCT worked well in China, but combined items can be best represented by four cultures: hierarchy, individualism, egalitarianism, and fatalism. Therefore, cultural scholars have suggested a combination of Dake and Wildavsky’s Cultural Theory Scales (CTS) (Dake Citation1991, Citation1992; Wildavsky and Dake Citation1990) and CCT items (Kahan Citation2012; Kahan Citation2015; Kahan et al. Citation2017) to measure grid and group dimensions in GGCT (Xue et al. Citation2016).
Our research is not the first to operationalize grid and group dimensions based on attitudinal items that may best approximate the character of grid and group proposed by GGCT. For example, Boyle and Coughlin (Citation1994) selected attitudes items about the status of women and traditional sexual morality from General Social Surveys to measure grid, because these items described normative ethical beliefs that had good face validity in measuring whether the respondents accepted (high grid) or rejected (low grid) the traditional prescriptions for gender relations and sexual morality (Boyle and Coughlin Citation1994; Swedlow et al. Citation2020; Kahan Citation2012). Status of women and traditional sexual morality also represented two endpoints—hierarchy and egalitarianism—on grid dimension in CCT. For example, in previous research using CCT (Kahan Citation2012; Kahan et al. Citation2012, Citation2017), agreement with the argument that ‘women and homosexuals……want special rights just for them’ was used to measure hierarchy, and the commitment to equal rights of women was used to measure egalitarianism and reverse-coded to create grid subscale. Among others, attitudinal items about civil liberties were conceptually related to the core value of freedom for individualism and equality for egalitarianism, both belonging to low grid. Individualists and egalitarians (low grid) were reluctant to trade their core values to achieve order (Swedlow and Wyckoff Citation2009) and oppose the expansion of governmental power (Swedlow et al. Citation2020; Johnson, Swedlow, and Mayorga Citation2020; Johnson and Swedlow Citation2020). On the group dimension, the attitude toward the fairness of income distribution can reflect whether the respondents accepted or rejected the current social system. The feeling of unfairness within current society defined the respondents as a bounded group (e.g. high group) in opposition to the dominant society (Boyle and Coughlin Citation1994). Similarly, cultures on the high group, including communitarianism in CCT, supported the belief that everyone’s basic needs should be met (Swedlow et al. Citation2020; Kahan Citation2012) and everyone should be paid fairly (Chai, Liu, and Kim Citation2009). By contrast, individualism on the group dimension in CCT supported the unequal distribution of wealth and believed that people had a right to enjoy wealth from their hard working (Kahan Citation2012). Questions regarding how much time was spent with families and friends implied high or low (group) levels of sociality characteristic of group (Boyle and Coughlin Citation1994; Chai, Liu, and Kim Citation2009).
Arguably, environmental conditions and cultural worldviews are not necessarily in conflict in explaining the variation in the public’s environmental perceptions. For example, cultural scholars suggest a culturally biased assimilation effect that individuals may selectively accept factual evidence of environmental problems that reinforce their cultures, but dismiss others (Kahan Citation2012). However, existing research has not empirically tested whether individuals with diverse cultural worldviews react to environmental risks differently as actual environmental problems become more severe. Only Baxter’s research (2009) has so far studied the moderating effect of proximity to the technological environmental hazards on the relationship between cultures and risk related perceptions. However, it remains unclear how cultural worldviews and environmental conditions interact with each other in explaining different types of environmental risks. In particular, existing GGCT research in the Chinese context focuses either on a specific environmental problem such as climate change (Xue et al. Citation2016) or the general environmental concern (Yuan et al. Citation2022). Moreover, research on China using GGCT has mainly used limited and nonrepresentative survey data (e.g. Xue et al. Citation2016). We seek to fill these gaps and answer two main research questions: (1) To what extent does cultural worldview rather than environmental condition explain environmental perceptions among Chinese citizens? and (2) Does environmental condition moderate the effect of cultural worldview on environmental perceptions?
Our research makes three contributions to the literature on environmental risk perceptions. First, it is among the few studies that use large scale nationwide representative survey data—the Chinese General Social Survey (CGSS)—to study Chinese environmental perceptions. Second, as one of the first efforts to combine CTS and CCT constructs available in CGSS to operationalize GGCT’s grid and group dimensions, this paper also suggests how to improve measurement of GGCT for survey research in China. Third, this research seeks to build a more comprehensive model to explain environmental perceptions by incorporating environmental conditions and cultural variables and, to our knowledge, is the first to test the interactive effect of culture and environmental conditions on eight specific environmental problems.
2. Environmental condition and environmental perceptions
Some existing research has suggested that public concern for environmental problems can be influenced by the actual environmental condition that individuals live in and are exposed to. For example, some found evidence for the influence of individuals’ self-reported exposure to environmental problems on environmental perceptions (Spence et al. Citation2011; Zaval et al. Citation2014). Others used objective measures at the place level and confirmed the effect of actual severity of environmental problems, such as weather variations (Egan and MUllin Citation2012), local concentration of industry (Coan and Holman Citation2008), pollution (Gill, Picou, and Ritchie Citation2012; Johnson, Brace, and Arceneaux Citation2005), and proximity to risks and facilities (Brody et al. Citation2008; Bishop Citation2013), on public environmental perceptions. However, others found that place-level environmental problems do not influence environmental perceptions (Mutz Citation1993; Whitmarsh Citation2008). Surprisingly, Smith (Citation2002) found that residential proximity to nuclear energy facilities increased support for nuclear energy. Similarly, unrealistic optimism was found among individuals living in risky areas (Suls et al. Citation2013).
Research on the relationship between environmental condition and environmental perceptions in China is much less developed than the literature just described, yet it provided evidence that severe environmental problems, such as soot and sulfur dioxide emissions, trigger increased public concerns (Zheng et al. Citation2014; Liu and Mu Citation2016). Moreover, Harris’s (Citation2008) review article suggested that the Chinese showed substantial indifference to the broader ecological condition, but expressed explicit concerns over environmental pollution affecting their daily lives. Therefore, in this research, environmental conditions were examined in terms of eight specific environmental problems that were frequently studied environmental problems in existing research (Harris Citation2008; Liu and Mu Citation2016). They are also environmental problems with the most complete data available on actual severity of environmental problems. We expect that:
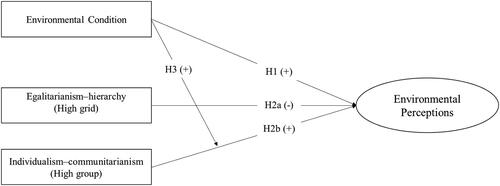
H1: Actual severity of environmental problems will be positively correlated with citizens’ perceived severity of them.
3. Cultural worldview and environmental perceptions
Some research on environmental perceptions concluded that self-interest, the view of getting rich and meeting their individual aspirations while overlooking public interests such as environmental protection, explained the low level of environmental concern (Bishop Citation2013; Harris Citation2008), although other research found otherwise (Mutz Citation1993; Whitmarsh Citation2008). As a result, some scholars contended that the public enthusiasm for environmental protection increases when the general public realizes the significant impacts of environmental problems on their wealth and health (Harris Citation2008). However, the assumption that people are motivated by self-interest or individual utility maximization only captures a single model of the person described in Douglas and Ney (Citation1998) research——individualists (‘we are all self-seeking’), but unable to capture individuals with a more collectivistic cultural worldviews, such as hierarchists (‘Give me the boy and I will give you the man’) or egalitarians (‘we are all caring and sharing’), respectively (Swedlow Citation2011). GGCT pluralizes rationality in shaping risk perception among culturally diverse people.
GGCT defines culture as the pattern of social relations that vary along two dimensions: group and grid. Group measures the extent to which individuals distinguish themselves as an ‘Us’ versus as a ‘Them’. Grid measures the extent to which individuals are constrained by external rules. These social relations in which individuals are embedded can yield associated cultural worldviews and thus influence individuals’ perceptions (Johnson and Swedlow Citation2021).
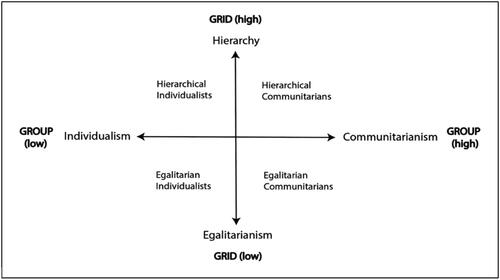
To measure the grid and group dimensions, scholars reconceptualized GGCT as CCT (Kahan Citation2012; Kahan et al. Citation2012; Kahan, Jenkin-Smith, and Braman Citation2011; Kahan Citation2015; Kahan et al. Citation2017). CCT uses two continuous cultural worldview scales: ‘egalitarianism–hierarchy’ and ‘individualism–communitarianism’. Egalitarianism–hierarchy measures the grid dimension, while individualism–communitarianism measures the group dimension. Interacting two cultural scales generates four cultural groups: hierarchical individualism (high grid and low group), hierarchical communitarianism (high grid and group), egalitarian individualism (low grid and high group), and egalitarian communitarianism (low grid and group) (Kahan Citation2012; Kahan et al. Citation2012, Citation2017; Johnson Citation2017; Mayorga and Johnson Citation2019).
As shows, high egalitarianism-hierarchy (high grid) produces a hierarchic culture where the ascribed roles predominate: ‘roles are distributed on the basis of explicit public classifications, such as sex, [skin] color, position in hierarchy, holding a bureaucratic office, descent in a senior clan or lineage, or point of progression through an age-grade system’ (Gross and Rayner Citation1985). Hierarchists have faith in authorities and experts (Jenkins-Smith and Smith Citation1994; Johnson Citation2017; Johnson and Mayorga Citation2021) and are expected to ‘dismiss claims of environmental risks because those claims implicitly cast blame on societal elites’ (Kahan Citation2012, 741). By contrast, low egalitarianism-hierarchy scale (low grid) generates an egalitarian culture in which individuals deny that rights and duties should be distributed on the basis of social status or ascribed roles (Kahan, Jenkin-Smith, and Braman Citation2011; Kahan et al. Citation2017). They value equality between human and nature, view nature as ephemeral and fragile, and perceive environmental problems as an anthropogenic risk (Verweij, Luan, and Nowacki Citation2011; Jones Citation2014; Johnson, Swedlow, and Mayorga Citation2020; Johnson and Swedlow Citation2020). Therefore, egalitarians are disposed to be more concerned with the environmental risks. High individualism–communitarianism (high group) creates a communitarian culture where people interact frequently with their group members and rely on one another to perform work and achieve their ends (Rayner Citation1992; Kahan Citation2012; Kahan et al. Citation2017). Communitarians deny the competitive way of life and see commerce and industry as symbols of noxious self-seeking (Wildavsky and Dake Citation1990; Kahan et al. Citation2017). Therefore, they are disposed to credit claims that commercial and industrial activities are harmful to the environment and that those activities should be restricted or regulated. By contrast, low individualism–communitarianism (low group) culture inclines people toward an individualist culture where society is organized in a way of life without collective assistance or interference. Individualists value freedom and competition. They believe that environmental concerns invite restrictions on commerce and industry, and threaten their core value of freedom, and thus, they are more likely to be dismissive of environmental risks (Kahan et al. Citation2012, Citation2017; Swedlow Citation2017).
Figure 1. Grid and group in CCT (See Kahan Citation2012).
In recent years, scholars have started to use GGCT in survey research in Asian countries, providing evidence that the theory explains environmental perceptions in these countries (Yang Citation2015; Xue et al. Citation2016; Liu Citation2018; Kim and Kim Citation2019; Kim and Jung Citation2019; Yuan et al. Citation2022). Most research has confirmed the positive influence of egalitarian culture on environmental concerns (Liu Citation2018; Xue et al. Citation2014, Citation2016), but the predicted negative influences of the individualistic and hierarchical cultures on environmental concerns found in the United States (Kahan et al. Citation2012, Citation2017; Johnson, Swedlow, and Mayorga Citation2020; Johnson and Swedlow Citation2020) do not always hold up in Asian countries (Kim and Kim Citation2019; Liu Citation2018; Xue et al. Citation2016). Moreover, the applications of GGCT in risk analysis in Asian countries (Liu Citation2018; Xue et al. Citation2016; Xue et al. Citation2014;Yuan et al. Citation2022) rarely address the grid and group dimensions directly. The only exception is recent research by Kim and Jung (Citation2019) in which they find that high grid decreases research and development (R&D) professionals’ organizational commitment, while high group increases their organizational commitment. Cultural scholars suggested that the group–grid framework can provide a universal basis for constructing worldviews across countries (Cornia, Dressel, and Pfeil Citation2016; Maleki and Hendriks Citation2015). As part of a larger effort using grid-group dimensions to measure cultural worldviews, this research uses ‘egalitarianism–hierarchy’ and ‘individualism–communitarianism’ scales to measure separately the grid and group dimensions. Based on the arguments above, we expect that:
H2a: Higher egalitarianism–hierarchy scale (grid) will be negatively correlated with the perceived severity of environmental problems.
H2b: Higher individualism–communitarianism scale (group) will be positively correlated with the perceived severity of environmental problems.
4. Interactive effect between cultural worldview and environmental condition
A value-based approach including CCT is not necessarily at odds with environmental condition as an explanation for environmental concerns. Scholars have proposed approaches that integrate two or more explanatory factors, such as cognitive, experiential, and sociocultural factors, to jointly explain environmental perceptions (Kahan Citation2012). Self-interest might be reflected in group membership, while individuals’ propensity to evaluate environmental issues through cognitive assessments can be intertwined with their cultures (Kahan Citation2012; Kahan et al. Citation2017; Kim and Kim Citation2019). Cultural scholars suggested the presence of biased assimilation, meaning that individuals are unconsciously motivated to selectively accept and credit the factual evidence of risk that reinforces their core beliefs and cultures while dismissing evidence that contradicts or challenges their cultures (Kahan Citation2012, Citation2017; Lord and Taylor Citation2009; Zaller Citation1992; Johnson and Swedlow Citation2021). The assumption of culturally motivated reasoning was also supported by existing research showing that people are prone to trust the informational sources or organizations that are congruent with their cultural worldviews and values (Liu and Morris Citation2022; Tumlison, Moyer, and Song Citation2017; Yuan Citation2022; Mayorga and Johnson Citation2019). As a result, environmental perceptions are further polarized along lines that reflect their cultural predispositions toward environmental risks, rather than generating truth-convergent consensus (Kahan Citation2012). However, since polarized, opposing environmental beliefs often occur when individuals are exposed to balanced information (e.g. benefits and costs of environmental risk) (Kahan, Jenkin-Smith, and Braman Citation2011), it is not clear whether this polarized effect exists when, in our case, individuals within the same province are exposed to the same factual condition of environmental problems. Therefore, while communitarians (high group) may feel more concerned about the environment when they are exposed to severe environmental problems that are congenial to their predisposition, hierarchists (high grid) may just ignore risk-related evidence and thus (at least) maintain their environmental suspicions. Therefore, we expect that:
H3: The correlation between the individualism–communitarianism scale and perceived severity of environmental problems, but not the correlation between the egalitarianism-hierarchy scale and perceived severity of environmental problems, will be stronger with elevated level of actual severity of environmental problems.
Figure 2. Hypothesized relationships of environmental condition and cultural worldview with environmental perceptions.
5. Methods
5.1. Data
Our survey data came from the 2013 nation-wide CGSS, the most recent CGSS data that can provide available measures about cultural worldviews and environmental perception of eight environmental problems we study. The sample size in this study is 5,003 individuals from 28 provinces. CGSS was also used to identify control variables of demographic factors including gender, age, educational level, and household income. Chi-squared goodness of fit was used to test whether sample data fit the distribution of overall population in China (Appendix A). The distribution of gender is very similar to the overall population in China. However, 18 to 39-year-olds are underrepresented, whereas those 40 and over are overrepresented. Moreover, those who never attended school and those who have an education beyond high school were overrepresented, whereas those who have an education of elementary or middle school were underrepresented.
In CGSS, urban residents are oversampled to generate enough cases for examination of variations within cities, and respondents in a small household have a higher probability of being selected in the sample (Bian and Li Citation2012). Therefore, CGSS has provided the sampling weights that allow researchers to correct for this oversampling to make the analysis representative of the general population in China. In other words, post-stratification weights, whereby we weight the survey results so that responses that are over-represented in the sample (e.g. urban residents) have a lesser strength, while under-represented responses (e.g. rural residents) have an increased strength, have been applied to our estimations.
Our data on the severity of environmental problems came from the Chinese Environmental Statistic Yearbook from 2009-2013, in which the data from 2008-2012 were reported. We collected regional data from 28 provinces (including autonomous regions and municipalities with administrative status equal to that of provinces) for five years from 2008-2012. These data include particulate matter 10 micrometers or less in diameter (PM10), discharged industrial wastewater, household wastewater, industrial wastes, household waste disposal rate, green coverage rate, water resources per capita, sulfur dioxide emissions (SO2), nitrogen dioxide (NO2), and fertilizer usage.
5.2. Measurements
5.2.1. Environmental perceptions
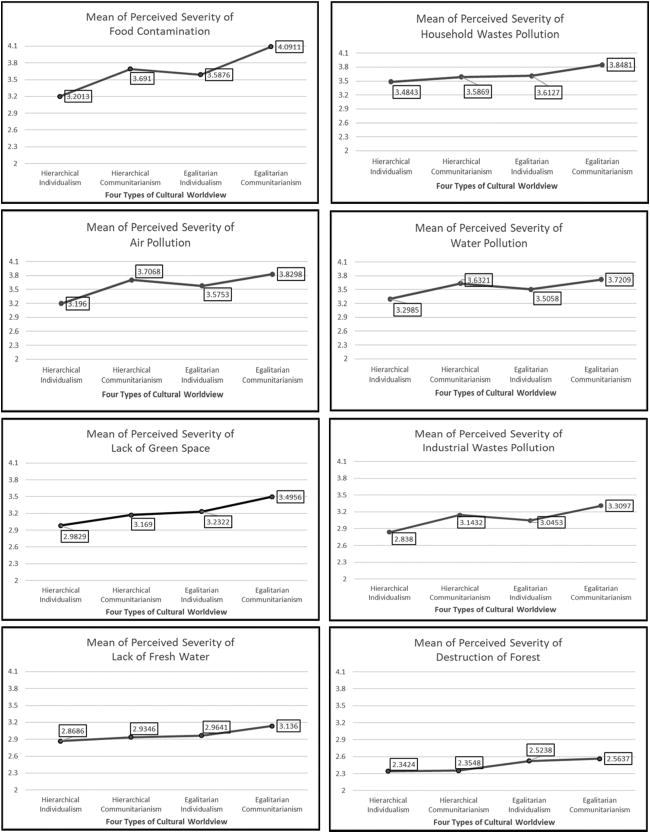
Dependent variables include perceived severity of eight types of local environmental problems: air pollution, water pollution, industrial waste pollution, household waste pollution, lack of green space, destruction of forests, lack of freshwater, and food contamination. Respondents were asked to rate separately the severity of each environmental problem where they live, using a six-point scale (1 = no problem at all, 2 = not so severe, 3 = not severe, 4 = just ordinary, 5 = moderately severe, or 6 = very severe).
5.2.2. Cultural worldviews
We combined CTS and CCT items to measure two scales of egalitarianism-hierarchy (grid) and individualist-communitarian (group) in GGCT but our constructs of cultural worldview were limited by the available items in CGSS. Building on previous research (Boyle and Coughlin Citation1994; Chai, Liu, and Kim Citation2009; Kahan Citation2012; Kahan et al. Citation2012, Citation2017), we used CGSS attitudinal items that best approximate the characteristics of grid and group dimensions to operationalize cultural worldviews. Various sources and methods were used to improve our measures’ construct validityFootnote1.
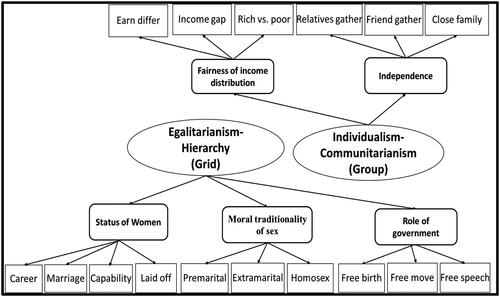
First, adapted from previous research (Boyle and CoughlinCitation1994; Swedlow et al. Citation2020; Kahan Citation2012; Swedlow and Wyckoff Citation2009; Johnson and Swedlow Citation2020; Chai, Liu, and Kim Citation2009), ten CGSS items were used to measure three concepts on the grid dimension: traditional sexual morality, the status of women, and the role of government. Six items were used to measure two concepts on the group dimension: fairness of income distribution and independence (Appendix B).
Second, we specified a higher-order Confirmatory Factor Analysis (CFA), defined as two second-level factors (grid and group), five first-level factors (five concepts), and 16 observable variables, to test the construct validity of the model (). We used four indices to assess model fit: Comparative Fit Index (CFI), Tucker-Lewis Index (TLI), Root Mean Square Error of Approximation (RMSEA) and Standardized Root Mean Square Residual (SRMR). CFI was just below the threshold of 0.95 for adequate fit (CFI = 0.93), but TLI was above 0.90 (TLI = 0.91), indicating acceptable model fit, and both RMSEA and SRMR were less than 0.05 (RMSEA = 0.04, SRMR = 0.03), indicating good fit (Hooper, Coughlan, and Mullen Citation2008). CFA showed that all the observable variables on each concept have standardized factor loadings above 0.30 and are unidimensional (Appendix C). The Cronbach’s alpha (α) (Cronbach Citation1951) for moral traditionality of sex (α = 0.64) and status of women (α = 0.69) was less than 0.7. The values of α for independence (α = 0.57), fairness of income distribution (α = 0.40), role of government (α = 0.51) on grid dimension, all items on group dimension (α = 0.48), and all items on grid dimension (α = 0.55) were less than 0.6. According to Loewenthal and Lewis (Citation2015), a value less than 0.7 is less ideal and less than 0.6 should definitely raise some cautions. However, pairwise bivariate correlations for all concepts were significant and the mean inter-item correlations were all in the range of 0.15 − 0.50, indicating optimal inter-item correlation as a marker of internal consistency (Clark and Watson Citation1995).
Figure 3. Measuring cultural worldview.
Therefore, the sums of scores of the grid and group dimensions were, separately, egalitarianism-hierarchy scale and individualist-communitarian scale. Moreover, as the grid (from 14 to 49) and group (from 7 to 22) dimensions have different ranges, the sums of scores of the grid and group dimensions were standardizedFootnote2 to make the two dimensions comparable. Continuous predictors were also recommended to be standardized before the computation of the interaction term and regression analysis to make the interpretation of the interaction easier (Dawson Citation2014). Although the measures are continuous and treated as such in multivariate analysis, individuals can be referred to by their cultural types, e.g. based on their scores in relation to the means of the two cross-cutting scales, for expositional purposes (Kahan et al. Citation2017; Yuan and Swedlow Citation2022; Zeng, Yuan, and Huang Citation2022). In this study, we assessed differences across individuals classified by their cultural types before conducting multivariate analysis using the two continuous measures of grid and group dimensions.
The standardized score shows the respondents’ positions relative to the mean, which is always zero. Like other cultural research (Kahan, Jenkin-Smith, and Braman Citation2011; Kahan et al. Citation2017; Olli Citation2012), we assume that the mean represents the typical or average attitude of the group (McIver and Carmines, Citation1981), then each of the individual cultural scales can be expressed as a deviation from this origin (Olli Citation2012). An individual scoring higher than zero on both grid and group was hierarchical communitarianism, higher than zero on grid but lower than zero on group was hierarchical individualism, lower than zero on both grid and group was egalitarian individualism, and lower than zero on grid but higher than zero on group was egalitarian communitarianism.
5.2.3. Environmental condition
Another independent variable is the actual severity of environmental problems. We used the five-year (from 2008 to 2012) average value of different proxies to measure the severity of each of the eight types of environmental problems at the provincial level. PM10 was used to measure the level of air pollution. Discharged wastewater, which is the sum of industrial and household wastewater discharged, measured water pollution. Discharged industrial wastes and the Household waste disposal rate separately measured pollution from these sources. The lack of green space was measured by the Green coverage rate. The destruction of forests was measured by the Forest coverage rate. The lack of freshwater was measured by Water resource per capita. To measure the severity of food contamination that can result from air and water pollution and fertilizer usage, Principal Component Analysis with Oblimin rotation was used for four variables—five-year (from 2008 to 2012) average value of SO2, NO2, wastewater, and fertilizer usage. A factor with an eigen value above 1 (Kaiser Citation1960), which explains 57% of the variance of food contamination, was extracted. We labeled it as Food contamination index. The factor loading for SO2, NO2, wastewater, and fertilizer usage were 0.723, 0.795, 0.590, and 0.877 respectively.
5.2.4. Demographics
Demographic controls include education (from 1: never attended school to 13: master’s degree and above), gender (1: male; 2: female), age (interval measurement), and household income (interval measurement).
5.3. Data analysis procedures
Our analyses were conducted in two steps. The first consisted of one-way ANOVA tests of the mean of perceived severity of eight environmental problems across four cultural types derived from egalitarianism-hierarchy scale (grid) and individualism–communitarianism scale (group). We generated four types of cultural types based on individual’s scores on the grid and group subscales (Kahan et al. Citation2007; Kahan Citation2012), which helped us observe the differences among particular combinations of low and high values on the grid and group dimensions. Tukey’s method (Tukey Citation1949) was used for post-hoc multiple pairwise comparisons.
In the second step, these continuous measurements of egalitarianism-hierarchy (grid) scale and individualist-communitarian (group) scale were used in bivariate and multivariate analyses for further testing of our hypotheses. Our data include individual respondents nested in provinces. Therefore, intraclass correlation coefficient (ICC) was computed to determine the degree to which individuals were similar to each other within provinces and distinct from individuals in other provinces. The ICC values were 0.23, 0.13, 0.14, 0.06, 0.13, 0.10, 0.19, 0.15 for null models of air pollution, water pollution, industrial waste pollution, household waste pollution, lack of green space, destruction of forests, lack of freshwater, and food contamination, respectively. Multi-level modelling should be used when the data are nested or grouped because ignoring clustering would inflate Type I error rates dramatically as the relationship among the individuals in a group increases and as the number of subjects per group increases (Walsh Citation1947; Barcikowski Citation1981). For example, Barcikowski (Citation1981) found that when the sample size is 100 in each group, a test result which would be significant for an independent sample would have an actual significance level of 0.05 for a nested sample even if the ICC was only 0.00 and would have an actual significance level of 0.17 for a nested sample even if the ICC was only 0.01. Therefore, we used HLM 8.1 software to conduct multi-level linear regressions. For each of the eight types of environmental problems, we ran two multi-level models: one was an intercept as outcomes model that allowed the mean of perceived severity of environmental problem to vary across provinces; the second was an intercept and slope-as-outcomes model, designed for testing interactive effect between cultural worldview and environmental condition, which allows the effect of cultural worldview scales to vary with the actual severity. The mathematical formulas were listed in Appendix D.
6. Results
6.1. Descriptive statistics and results of ANOVA test
presented the descriptive statistics for continuous variables. On average, on the six-point scale, respondents perceived food contamination as most severe (Mean= 3.68), followed by household waste pollution (3.64), air pollution (3.58), water pollution (3.54), lack of green space (3.24), industrial waste pollution (3.09), lack of freshwater (2.98), and destruction of forests (2.79). The mean value of egalitarianism-hierarchy scale was 34.20 on a range of 14 to 49 and the mean of individualism-communitarianism scale was 14.70 on a range of 7 to 22. On average, our sampled respondents were more rule- or hierarchy-oriented, which is consistent with previous research on China’s culture (Chai, Liu, and Kim Citation2009) and centralized political system.
Table 1. Descriptive statistics.
ANOVA tests for each of eight types of environmental problems indicated that the means of perceived severity of environmental problems were different at 0.05 significance level. As individuals became simultaneously more egalitarian (low grid) and more communitarian (high group), they perceived seven of eight environmental problems to be more severe than do hierarchical individualists (high grid and low group) (see Appendix E). As showed, compared to hierarchical individualists, hierarchical communitarians perceived four of eight environmental problems to be more severe, egalitarian individualists perceived three of them to be more severe, and egalitarian communitarians perceived most of environmental problems (excluding destruction of forest) to be more severe. By contrast, compared to egalitarian communitarians, hierarchical communitarians perceived three of them to be less severe, and egalitarian individualists perceived five of them to be less severe.
Table 2. Pairwise comparisons using Tukey’s test.
6.2. Multilevel analyses
Bivariate analyses (see Appendix F) showed no significant correlations between environmental condition and environmental perceptions across all environmental problems. However, our hypotheses 2a and 2b regarding the negative effect of egalitarianism-hierarchy scale and positive effect of individualism-communitarianism on public environmental perceptions were confirmed in bivariate analysis. Therefore, we were confident to move to multivariate analyses to see whether the effect of cultural worldviews can withstand additional scrutiny.
We then ran a full model without interactive effects and also found environmental condition to have little effect on environmental perceptions. In Footnote4, the interactive effects between cultural worldview and environmental condition were added. Our hypothesis 2a regarding the negative effect of egalitarianism-hierarchy scale was supported for environmental problems of food contamination, air pollution, lack of green space, industrial wastes pollution, lack of freshwater, and destruction of forest. Our hypothesis 2b regarding the positive effect of individualism-communitarianism scale was supported across for environmental problems of food contamination, air pollution, water pollution, lack of green space, and industrial wastes pollution. More specifically, a one-unit standard deviation increase in egalitarianism-hierarchy scale decreased the perceived severity of food contamination by 0.21, air pollution by 0.08, lack of green space by 0.14, industrial wastes pollution by 0.07, lack of freshwater by 0.12, and destruction of forest by 0.16, on average, all else being equal. A one-unit standard deviation increase in individualism-communitarianism scale increased the perceived severity of food contamination by 0.19, air and water pollution by 0.12, lack of green space by 0.08, and industrial wastes pollution by 0.12, on average, all else being equal. This might not seem to be a substantial increase or decrease in environmental perception, but when one considers the full range of the perceived severity of environmental problems, only six points in this study, we can think of the 1-point increase in cultural worldview scales as one to four percent increases or decreases in perceived severity of environmental problems.
Table 3. Regression of perceived severity of environmental problems on cultural worldview, environmental condition, and demographics.
Moreover, showed that hypotheses 3 was only partially supported. As expected, the negative influence of egalitarianism-hierarchy scale on six of eight environmental problems (food contamination, household wastes pollution, air pollution, lack of green space, industrial wastes pollution, and destruction of forest) did not change with environmental condition; the positive influence of individualism-communitarianism scale on one of eight environmental problems (food contamination) was positively associated with food contamination index and PM10. However, the increase in discharged wastewater magnified the negative influence of egalitarianism-hierarchy scale on perceived severity of water pollution. Contrary to our expectations, the increase in water resource per capita magnified the negative influence of egalitarianism-hierarchy scale on perceived severity of lack of freshwater, meaning that the increase in freshwater shortage weakened the negative effect of egalitarianism-hierarchy scale. Also contrary to our expectations, the positive influence of individualism-communitarianism scale on seven of eight environmental problems (household wastes pollution, water pollution, lack of green space, industrial wastes pollution, lack of freshwater, and destruction of forest) was not affected by actual severity of environmental problems. We have also conducted an additional analysis by adding a 3-way interaction where both individualism–communitarianism (group) scale and reversed egalitarianism-hierarchy (grid) scaleFootnote5 were interacted with environmental condition simultaneously. We did not find significant effects of three-way interactions on environmental perceptions (see Appendix H). Therefore, grid and group may play separate roles in interacting with environmental conditions in influencing environmental perceptions.
Among demographic factors, younger generations perceived the lack of forest more severe than do older generations. Females were more likely to perceive water pollution and food contamination as severe than males. The effect of educational levels was robust across different models except for lack of freshwater, with a higher educational level associated with higher level of perceived severity for all the environmental problems. Finally, the residual variances in prediction of perceived severity of environmental problems (or Variance of uoj) across all models and environmental problems were significant, meaning that the provinces varied significantly in the mean perception of the environment problems.
7. Discussion
Consistent with prior research (Smith Citation2002; Whitmarsh Citation2008; Mutz Citation1993), our statistical models indicated that, in China, the public’s perceived severity may not be determined by actual severity of environmental problems. However, other place-related factors, such as provincial economic condition and environmental policy, might influence environmental perceptions because of the large variances across provinces in environmental perceptions regarding all environmental problems. For example, previous research has suggested distinctive effects of cultural worldviews on individuals’ risk related perceptions, depending on the proximity of their communities to the environmental hazards (Baxter Citation2009).
The study furnished two forms of evidence to support that cultural worldviews might explain the environmental perceptions of all eight environmental problems much better than environmental condition. The first was the polarization in perceived severity of all eight environmental problems between hierarchical individualists and egalitarian communitarians: moving simultaneously from high grid to low grid and from low group to high group, individuals became more concerned about the environmental problems to fit their cultural worldviews. Moreover, the size of the effects was not uniform across the types of environmental problems. The largest disparity between hierarchical individualists and egalitarian communitarians occurred in connection with food contamination, followed by air pollution, lack of green space, industrial wastes pollution, and others, with the differences in perceived severity of lack of forest being the smallest.
In the multivariate analysis, our use of cultural scales measuring these two dimensions resonates other CT scholars’ calls that GGCT should not only be applied based on the cultural types as grid and group dimensions are the foundations for the theory (e.g. Nakamura, 2016). Moreover, while ANOVA test allows us to compare the differences between cultural types, the common way that CT scholars categorize the cultural types cannot avoid cases where scores are not equal but differ only a little. Therefore, this research has adopted continuous measurements of grid and group dimensions in multivariate analysis that allows for more discrete scores on each dimension.
The second finding was that we identified a mechanism specifying how differences in four types of cultural worldviews were formulated from two GGCT dimensions: grid measured by egalitarianism-hierarchy scale and group measured by individualism-communitarianism scale. First, while our research supported the correlations between cultural worldviews and environmental perceptions (Kahan et al. Citation2007; Kahan, Jenkin-Smith, and Braman Citation2011; Xue et al. Citation2014; Kahan et al. Citation2012), we answered how individuals’ different positions on grid and group dimensions, respectively, motivated the individuals to form environmental perceptions that are congruent with their cultures. More specifically, our findings suggested that individuals who are more hierarchical are more likely to perceive the environmental problems less severe than egalitarians do because of their higher scores on grid. For example, hierarchists who hold a belief in social status (Kahan, Jenkin-Smith, and Braman Citation2011; Kahan et al. Citation2017) often have faith in the authorities and experts (Jenkins-Smith and Smith Citation1994; Johnson Citation2017; Johnson and Mayorga Citation2021) and thus are reluctant to acknowledge environmental risks that may implicitly cast blame on political and social elites (Kahan Citation2012). Meanwhile, individuals who are more communitarian are more likely to perceive the environmental problems more severe than individualists do because of their higher scores on group. For example, communitarians who value the interactions between group members (Rayner Citation1992; Kahan Citation2012; Kahan et al. Citation2017) often deny the competitive way of life and believe that unregulated markets are a source of inequality in their groups, and thus are disposed to credit claims that commercial and industrial activities are harming the environment (Wildavsky and Dake Citation1990; Kahan et al. Citation2009; Kahan et al. Citation2017). Second, while mixed findings in previous research has implied that the effects of cultural worldviews may vary with types of risks (Johnson, Swedlow, and Mayorga Citation2020; Johnson and Swedlow Citation2020), including human-caused environmental risks, natural disasters (Yang Citation2015; Xue et al. Citation2016; Morss et al. Citation2020), public health risks (Johnson Citation2017; Mayorga and Johnson Citation2019; Johnson and Mayorga Citation2021; Siegrist and Bearth Citation2021), and social risks (Reardon and Govender Citation2013; Johnson and Swedlow Citation2020), etc., this research took a deeper step to observe eight specific environmental problems. This research provided a more comprehensive and nuanced evidence that relatively hierarchal (vs. egalitarian) worldviews would diminish perceived severity of environmental problems of food contamination, air pollution, lack of green space, industrial wastes pollution, lack of freshwater, and destruction of forest, whereas relatively communitarian (vs. Individualistic) worldviews would increase perceived severity of environmental problems of food contamination, air pollution, water pollution, lack of green space, and industrial wastes pollution.
Intriguingly, our interactive effect model implied that environmental conditions barely affect the relationship between cultural worldview and environmental perceptions, but only influenced this relationship in air pollution, water pollution, and food contamination. Previous research has provided evidence that, the culturally biased assimilation effect is less likely triggered in the no-information condition (Kahan Citation2012; Kahan et al. Citation2017). By contrast, opposing environmental beliefs are further increased as balanced information about a specific risk is accumulated (Kahan Citation2012; Smith Citation2002). Previous research also found stronger and more consistent associations between cultural worldviews and risk perceptions among people who are more knowledgeable (Kahan et al. Citation2012; Moyer and Song Citation2019; Johnson, Swedlow, and Mayorga Citation2020; Johnson and Swedlow Citation2020). In December 2012, the National Twelfth Five-Year Plan for Environmental Protection in China announced that air and water pollutions were among the main issues to be addressed. Therefore, the public in China may have been exposed to more information about these politically salient issues and thus their views in these issues may become polarized as a result of biased assimilation. For example, when hierarchists are exposed to factual evidence threatening their cultural values, such as faith in authorities, individuals tend to react dismissively and even react against that factual evidence (Kahan Citation2012), as evidenced by the reinforced skepticism of environmental problem by increasing wastewater. However, for certain environmental problems that are not salient enough to be a source of challenge to the authorities (Xue et al. Citation2016), like lack of freshwater, individuals are more likely to openly accept the factual evidence and thus change their predisposed perceptions.
These significant interactive effects of cultural worldview and environmental condition for some environmental problems (vs. others) may also reflect the varying levels of the public’s familiarity with these issues. For example, while communitarians may perceive environmental problems more severe than do other cultural groups, they may be more concerned about more familiar and visible environmental issues, such as food contamination (De Vocht et al., Citation2015), than other environmental problems, such as lack of forest.
Our research has three limitations that should be addressed in future research. First, this research adopted provincial level variables to measure environmental conditions. However, the factual evidence of actual severity was observed at lower levels of governance, such as cities, in which the respondents resided. Second, this research did not include other potential factors such as knowledge and political awareness, which could influence individuals’ ability to link the environmental conditions with their environmental perceptions. Incorporating these supplemental measures into future research examining culturally biased assimilation effect could be very important. Third, limited by available items in CGSS, we adopted a hybrid measurement of CCT and CTS, and future research should ask whether either set of items or combined items can fit better with China’s condition. Comparing and combing CCT and CTS survey items for improving their face and construct validity, convergent and divergent validity, and variance explained are also important for research on Western countries as previous research has just started to test the content validity (Swedlow et al. Citation2020; Johnson and Swedlow Citation2020), reliability (Kahan Citation2012; Xue et al. Citation2014), or factoring (Olli Citation2012; Johnson, Swedlow, and Mayorga Citation2020; Xue et al. Citation2016) the neither of them reject CTS nor CCT. Moreover, the values of Cronbach’s alpha for cultural worldview measurement were lower than 0.70, which can potentially cause type 2 error, when accepting a null hypothesis that is actually false (Swedlow and Wyckoff Citation2009). However, the significant and predicted effects of cultural worldviews on environmental perceptions were supported across models in this research. Thus, the predictive validity of these measures is promising and the significant effect of cultural worldview was, if anything, understated because of the low reliability.
8. Conclusions
This research suggests a stronger influence of cultural worldviews than actual severity of environmental problems on environmental perceptions. Built on previous research using either CTS or CCT measurements (Johnson, Swedlow, and Mayorga Citation2020; Swedlow et al. Citation2020; Kahan et al. Citation2017; Kahan Citation2012; Xue et al. Citation2014; Boyle and Coughlin Citation1994), this article used CGSS to develop a set of attitudinal items based on the grid-group dimensions or scales that highlight important differences that are not fully captured by previous measurement of four types of cultural worldviews. In this study, we found that both nominal measurements of four types of cultural worldviews and interval measurements of grid and group dimensions can explain public environmental perceptions. Moreover, the actual severity of environmental problems barely changes the effect of cultural worldviews within most of environmental problems. However, people who are predisposed to concern about environmental problems may become more concerned by increasing severity of environmental problems that are more politically salient to the public in China. However, our additional analysis suggested that grid and group may play separate roles in interacting with environmental conditions in influencing environmental perceptions.
This study has implications for environmental management. First, those desiring to communicate environmental problems should realize that cultural factors, along with environmental conditions, significantly shape the public’s environmental perceptions across different types of environmental problems. Second, government should understand that the actual severity of environmental problems is not uniformly perceived by the public, depending on the salience of environmental issues and individuals’ familiarity with these issues. Finally, by crafting messages that are culturally congenial to target audiences, environmental communicators can help enable diverse cultural groups to connect environmental condition with the information they are imparting (Jones Citation2014; Jones and McBeth Citation2010; Kahan, Jenkin-Smith, and Braman Citation2011). This strategy is particularly relevant for environmental problems that evoke intense political conflicts among different cultures (Kahan et al. Citation2017).
Disclosure statement
No potential conflict of interest was reported by the authors.
Additional information
Funding
Notes
1 We mainly relied on Boyle and Coughlin (Citation1994) and Chai, Liu, and Kim (Citation2009) to select CGSS survey items to measure the grid and group dimensions. Swedlow et al. (Citation2020) evaluated the face validity of survey items measuring GGCT concepts, so we used their criteria to assess the face validity of the CGSS items.
2 Every response was represented through its deviation from the mean divided by the standard deviation of the sample.
3 Four variables for the food contamination index were presented separately.
4 Full results using unweighted sample was reported in Appendix G. In Appendix G, the negative correlation between egalitarianism-hierarchy (grid) scale and perceived severity of water pollution became significant, the correlation between egalitarianism-hierarchy scale and perceived severity of industrial wastes pollution and the correlation of the interactive term between egalitarianism-hierarchy scale and environmental condition of water pollution with perceived severity of water pollution became insignificant. Results in Appendix G did not find other substantive differences.
5 As we found that decreases in grid and increases in group can increase the perceived severity of environmental problems, we used reversed “egalitarianism-hierarchy (grid) scale” when interacting egalitarianism-hierarchy (grid) scale with individualism–communitarianism (group) scale to make the interpretation easier.
References
- Barcikowski, R. S. 1981. “Statistical Power with Group Mean as the Unit of Analysis.” Journal of Educational Statistics 6 (3): 267–285. doi:10.3102/10769986006003267.
- Baxter, J. 2009. “A Quantitative Assessment of the Insider/Outsider Dimension of the Cultural Theory of Risk and Place.” Journal of Risk Research 12 (6): 771–791. doi:10.1080/13669870802579806.
- Bian, Y., and, L. Li. 2012. “The Chinese General Social Survey (2003-8).” Chinese Sociological Review 45 (1): 70–97. doi:10.2753/CSA2162-0555450104.
- Bishop, B. H. 2013. “Drought and Environmental Opinion: A Study of Attitudes toward Water Policy.” Public Opinion Quarterly 77 (3): 798–810. doi:10.1093/poq/nft034.
- Boyle, R. P., and R. M. Coughlin. 1994. “Conceptualizing and Operationalizing Culture Theory Variables.” In Politics, Policy and Culture, edited by D. J. Coyle and R. J. Ellis, 191–218.New York: Westview Press.
- Brody, S. D., S. Zahran, A. Vedlitz, and H. Grover. 2008. “Examining the Relationship between Physical Vulnerability and Public Perceptions of Global Climate Change in the United States.” Environment and Behavior 40 (1): 72–95. doi:10.1177/0013916506298800.
- Chai, S.-K., M. Liu, and M.-S. Kim. 2009. “Cultural Comparisons of Beliefs and Values: Applying the Grid-Group Approach to the World Values Survey.” Beliefs and Values 1 (2): 193–208. doi:10.1891/1942-0617.1.2.193.
- Chauvin, B., and I. Chassang. 2022. “Cultural Orientation and Risk Perception: Development of a Scale Operating in a French Context.” Risk Analysis 42 (10): 2189–2213. doi:10.1111/risa.13859.
- Clark, L. A., and D. Watson. 1995. “Constructing Validity: Basic Issues in Objective Scale Development.” Psychological Assessment 7 (3): 309–319. doi:10.1037/1040-3590.7.3.309.
- Coan, T. G., and M. R. Holman. 2008. “Voting Green.” Social Science Quarterly 89 (5): 1121–1135. doi:10.1111/j.1540-6237.2008.00564.x.
- Cornia, A., K. Dressel, and P. Pfeil. 2016. “Risk Culture and Dominant Approaches towards Disasters in Seven European Countries.” Journal of Risk Research 19 (3): 288–304. doi:10.1080/13669877.2014.961520.
- Cronbach, L. J. 1951. “Coefficient Alpha and the Internal Structure of Tests.” Psychometrika 16 (3): 297–334. doi:10.1007/BF02310555.
- Dake, K. 1991. “Orienting Dispositions in the Perception of Risk: An Analysis of Contemporary Worldviews and Cultural Biases.” Journal of Cross-Cultural Psychology 22 (1): 61–82. doi:10.1177/0022022191221006.
- Dake, K. 1992. “Myths of Nature: Culture and the Social Construction of Risk.” Journal of Social Issues 48 (4): 21–37. doi:10.1111/j.1540-4560.1992.tb01943.x.
- Dawson, J. F. 2014. “Moderation in Management Research: What, Why, When and How.” Journal of Business and Psychology 29 (1): 1–19. doi:10.1007/s10869-013-9308-7.
- De Vocht, M., V. Cauberghe, M. Uyttendaele, and B. Sas. 2015. “Affective and Cognitive Reactions towards Emerging Food Safety Risks in Europe.” Journal of Risk Research 18 (1): 21–39. doi:10.1080/13669877.2013.879486.
- Douglas, M. 1970. Natural Symbols: Explorations in Cosmology. London: Routledge.
- Douglas, M., and A. Wildavsky. 1982. Risk and Culture: An Essay on the Selection of Technological and Environmental Dangers. Oakland: University of California Press.
- Douglas, M., and S. Ney. 1998. Missing Persons: A Critique of Personhood in the Social Sciences. Berkeley: University of California Press.
- Egan, P. J., and M. MUllin. 2012. “Turning Personal Experience into Political Attitudes: The Effect of Local Weather on Americans’ Perceptions about Global Warming.” The Journal of Politics 74 (3): 796–809. doi:10.1017/S0022381612000448.
- Gill, D. A., J. S. Picou, and L. A. Ritchie. 2012. “The Exxon Valdez and BP Oil Spills: A Comparison of Initial Social and Psychological Impacts.” American Behavioral Scientist 56 (1): 3–23. doi:10.1177/0002764211408585.
- Gross, J. L., and S. Rayner. 1985. Measuring Culture: A Paradigm for the Analysis of Social Organization. New York: Columbia University Press.
- Harris, P. G. 2008. “Climate Change and Global Citizenship.” Law & Policy 30 (4): 481–501. doi:10.1111/j.1467-9930.2008.00283.x.
- Hooper, D., J. Coughlan, and M. Mullen. 2008. “Evaluating Model Fit: A Synthesis of the Structural Equation Modelling Literature.” In 7th European Conference on Research Methodology for Business and Management Studies. London, UK: Regent’s College.
- Howe, P. D., J. R. Marlon, M. Mildenberger, and B. S. Shield. 2019. “How Will Climate Change Shape Climate Opinion?” Environmental Research Letters 14 (11): 113001. doi:10.1088/1748-9326/ab466a.
- Jenkins-Smith, H. C., and W. K. Smith. 1994. “Ideology, Culture, and Risk Perception.” In Politics, Policy, and Culture, edited by D. J. Coyle and R. J. Ellis, 17–32.Boulder, CO: Westview Press.
- Johnson, B. B. 2017. “Explaining Americans’ Responses to Dread Epidemics: An Ilustration with Ebola in Late 2014.” Journal of Risk Research 20 (10): 1338–1357. doi:10.1080/13669877.2016.1153507.
- Johnson, B. B., and B. Swedlow. 2020. “Comparing Cultural Theory and Cultural Cognition Theory Survey Measures to Each Other and as Explanations for Judged Risk.” Journal of Risk Research 23 (10): 1278–1300. doi:10.1080/13669877.2019.1646310.
- Johnson, B. B., and B. Swedlow. 2021. “Cultural Theory’s Contributions to Risk Analysis: A Thematic Review with Directions and Resources for Further Research.” Risk Analysis : An Official Publication of the Society for Risk Analysis 41 (3): 429–455. doi:10.1111/risa.13299.
- Johnson, B. B., and M. Mayorga. 2021. “Temporal Shifts in Americans’ Risk Perceptions of the Zika Outbreak.” Human and Ecological Risk Assessment: An International Journal 27 (5): 1242–1257. doi:10.1080/10807039.2020.1820852.
- Johnson, B. B., B. Swedlow, and M. W. Mayorga. 2020. “Cultural Theory and Cultural Cognition Theory Survey Measures: Confirmatory Factoring and Predictive Validity of Factor Scores for Judged Risk.” Journal of Risk Research 23 (11): 1467–1490. doi:10.1080/13669877.2019.1687577.
- Johnson, M., P. Brace, and K. Arceneaux. 2005. “Public Opinion and Dynamic Representation in the American States: The Case of Environmental Attitudes.” Social Science Quarterly 86 (1): 87–108. doi:10.1111/j.0038-4941.2005.00292.x.
- Jones, M. D. 2014. “Communicating Climate Change: Are Stories Better than “Just the Facts”?” Policy Studies Journal 42 (4): 644–673. doi:10.1111/psj.12072.
- Jones, M. D., and M. K. McBeth. 2010. “A Narrative Policy Framework: Clear Enough to Be Wrong?” Policy Studies Journal 38 (2): 329–353. doi:10.1111/j.1541-0072.2010.00364.x.
- Kahan, D. M. 2012. “Cultural Cognition as a Conception of the Cultural Theory of Risk.” In Handbook of Risk Theory, edited by S. Roeser, R. Hillerbrand, and P. Sandin, 725–759. New Haven, CT: Yale University.
- Kahan, D. M. 2015. “Climate-Science Communication and the Measurement Problem.” Political Psychology 36 (S1): 1–43. doi:10.1111/pops.12244.
- Kahan, D. M. 2017. “Ordinary Science Intelligence: A Science-Comprehension Measure for Study of Risk and Science Communication, with Notes on Evolution and Climate Change.” Journal of Risk Research 20 (8): 995–1016. doi:10.1080/13669877.2016.1148067.
- Kahan, D. M., D. Braman, J. Gastil, P. Slovic, and C. L. Mertz. 2007. “Culture and Identity-Protective Cognition: Explaining the White Male Effect in Risk Perception.” Journal of Empirical Legal Studies 4 (3): 465–505. doi:10.1111/j.1740-1461.2007.00097.x.
- Kahan, D. M., E. Peters, M. Wittlin, P. Slovic, L. L. Ouellette, D. Braman, and G. N. Mandel. 2012. “The Polarizing Impact of Science Literacy and Numeracy on Perceived Climate Change Risks.” Nature Climate Change 2 (10): 732–735. doi:10.1038/nclimate1547.
- Kahan, D. M., H. Jenkin-Smith, and D. Braman. 2011. “Cultural Cognition of Scientific Consensus.” Journal of Risk Research 14 (2): 147–174. doi:10.1080/13669877.2010.511246.
- Kahan, D. M., K. H. Jamieson, A. Landrum, and K. Winneg. 2017. “Culturally Antagonistic Memes and the Zika Virus: An Experimental Test.” Journal of Risk Research 20 (1): 1–40. doi:10.1080/13669877.2016.1260631.
- Kahan, D., D. Braman, P. Slovic, J. Gastil, and G. Cohen. 2009. “Cultural Cognition of the Risks and Benefits of Nanotechnology.” Nature Nanotechnology 4 (2): 87–90. doi:10.1038/nnano.2008.341.
- Kaiser, H. F. 1960. “The Application of Electronic Computers to Factor Analysis.” Educational and Psychological Measurement 20 (1): 141–151. doi:10.1177/001316446002000116.
- Kim, D.-Y, and J. Jung. 2019. “Cultural Attributes and Risk Perception: The Moderating Role of Different Types of Research and Development.” Journal of Risk Research 22 (2): 161–176. doi:10.1080/13669877.2017.1351475.
- Kim, H. K., and Y. Kim. 2019. “Risk Information Seeking and Processing about Particulate Air Pollution in South Korea: The Roles of Cultural Worldview.” Risk Analysis : An Official Publication of the Society for Risk Analysis 39 (5): 1071–1087. doi:10.1111/risa.13231.
- Little, R. J. A. 1988. “A Test of Missing Completely at Random for Multivariate Data with Missing Values.” Journal of the American Statistical Association 83 (404): 1198–1202. doi:10.1080/01621459.1988.10478722.
- Liu, L., and R. Morris. 2022. “The Messenger Matters: Environmental Nonprofit Oganisations’ Public Faces, Information Recipients’ Worldviews, and the Credibility of ENPOs’ Disclosed Policy Information.” Journal of Public Policy 42 (1): 165–184. doi:10.1017/S0143814X2100009X.
- Liu, L.-Y. 2018. “How Radical is Too Radical? Public Perception of Taiwanese Environmental Nonprofit Organizations’ Activism.” Social Science Quarterly 99 (4): 1426–1445. doi:10.1111/ssqu.12507.
- Liu, X., and R. Mu. 2016. “Public Environmental Concern in China: Determinants and Variations.” Global Environmental Change 37: 116–127. doi:10.1016/j.gloenvcha.2016.01.008.
- Loewenthal, K., and C. A. Lewis. 2015. An Introduction to Psychological Tests and Scales. London, UK: Taylor & Francis.
- Lord, C. G., and C. A. Taylor. 2009. “Biased Assimilation: Effects of Assumptions and Expectations on the Interpretation of New Evidence.” Social and Personality Psychology Compass 3 (5): 827–841. doi:10.1111/j.1751-9004.2009.00203.x.
- Maleki, A., and F. Hendriks. 2015. “Grid, Group, and Grade: Challenges in Operationalizing Cultural Theory for Cross-National Research.” Cross-Cultural Research 49 (3): 250–280. doi:10.1177/1069397114555843.
- Marris, Claire, Ian H. Langford, and Timothy O’Riordan. 1998. “A Quantitative Test of the Cultural Theory of Risk Perceptions: Comparison with the Psychometric Paradigm.” Risk Analysis 18 (5): 635–647. doi:10.1111/j.1539-6924.1998.tb00376.x.
- Mayorga, M., and B. B. Johnson. 2019. “A Longitudinal Study of Concern and Judged Risk: The Case of Ebola in the United States, 2014–2015.” Journal of Risk Research 22 (10): 1280–1293. doi:10.1080/13669877.2018.1466827.
- McIver, John P., and Carmines, Edward G., Quantitative applications in the social sciences, Unidimensional Scaling, Beck, M. S. Lewis, London: Sage., 1981, 24,
- Morss, R. E., H. Lazrus, A. Bostrom, and J. L. Demuth. 2020. “Influence of Cultural Worldviews on People’s Responses to Hurricane Risks and Threat Information.” Journal of Risk Research 23 (12): 1620–1649. doi:10.1080/13669877.2020.1750456.
- Moyer, R. M., and Geoboo Song. 2019. “Cultural Predispositions, Specific Affective Feelings, and Benefit–Risk Perceptions: Explicating Local Policy Eites’ Perceived Utility of High Voltage Power Line Installations.” Journal of Risk Research 22 (4): 416–431. doi:10.1080/13669877.2017.1391317.
- Mutz, D. 1993. “Direct and Indirect Routes to Politicizing Personal Experience: Does Knowledge Make a Difference?” Public Opinion Quarterly 57 (4): 483–502. doi:10.1086/269392.
- Ogunbode, C. A., C. Demski, S. B. Capstick, and R. G. Sposato. 2019. “Attribution Matters: Revisiting the Link between Extreme Weather Experience and Climate Change Mitigation Responses.” Global Environmental Change 54: 31–39. doi:10.1016/j.gloenvcha.2018.11.005.
- Olli, E. 2012. “Rejected Cultural Biases Shape Our Political Beliefs.” PhD diss., University of Bergen.
- Rayner, S. 1992. “Cultural Theory and Risk Analysis.” In Social Theories of Risk, edited by S. Krimsky and D. Golding, 83. New York: Praeger Publisher.
- Reardon, C. A., and K. Govender. 2013. “Masculinities, Cltural Worldviews and Risk Perceptions among South African Adolescent Learners.” Journal of Risk Research 16 (6): 753–770. doi:10.1080/13669877.2012.737823.
- Rippl, S. 2002. “Cultural Theory and Risk Perception: A Proposal for a Better Measurement.” Journal of Risk Research 5 (2): 147–165. doi:10.1080/13669870110042598.
- Shen, J., and T. Saijo. 2008. “Reexamining the Relations between Socio-Demographic Characteristics and Individual Environmental Concern: Evidence from Shanghai Data.” Journal of Environmental Psychology 28 (1): 42–50. doi:10.1016/j.jenvp.2007.10.003.
- Siegrist, M., and A. Bearth. 2021. “Worldviews, Trust, and Risk Perceptions Shape Public Acceptance of COVID-19 Public Health Measures.” Proceedings of the National Academy of Sciences 118 (24): Article e2100411118. doi:10.1073/pnas.2100411118.
- Smith, E. R. 2002. Energy, the Environment, and Public Opinion. Washington, DC: Rowman & Littlefield.
- Song, G., C. L. Silva, and H. C. Jenkins-Smith. 2014. “Cultural Worldview and Preference for Childhood Vaccination Policy.” Policy Studies Journal 42 (4): 528–554. doi:10.1111/psj.12076.
- Spence, A., W. Poortinga, C. Butler, and N. F. Pidgeon. 2011. “Perceptions of Climate Change and Willingness to save Energy Related to Flood Experience.” Nature Climate Change 1 (1): 46–49. doi:10.1038/nclimate1059.
- Suls, J., J. P. Rose, P. D. Windschitl, and A. R. Smith. 2013. “Optimism following a Tornado Disaster.” Personality & Social Psychology Bulletin 39 (5): 691–702. doi:10.1177/0146167213477457.
- Swedlow, B. 2011. “Editor’s Introduction: Cultural Theory’s Contributions to Political Science.” PS: Political Science & Politics 44 (4): 703–710. doi:10.1017/S1049096511001314.
- Swedlow, B. 2017. “Three Cultural Boundaries of Science, Institutions, and Policy: A Cultural Theory of Coproduction, Boundary-Work, and Change.” Review of Policy Research 34 (6): 827–853. doi:10.1111/ropr.12233.
- Swedlow, B., and M. L. Wyckoff. 2009. “Value Preferences and Ideological Structuring of Attitudes in American Public Opinion.” American Politics Research 37 (6): 1048–1087. doi:10.1177/1532673X09333959.
- Swedlow, Brendon, Joseph T. Ripberger, Li‐Yin Liu, Carol L. Silva, Hank Jenkins‐Smith, and Branden B. Johnson. 2020. “Construct Validity of Cultural Theory Survey Measures.” Social Science Quarterly 101 (6): 2332–2383. doi:10.1111/ssqu.12859.
- Terpstra, T., M. K. Lindell, and J. M. Gutteling. 2009. “Does Communicating (Flood) Risk Affect (Flood) Risk Perceptions? Results of a Quasi-Experimental Study.” Risk Analysis : An Official Publication of the Society for Risk Analysis 29 (8): 1141–1155. doi:10.1111/j.1539-6924.2009.01252.x.
- Tukey, J. 1949. “Comparing Individual Means in the Analysis of Variance.” Biometrics 5 (2): 99–114. doi:10.2307/3001913.
- Tumlison, C., R. Moyer, and G. Song. 2017. “The Origin and Role of Trust in Local Policy Elites’ Perceptions of High-Voltage Powerline Installations in the State of Arkansas.” Risk Analysis : An Official Publication of the Society for Risk Analysis 37 (5): 1018–1036. doi:10.1111/risa.12662.
- Verweij, M., S. Luan, and M. Nowacki. 2011. “How to Test Cultural Theory: Suggestions for Future Research.” PS: Political Science & Politics 44 (4): 745–748. doi:10.1017/S1049096511001399.
- Walsh, J. E. 1947. “Concerning the Effect of Intraclass Correlation on Certain Significance Tests.” The Annals of Mathematical Statistics 18 (1): 88–96. doi:10.1214/aoms/1177730495.
- Whitmarsh, L. 2008. “Are Flood Victims More Concerned about Climate Change than Other People? The Role of Direct Experience in Risk Perception and Behavioural Response.” Journal of Risk Research 11 (3): 351–374. doi:10.1080/13669870701552235.
- Wildavsky, A., and K. Dake. 1990. “Theories of Risk Perception: Who Fears What and Why?” Daedalus 119 (4): 41–60.
- Xiao, C., R. E. Dunlap, and D. Hong. 2013. “The Nature and Bases of Environmental Concern among Chinese Citizens.” Social Science Quarterly 94 (3): 672–690. doi:10.1111/j.1540-6237.2012.00934.x.
- Xue, W., D. W. Hine, A. D. G. Marks, W. J. Phillip, and S. Zhao. 2016. “Cultural Worldviews and Climate Change: A View from China.” Asian Journal of Social Psychology 19 (2): 134–144. doi:10.1111/ajsp.12116.
- Xue, W., D. W. Hine, N. M. Loi, E. B. Thorsteinsson, and W. J. Phillips. 2014. “Cultural Worldviews and Environmental Risk Perceptions: A Meta-Analysis.” Journal of Environmental Psychology 40: 249–258. doi:10.1016/j.jenvp.2014.07.002.
- Yang, J. 2015. “The Influence of Culture on Koreans’ Risk Perception.” Journal of Risk Research 18 (1): 69–92. doi:10.1080/13669877.2013.879490.
- Yuan, M. 2022. “Psychological Perceptions and Voluntary Protective Behaviors during COVID-19 Pandemic in China: The Roles of Cultural Worldview.” Human and Ecological Risk Assessment: An International Journaldoi:10.1080/10807039.2021.2023316.
- Yuan, M., and B. Swedlow. 2022. “Chinese Cultural Biases, Value Congruence, and Support for and Compliance with Protective Policies during the COVID-19 Pandemic.” Review of Policy Research. doi:10.1111/ropr.12515.
- Yuan, M., J. Zeng, B. Swedlow, and R. Qi. 2022. “Environmental Concern among Chinese Youth: The Roles of Knowledge and Cultural Bias.” Environmental Education Research 28 (10): 1472–1489. doi:10.1080/13504622.2022.2033705.
- Zaller, J. 1992. The Nature and Origins of Mass Opinion. Cambridge: Cambridge University Press.
- Zaval, L., E. A. Keenan, E. J. Johnson, and E. U. Weber. 2014. “How Warm Days Increase Belief in Global Warming.” Nature Climate Change 4 (2): 143–147. doi:10.1038/nclimate2093.
- Zeng, J., M. Yuan, and G. Huang. 2022. “Individual Characteristics or Cultures? Public Risk Perception in the Coronavirus Pandemic.” Journal of Risk Research 25 (11–12): 1413–1443. Published online:11 Nov. 2022. doi:10.1080/13669877.2022.2142951.
- Zheng, S., M. E. Kahn, W. Sun, and D. Luo. 2014. “Incentives for China’s Urban Mayors to Mitigate Pollution Externalities: The Role of the Central Government and Public Environmentalism.” Regional Science and Urban Economics 47: 61–71. doi:10.1016/j.regsciurbeco.2013.09.003.
Appendices
Appendix A:
Demographics of the respondents (N = 5003)
Appendix B:
English translation of survey items measuring culture
Appendix C:
Confirmatory factor analysis of 16 items on five factors for measuring Grid-Group dimensions
Appendix D:
Details of the modeling and analytic choices
First, a series of tests were conducted to test the assumptions of the multilevel model. Q-Q plot and histograms indicated that normally distributed residuals at both levels were met. Pairwise correlation indicated that predictions at each level are independent of residuals at each of the two levels, and that residuals at each level are independent of each other. The test of homogeneity of level-1 variance indicated a significant heterogeneity of variance. Therefore, robust standard errors were included in all models. Little’s test (Little Citation1988) indicate that missing values are random. Therefore, maximum likelihood estimation was employed.
As for multi-level models, we start with bivariate analyses including:
an intercept-as-outcomes model to test the bivariate relationship between actual condition of environmental problems and public environmental perception:
two intercept-as-outcomes models to test separately the bivariate relationship between two cultural worldview scales and public environmental perception:
We then move to multivariate analyses including:
another intercept-as-outcomes model that regressed environmental perception on cultural worldview, actual condition of environmental problems and demographics:
And (4) an intercept and slope-as-outcomes model to test whether the increase in the actual condition of environmental problem alters the relationship between cultural worldview and public environmental perception:
where
is the dependent variable of perceived severity of each of the eight types of environmental problems;
00 is the average intercept of environmental risk perception across provinces;
10 to
60 are the effect of the level-one predictor including cultural worldview and demographic variables,
01 is the effect of the level-two predictor- actual severity of the eight types of environmental problems,
11 to
21 are the regression coefficients for the cross-level interaction,
is random deviation in environmental perception for each individual,
0j is a random deviation in environmental perception for each of the 28 provinces. In all models, continuous variables are standardized to for comparison and interpretation purposes.
Appendix E:
Means plots on perceived severity of local environmental problems