
Abstract
One of the challenges faced by organisations that provide official statistics is how to convey the uncertainty related to the statistics. This artlce sets out the importance of conveying uncertainty, and introduces the work of the UK’s Office for Statistics Regulation. The article summarises a short review, undertaken by the Office for Statistics Regulation, of practices by official statistics providers in the United Kingdom. It argues that tthere are two distinct types of uncertainty: specific uncertainty in the statistical estimates themselves; and contextual uncertainty, which lies in the inferences that a user may draw from, and the weight a user may place on, the official statistics. The article then briefly considers the potential relevance of different understandings of cognitive processes. It concludes that the communication of uncertainty is an area of developing practice within official statistics.
1. Introduction
Benjamin Franklin famously said that nothing can be said to be certain, except for death and taxes. In terms of official statistics, he was right. Uncertainty is a universal feature of official statistics, even for statistics on tax collection and deaths. It is always important to recognise the uncertainties in what may appear to be firm, fixed quantitative numbers.
To take mortality as an example. This may seem to be one of the most straightforward statistics. It is after all a count of the number of deaths that have been identified in a given period. Yet even this apparently straightforward number can have some uncertainty to it. Are we talking about deaths by date of registration or by date of occurrence? Does the measure include deaths investigated by coroner? How reliable are attributions of cause of death?
While uncertainty is a universal feature of official statistics, it is also challenging to convey to users of statistics. The challenges arise in part from the technical nature of statistics as a discipline. Uncertainty as understood by statisticians has an inevitably technical component, based on a language of bias, priors and distributions that may not be readily accessible to non-experts. The challenges also arise from communication considerations. Providers of statistics (or producers, as they will be described in this paper) fear that the communication of uncertainty runs against the user demand for clear, simple numbers to describe a phenomenon (crime rates, Gross Domestic Product, unemployment, et cetera). Producers can sometimes assert that the communication of uncertainty might undermine trust in their expertise and the quality of the statistics they produce. Yet communicating uncertainty is essential given that both producers and users will want to draw inferences from statistics.
This article discusses the communication of uncertainty by providers of official statistics. It builds on the work of the Office for Statistics Regulation, the UK’s regulatory body for official statistics, and sets out the findings of a brief review conducted in 2022 into the communication of uncertainty. The article updates these findings with the more recent conclusions of a review of the UK’s approach to revising estimates of Gross Domestic Product.
It is structured as follows: Section 1 introduces the work of the Office for Statistics Regulation, and its emphasis on trustworthiness, quality and value. Section 2 outlines what the concept of uncertainty means in the context of official statistics and delineates two distinct concepts: specific uncertainty and contextual uncertainty. Section 3 describes the results of a review undertaken by the Office for Statistics Regulation into how uncertainty is communicated while Section 4 describes the findings of an Office for Statistics Regulation report into revisions of GDP. Section 5 sets out some theoretical considerations about the nature of thinking processes. Section 6 draws some generic conclusions. And, although this is not an academic article, the concluding section includes a plea familiar from academic articles: more research is needed.
2. The Office for Statistics Regulation (OSR)
The Office for Statistics Regulation (OSR) is the regulatory arm of the United Kingdom Statistics Authority, a body established by the Statistics and Registration Service Act (2007).
The Authority is independent from government Ministers. It has two administrative offices: the Office for National Statistics (ONS), which is the UK’s National Statistical Institute (NSI), responsible for the production of official statistics on the UK economy, population and a range of other key measures; and the Office for Statistics Regulation (OSR), which sets the standards for all statistical producers in the UK – both the ONS and also the statistics produced by Government departments and agencies. The regulatory office is operationally separate from producers of statistics.
In line with the Statistics and Registration Service Act (2007), OSR’s principal roles are to:
Set the statutory Code of Practice for Statistics;
Assess compliance with the Code of Practice;
Award the National Statistics designation to official statistics that comply fully with the Code of Practice; and
Report any concerns on the quality, good practice and comprehensiveness of official statistics.
OSR’s vision is simple: statistics should serve the public good. But what does it mean for statistics to serve the public good? OSR interprets this as follows: statistics published by public sector bodies should be produced in a trustworthy way, be of high quality, and provide value by answering people’s questions. In doing so, they provide insight into the outcomes of public policy; help people make choices; and inform policymakers about the need for new policies.
When they fulfil this ambition, statistics are part of the lifeblood of democratic debate. Political debate frequently makes use of official statistics as a way to support consideration of the state of things – of the health and wealth of the country; of migration and asylum; of the economy and education; and many more categories besides.
Statistics therefore should serve a very wide range of users. When they meet the needs of these users, they serve the public good. But they do not always fulfil these ambitions. Their value can be harmed – through poor production, lack of relevance and coherence, and through misuse. It is our role as regulator to minimise these problems.
And a key aspect of addressing these problems is to ensure that the uncertainty inherent in statistics is appropriately communicated.
3. What is uncertainty?
Official statistics are a quantitative representation of the world. Whether it is migration or inflation, or any other topic, official statistics involve the estimation and quantification of real-world phenomena, and their representation through high level aggregate numbers (for example: the level of the prices index; the number of migrants). They might be thought of as doing the same work as a map: reflecting and representing the world in stylised ways that enable us to understand and navigate it better.
While official statistics are fundamentally representative, I have often detected a tendency among people who use do not use official statistics regularly to regard them as fixed, certain measurements. For example, I once heard a senior finance professional say that they didn’t want a survey (dismissed as ‘just opinions’), they wanted ‘hard numbers’, like GDP. To which my internal response – regretfully never uttered – was: if you think GDP is a hard, fixed number, then you don’t know much about how GDP is measured.
This assumption of fixity and certainty is problematic. Firstly, it misleads significantly as to the nature of the process of producing statistics. Statistics are estimates of some aspect of economic and social life. To produce them, statisticians identify what concept they are trying to measure (household costs; foreign trade; crime; etc.) and then identify the most suitable way of obtaining data on that concept or the best proxy for the concept. Sometimes the data will be readily available, from administrative data systems or private sector sources. On other occasions the data will need to be collected through surveys, or modelled and inferred through the combination of different sources.
Imperfections arise from issues with the underlying data. These issues include sampling errors (where the sample taken is not representative of the whole); gaps (where data are simply not available on some part of the population – for example, household surveys typically miss people who live in communal establishments like hostels or student halls of residence); and data quality problems (for example, where an administrative system incorrectly records an address for a business, thereby skewing any resultant statistics when broken down geographically).
In many cases, then, the data collected will be an imperfect metric or proxy for the concept we are interested in.
Secondly, the assumption of certainty can lead to flawed decisions. Take unemployment. This is a key variable in informing macroeconomic decisions like interest rates. Decision makers need to recognise the uncertainty in estimates of unemployment, including the wide confidence intervals around central estimates. If they do not, this could lead them into making significant decisions on the basis of a perceived fall in unemployment in a given month. But the fall could turn out to be an artefact of uncertainty and could be reversed by a contrasting central estimate the following month – requiring a reconsideration of the policy decision.
At OSR we recognise two distinct categories of uncertainty – although I should start with a caveat. These categories are rules of thumb, which have not been tested against rigorous theoretical criteria. Nevertheless, they seem to have served OSR well to guide judgement in specific cases involving uncertainties in official statistics.
To illustrate the two categories of uncertainty, consider maps. For a map, there is a difference between the map-maker’s perspective, and the map-reader’s perspective. The map maker may successfully communicate the conventions that go into the production of the map – what different icons mean, how contour lines are measured, and so on. That is useful. But it is quite distinct from the map reader’s desire to use the map to determine how to undertake a journey, which depends on their inferences about the best route, the paths to avoid, the steeper hills to navigate around.
This leads me to define two distinct types of uncertainty in official statistics, one which is tied to the producer’s perspective, and one which is more based on the audience’s point of view. Above, I set out the type of imperfection that arises from biases and flaws in underlying data. This imperfection relates to the nature of the production of statistics – it is endogenous to, bound up with, the process of collecting and estimating. I call this specific or analytical uncertainty. It involves the recognition that the estimate is only an approximation, and a range of other estimates could also be plausible. This is perhaps the more familiar notion of uncertainty that arises in surveys – that the survey result represents a central estimate around which there is a confidence interval.
The second imperfection is more slippery. We are interested in the inferences that users draw, for policy and other decision purposes, from statistics. But inferences relate not to the nature of production but to the nature of use: that numbers may not mean what users think they mean; and this may lead them to place unwarranted weight on them for decision making purposes. For this audience-based uncertainty I used the term contextual or cognitive uncertainty. While the term ‘cognitive’ might seem unusual in a statistical context, I think it describes well the risk of assuming more certainty than the statistics really support. It leads to the risk in the minds of that audience as users of statistics – of putting too much evidential weight on statistics and of assuming too much certainty of knowledge, with the outcome that understanding, and decisions, are misplaced. I see these as risks related to the way that insight, analysis and options are processed in the minds of users, and hence I think that the term ‘cognitive’ is justified.
However, although the two categories lead to distinct communication approaches, the distinction should not be drawn too sharply. To some extent, they are co-dependent. In other words, having a good approach to the contextual, what-does-this-mean-for-my-decision uncertainty depends on there being a foundation of understanding uncertainty in the specific, analyst’s sense. Or, in short, the analytical uncertainty is a necessary starting point for cognitive understanding for the audience.
The next section considers the evidence that OSR has gathered on how statistics producers communicate both types of uncertainty to the users of statistics.
4. The communication of uncertainty in official statistics
Our main evidence sources on the communication of uncertainty comes from our ongoing work to review how official statistics in the UK comply with the Code of Practice for Statistics. As part of this work, we have conducted a review of how uncertainty is communicated in a sample of official statistics. In addition, in the next section, I set out the findings of a review we undertook of GDP revisions in November 2023 in the following section.
We undertook our review 2022 (Office for Statistics Regulation Citation2022). We looked at a range of official statistics, and considered what approach the producers took to communicating uncertainty in the statistical outputs.
Statistics producers do not find it straightforward to communicate uncertainty. They want to be clear on caveats surrounding the estimates they have provided. But they want to avoid overloading the text of what they publish with disclaimers. And some are concerned that highlighting uncertainty might undermine trust – although the evidence from participant experiments (see the work of the Winton Centre for Risk and Evidence Communication at the University of CambridgeFootnote2) suggests that the risk of undermining trust is overstated (Kerr et al. Citation2023; Van der Bles et al. Citation2020).
In our review, we found a number of cases where statistics producers either:
Did not recognise uncertainty at all, but instead presented their estimates as single, fixed-point quantities; or
Communicated uncertainty in a generic, boilerplate way, using language of caution – encouraging users to treat estimates ‘with caution’, but providing no further assistance or guidance.
We regard both these approaches as inadequate. They fail to convey properly either the specific or the contextual uncertainties.
We did, however, find a number of examples of good practice.
In terms of the contingency about the numerical estimate itself (specific uncertainty), it is common for statistics producers to seek to convey this type of uncertainty. A good example comes from the ONS’s Covid Infection Survey. The Covid Infection Survey was a survey of households in the UK. It tested people for Covid-19, whether or not they had any symptoms, and allowed the ONS to present estimates of the prevalence of infection.
The Covid Infection Survey presented a clear range around the key estimates of Covid prevalence. For example, reproduces a graph that was published in the statistical report published on 16 July 2021 (Office for National Statistics Citation2021a). It shows both a clear range relating to the central estimate, using a shaded area around the trend line; and also indicates the greater uncertainty in more recent estimates (to the right of the vertical dotted line). We conclude that this is a good practice which helps users understand the range of plausible values around a headline estimate.Footnote3
Figure 1. Estimates of prevalence of Covid-19 infection in the four nations of the United Kingdom between May and July 2021.Source: Office for National Statistics - Covid Infection Survey
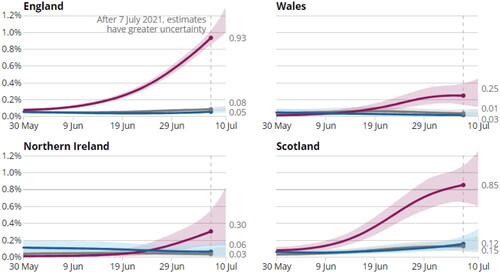
Figure 2. The variant population projections offer a range of future demographic scenarios.
Source: Office of National Statistics – National population projections
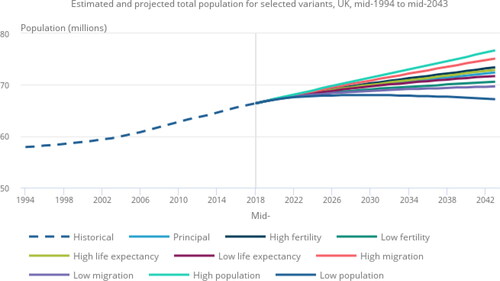
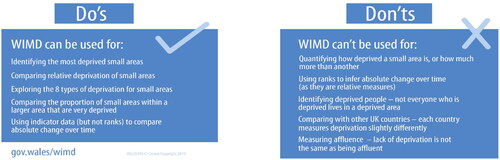
Figure 3. Guidance to users of the Welsh Indices of Multiple Deprivation (WIMD) provided by the Welsh Government.Source: Welsh Government - Welsh Indices of Multiple Deprivation
Similarly, ONS’s main population projects convey uncertainty about the future level of population by providing a range of variant projections. For example, the population projections published in October 2019 (Office for National Statistics Citation2019) included a series of variants (see ). These variants show the impact of different assumptions, and to some extent allow users to see what would happen if their preferred scenario (like lower migration) were to pan out. (However, some interim projections, such as those published in January 2024 (Office for National Statistics Citation2024), have not provided these variants).
These examples also illustrate an important audience aspect of communicating uncertainty. In any communication of official statistics, there is likely to be a range of audiences, with different aims: some technical, some wanting to use the statistics to make a decision, some instead seeking a quick overview to aid understanding and so on. The communication approach of using shaded areas or alternate projections caters well for these different audience needs. There is also some excellent applied research on this from the Winton Centre (Van der Bles et al. Citation2019).
Our review highlighted that these quantitative approaches are reflected not just in visuals but also in words. For example, in the Covid Infection Survey output referred to above, the written text highlights the uncertainty in a verbal way, supplementing the graphic representation:
In England, the percentage of people testing positive for coronavirus (COVID-19) continued to increase in the week ending 10 July 2021; we estimate that 577,700 people within the community population in England had COVID-19 (95% credible interval: 532,700 to 625,300), equating to around 1 in 95 people (Office for National Statistics Citation2021a).
This increase, combined with evidence from other data suggests that variant B.1.617.2 is likely to have caused this increase, but this cannot be confirmed until sequenced data are available (Office for National Statistics Citation2021b).
The examples cited thus far do not provide much support or guidance in terms of the inferences, and decisions, that users can draw from the statistics. We did find some examples that involved communicating uncertainty in these more inferential terms. One example we found came from the Wellbeing of Wales 2022 summary. Within its narrative, the statistical output was clear on how uncertainties about labour market statistics limited what users could be infer from them. The commentary also provided guidance to users on what they could safely infer too:
Labour market data is volatile over the short term and it is important not to overinterpret recent changes, particularly in the context of the pandemic. With this caveat, labour market data suggests the pandemic has impacted Welsh economic performance in a way that is broadly similar to the UK (excluding London) (Welsh Government, Well Being of Wales Citation2022).
The share of identifiable spending taken by England, Scotland, Wales and Northern Ireland remains broadly unchanged although England has shown a small increase in recent years partly as a result of Covid-19 related expenditure (HM Treasury, Country and Regional Analysis Citation2022).
Our favourite example of recognising the cognitive aspects of uncertainty comes from the Welsh Government’s Index of Multiple Deprivation (. Guidance to users of the Welsh Indices of Multiple Deprivation (WIMD) provided by the Welsh Government. Source: Welsh Government - Welsh Indices of Multiple Deprivation.). As part of the index, the statisticians provide a clear, unambiguous guide as to what the statistics can and cannot be used for (Welsh Government Citation2023):
We concluded that this was one of the most informative practices that we encountered. It is not overly technical; it does not provide broad, boilerplate caveats; and it does guide users on how the statistics can help, and where they cannot. It therefore caters to a range of audience needs. We have recommended that other producers adopt a similar approach.
In short, then, there are a wide variety of practices, ranging from the failure to recognise uncertainty at all, via boilerplate ‘caveat’ text, through to visual and verbal representations of quantitative uncertainty, and culminating in clear steers to help the audience grapple with cognitive uncertainty.
5. GDP revisions
After we completed our review of uncertainty, we undertook a new piece of work on the way the Office for National Statistics revises estimates of Gross Domestic Product (GDP).
In the autumn of 2023, the ONS announced revisions to its estimate of GDP in the pandemic years of 2020 and 2021. The revisions were significant, and had the potential for changing people’s understanding of the path of economic activity. The revisions were also controversial: critics argued that the ONS had effectively redrawn the economic narrative, and some referred to errors and blunders.Footnote4
Against this backdrop, the OSR undertook a review of ONS’s approach to revisions. Our report, published 29 Nov 2023 (Office for Statistics Regulation Citation2023), concluded that revisions are an inevitable part of the process of estimating GDP and that ONS had a sound approach to making revisions to GDP. Indeed, the headline conclusion was that the more extreme criticisms of ONS were misplaced.
Alongside this, however, we also identified areas for improvement. Among the most significant was the communication of uncertainty. We concluded that:
To promote public and media understanding, ONS should enhance its communication of the uncertainty that lies around GDP estimates as they evolve.Footnote5
…fan charts that show a range of possible values, or density strips which use colour intensity to show the proportion of revisions that fall between different values.Footnote6
ONS should ensure that the uncertainty surrounding these statistics is in itself a key message.Footnote7
…provide analysis that enabled users to better understand revisions, while contextualising them relative to the size of GDP growth rates and with reference to earlier periods of economic turning points and volatile growth.Footnote8
6. Some theories about thought processes
It is common for theoretical discussions of thinking processes to propose binary distinctions: Type I v Type 2; thinking fast, thinking slow; frequentist and Bayesian; left and right brain. In writing this article uncertainty, I have wondered how far these dichotomies match the distinction I have set out between specific, analytical and broader, user-based lenses on uncertainty.
The short answer is that, for the most part, the fit is not good. My distinction is not really a type v type 2 or a fast/slow distinction; and the Bayesian-frequentist distinction is a sub-division within analytical perspectives.
However, there is one distinction, between the left and right brain, that I do think has some strong resonance to the analytical v contextual pairing. Science and medicine have known about the existence of two brain hemispheres for a long time, and there have been increasingly well-developed understanding of the different functions that the left and right brain perform.
More recently, the British thinker Iain McGilchrist has set out an account of the differences in how these two brain hemispheres attend to the world. Bridging the worlds of neuroscience, philosophy and psychiatry, his work The Master and His Emissary (McGilchrist Citation2019) describes evidence on the two sides of the brain and puts forward the view that their different modes of attention are very important. By ‘attention’ McGilchrist is highlighting the type of perception and understanding of external stimuli that each hemisphere undertakes, and how those perceptions and understandings are represented in the hemispheres.
While recognising that I cannot do justice to his full argument, the idea is briefly this: that the left brain is responsible for finely-focused activity, for grasping, for apprehending things in the immediate field of vision. The right brain, by contrast, is responsible for seeing patterns and changes in patterns, and providing a broader-lensed perspective on the world – for threat-perception and relational interaction.Footnote9
The idea is well explained by Harold Hutchinson and Professor George Yarrow of the Regulatory Policy Institute. They write:
In the brain…[we see] the lateralisation (specialisation) of the left {LH} and right {RH} hemispheres. The hemispheres attend to incoming information in different ways, the LH with a narrower, focused field of interest, the RH with a much wider vision of the external environment….The RH attends to the world with the sustained vigilance of, say, a radar system, sensitive to breadth and depth, detecting and seeing not only things that are ‘out there’ but also their movements, their patterns and anomalies in their patterns… The LH apprehends the world with a narrower, local focus, an analytical, partial, and disembodied attention that abstracts from and is relatively insensitive to movement (Harold and George Citation2023).
For McGilchrist, and for Hutchinson and Yarrow, problems arise when the left brain predominates over the right. Pattern recognition is lost; detail is preferred; perspective is squandered. And as a result, important changes in the wider socio-economic environment may be missed.
I think something of the same thing concerns OSR when we review how producers present uncertainty. It is not enough for statistics producers to use standard, boilerplate text to describe uncertainty; nor is the technical, quantified approach enough on its own. Instead, this numerical approach needs to be supplemented by the broader perspective of cognitive uncertainty – how the estimated numbers relate to, impinge on and interact with the understanding and decisions users want to reach. This is why the approach taken by the Welsh index of multiple deprivation seems to us to be so promising – because it unites these two perspectives into something of paramount value to people who want to use the statistics.
7. Conclusion
This paper has been a brief summary of the role of OSR, the importance of articulating uncertainty around official statistics, and the results of an OSR review of how statistics are communicated.
It is definitely NOT a paper of statistical or philosophical theory. So it was almost certainly ambitious, not to say foolhardy, for the paper to veer off into a very brief explanation of views on brain lateralisation. It is a stretch to relate the rather niche context of official statistics to the much more universal consideration of the human brain.
But to me, these ideas of left and right brain functioning offer a useful, perhaps essential, metaphor for considering how: detail and context; micro and macro; numerical and cognitive, all fit together.
More importantly, and with my feet more firmly on the ground, I can also say that it is important for statistics producers to consider the findings of our review, to ensure that they always consider the uncertainty in their estimates, and help users apply that uncertainty to the context in which they find themselves. We will also gather more evidence on the practical application of uncertainty principles in official statistics; which is really just another way of saying ‘more research needed’.
Disclosure statement
No potential conflict of interest was reported by the author(s).
Notes
1 I am grateful to the comments I received from Mark Pont (Office for Statistics Regulation); Professor Sir David Spiegelhalter and Alex Freeman (Winton Centre); and Professor George Yarrow, Harold Hutchinson and Catherine Yarrow (Regulatory Policy Institute). Mark led the original work and is full of insight on these questions. David and Alex not only have led the Winton Centre’s superb body of work, but they helped refine and develop the core distinction between types of uncertainty put forward by this paper – thank you to them both, especially Alex who hit upon the best distillation of the issues. And George, Harold and Catherine brought the right brain perspective of seeing the much bigger picture. Nevertheless, it is important to say this after my thanks: All the misapprehensions, errors and flawed analogies are mine alone.
2 Note that the Winton Centre talks about two types of uncertainty: ‘direct’ uncertainty, for uncertainty around the number itself and ‘indirect’ uncertainty, for uncertainty about the evidence that led to that number. This distinction is related to, but not exactly the same as, the one used in this paper.
3 This good practice example shows, in fact, that the two types of uncertainty are intertwined. The quantitative presentation – the shading around the line – may in fact also be a good way of conveying to the audience the limitations on the use they can make in their cognitive understanding of the prevalence of infection.
4 For example, see the Economist: Britain’s Statisticians Fix a Blunder and Find a Bigger Economy, September 4th, 2023, https://www.economist.com/britain/2023/09/04/britains-statisticians-fix-a-blunder-and-find-a-bigger-economy.
5 Office for Statistics Regulation, op cit, https://osr.statisticsauthority.gov.uk/publication/revisions-of-estimates-of-uk-gross-domestic-product-gdp/.
6 Office for Statistics Regulation, op cit, https://osr.statisticsauthority.gov.uk/publication/revisions-of-estimates-of-uk-gross-domestic-product-gdp/.
7 Office for Statistics Regulation, op cit, https://osr.statisticsauthority.gov.uk/publication/revisions-of-estimates-of-uk-gross-domestic-product-gdp/.
8 Office for Statistics Regulation, op cit, https://osr.statisticsauthority.gov.uk/publication/revisions-of-estimates-of-uk-gross-domestic-product-gdp/.
9 I have focused this summary on McGilchrist’s 2009 work The Master and His Emissary. He has written a more recent work The Matter with Things (2021). As Harold Hutchinson of the Regulatory Policy Institute has pointed out to me, this more recent work may have even more relevance to a consideration of the communication of statistics. For example, Harold has drawn my attention to this quote in Chapter 15: “Like everything else, numbers can be approached in the typical mode of the left hemisphere, or of the right. In left hemisphere mode, they are thought of as absolute entities, abstract, of equal quality, and adynamic (the word ‘statistics’ is derived from the same root as ‘static’). In right hemisphere mode, they may be seen as dynamic relations: music and beauty arise out of the relational nature of numbers, their proportions and structures. In music, this is inherent in melody, harmony and rhythm.” (The Matter with Things, Chapter 15, Reason’s Progeny, Section – Calculation and Judgement, p 596).
References
- Harold, Hutchinson, and George Yarrow. 2023. “Regulatory Policy Institute, To ‘See’, or not to ‘See’: That is the Question.” https://rpieurope.org/files/Essays-NS13.1-To-see-or-not-to-see-4-July-2023.pdf
- HM Treasury, Country and Regional Analysis. 2022. https://www.gov.uk/government/statistics/country-and-regional-analysis-2022/country-and-regional-analysis-november-2022.
- Kerr, John, Anne-Marthe van der Bles, Sarah Dryhurst, Claudia R. Schneider, Vivien Chopurian, Alexandra LJ Freeman, and Sander Van Der Linden. 2023. “The Effects of Communicating Uncertainty Around Statistics, on Public Trust.” Royal Society Open Science 10 (11): 230604. https://doi.org/10.1098/rsos.230604.
- McGilchrist, Lain. 2019. The Master and His Emissary: The Divided Brain and the Making of the Western World. USA: Yale University Press.
- Office for National Statistics. 2019. “National Population Projections, Variant Projections: 2018-Based.” https://www.ons.gov.uk/peoplepopulationandcommunity/populationandmigration/populationprojections/methodologies/nationalpopulationprojectionsvariantprojections2018based#summary-of-variant-projections.
- Office for National Statistics. 2021a. “Covid Infection Survey.” https://www.ons.gov.uk/peoplepopulationandcommunity/healthandsocialcare/conditionsanddiseases/bulletins/coronaviruscovid19infectionsurveypilot/16july2021.
- Office for National Statistics. 2021b. “Sarah Crofts, Understanding COVID-19 Variants – What Can The Coronavirus Infection Survey Tell Us?.” https://blog.ons.gov.uk/2021/05/28/understanding-covid-19-variants-what-can-the-coronavirus-infection-survey-tell-us/#:∼:text=This%20week%2C%20we%20have%20seen,until%20sequenced%20data%20are%20available.
- Office for National Statistics. 2024. “National Population Projections: 2021-Based Interim.” https://www.ons.gov.uk/peoplepopulationandcommunity/populationandmigration/populationprojections/bulletins/nationalpopulationprojections/2021basedinterim.
- Office for Statistics Regulation. 2022. “Approaches to Presenting Uncertainty in the Statistical System.” https://osr.statisticsauthority.gov.uk/wp-content/uploads/2022/09/Approaches_to_presenting_uncertainty_in_the_statistical_system.pdf.
- Office for Statistics Regulation. 2023. “Revisions of Estimates of UK Gross Domestic Product.” https://osr.statisticsauthority.gov.uk/publication/revisions-of-estimates-of-uk-gross-domestic-product-gdp/.
- Van der Bles, A. M., D. Spiegelhalter, S. Dryhurst, A. Freeman, M. Pearson, and J. Park. 2019. “Determining and facilitating the clearest ways to visualize uncertainty around estimates, time series and curves.” Zenodo. https://doi.org/10.5281/zenodo.10790825.
- Van der Bles, Anne Marthe, Sander van der Linden, Alexandra LJ Freeman, and David J. Spiegelhalter. 2020. “The Effects of Communicating Uncertainty on Public Trust in Facts and Numbers.” Proceedings of the National Academy of Sciences 117 (14), 7672–7683. https://doi.org/10.1073/pnas.1913678117.
- Welsh Government, Well Being of Wales. 2022. https://www.gov.wales/sites/default/files/pdf-versions/2023/9/1/1693822034/wellbeing-wales-2022.pdf.
- Welsh Government. 2023. ‘Index of Multiple Deprivation User Guidance.” https://www.gov.wales/welsh-index-multiple-deprivation-index-guidance.