
 ?Mathematical formulae have been encoded as MathML and are displayed in this HTML version using MathJax in order to improve their display. Uncheck the box to turn MathJax off. This feature requires Javascript. Click on a formula to zoom.
ABSTRACT
With the surge in online purchases, customers' requirement for last-mile delivery also increases. This study focuses on the express delivery service, the primary channel in last-mile delivery, to discover the factors influence customers' use. Based on the extended Unified Theory of Acceptance and Use of Technology, a conceptual model is proposed to structure the hypothetical effects between the constructs performance expectancy in delivery speed and delivery reliability, effort expectancy, facilitating conditions and behavioural intention. A 5-year (2015–2019) longitudinal survey was conducted in the UK, and 3964 responses were collected to validate the model. The results indicate that the performance expectancy in delivery reliability has a positive impact on customers' behaviour intention to adopt an express delivery service, while the performance expectancy in delivery speed, unexpectedly, shows insignificant impact. Moreover, the effort expectancy was found to have no effect on behaviour intention; however, the facilitating conditions have a negative influence.
1. Introduction
Understanding how the last-mile logistics (LML) industry can best meet customer satisfaction for last-mile delivery is the probing question that motivates this research to identify the crucial elements of the customer's reasoning for express delivery adoption. Since the beginning of 2000, research has sought to apply the understanding of customer's behaviour to increase the convenience of retail purchases (Anderson and Lee Citation2000; Kukar-Kinney, Ridgway, and Monroe Citation2009; Daugherty, Bolumole, and Grawe Citation2019).
Previous focus was based on the customer visiting a physical store, the traditional retailer's point of sale. This is a place where the customer can view goods locally, make a purchase and then take it home. Since the evolution of digital technology, the ability to make a purchase away from the physical store has increased through the easy access of online shopping and, more importantly, a choice of delivery (Chapman, Soosay, and Kandampully Citation2003; Rodrigues et al. Citation2008). The two elements of the process, sale and delivery, are intrinsically linked (Mena et al. Citation2016). The online purchase is determined by the customer, who can then choose how to receive it. The customer may have a preference for the point of delivery, but it is the retailer and LML service provider who control the options available. Each retailer will have preferred delivery options due to infrastructure and costs provided by LML service provider, but most will offer basic options to the customer, i.e. delivery to door, click and collect, and collection at other pick-up point. The meteoric rise of online sales continues, and the UK's Office for National Statistics data confirm that Internet sales during August and September 2020 have captured 26% of the total retail sales figure (Office for National Statistics Citation2020). The customer now has an increased ability to make a purchase at their convenience, i.e. at any place and any time of day, selecting any last-mile delivery option.
A five-year survey of last-mile delivery in the UK, established essential criteria or the online customer and significant themes for the LML industry. These results led to the understanding that the customer wanted to be informed, to have communication and knowledge of the delivery: ‘Customers do not mind extended delivery times as long as they are notified ahead of time’ (IMRG Citation2020). An increase in online sales triggers an increase in delivery demand, but as the deliveries increase so do the customer's requirements. The customer will request free delivery, as well as the ability to specify when and where they want the delivery and the option to alter these choices at a later date. Exploring the five-year survey results further, this research aims to establish the influencing factors behind the customer's adoption of the express delivery service for last-mile delivery in the UK. The success of online sales relies on the ability of retailer and LML service provider to meet customer satisfaction through its delivery (Murfield et al. Citation2017; Parcelhub Citation2020). Therefore, identifying and understanding the customer's preferences for online delivery provides the LML industry with essential knowledge to adapt its services and to meet customer delivery expectations.
In this paper, we aim to investigate the determinants that influence customers' adoption of an express delivery service for last-mile delivery in the UK, relying on a survey driven by an extended Unified Theory of Acceptance and Use of Technology (UTAUT2)-based conceptual model. The contribution of this study is threefold:
| (1) | The differentiated consideration of delivery speed and delivery reliability, enabling the examination of potentially different influences on customers' intention to adopt an express delivery service. We achieve this by setting the delivery speed and delivery reliability (reflected in timeliness and correctness) as two constructs, i.e. independent variables of the conceptual model. Deconstructing and clustering the dimensions of delivery, rather than aggregating them into a single factor such as generic ‘delivery service performance’ or ‘quality’ in the common treatment, could help us deep dive to identify the substantive dominators or influencers among the constructs. As Handfield and Pannesi (Citation1992) and Jalili Marand, Li, and Thorstenson (Citation2020) have called for, our work, as an initiative, fills the gap in delivery performance segmentation for survey studies on the express delivery service in last-mile delivery. We wish to stimulate attention to necessary and reasonable classifications of express delivery service performance, and even go beyond to other last-mile delivery scenarios. | ||||
| (2) | The development of a conceptual research model, derived from the UTAUT2 (Venkatesh, Thong, and Xu Citation2012), in order to unearth the determinants of customers' use of an express delivery service for last-mile delivery. Since UTAUT2 is superior to other competitive models in understanding the acceptance and use of information-related technology, systems or service from a consumer's point of view, it is a good fit for our research context. Specifically, our distinctive model is composed of the constructs performance expectancy in delivery speed, performance expectancy in delivery reliability, effort expectancy, and facilitating conditions, each of which is hypothesised to have a direct impact on behavioural intention. | ||||
| (3) | The implementation of a five-year longitudinal survey from 2015 to 2019 in the UK, providing a solid data source from a considerable length of time for testing the proposed model. It is worth emphasising that the surveys in the majority of existing relevant studies were not conducted over a period of years, but rather on a one-off basis. The longitudinal survey in our research, spanning 5 years, collected a total of 3964 responses to the questionnaire, and naturally gives the advantages of more inclusive perspectives and more reliable findings. | ||||
The remainder of the paper is organised as follows. Section 2 reviews and compares literature on the express delivery service and the UTAUT2 model. Section 3 develops a UTAUT2-based conceptual research model and proposes four hypotheses about the influences of the constructs on behavioural intention to use an express delivery service. Section 4 correspondingly designs the methodology to verify the proposed research model and hypotheses, i.e. a questionnaire and longitudinal survey. The results of the survey are presented in Section 5, including the reliability, validity, multicollinearity and nonparametric checks and the hypothesis testing, revealing whether the proposed hypotheses are statistically supported or not. The results are further discussed in terms of their possible reasoning in Section 6. Finally, Section 7 gives some insights on theoretical and managerial implications, as well as a summary.
2. Literature review
This section reviews and summarises the survey studies on express delivery service and UTAUT applications.
2.1. Express delivery service for last-mile delivery
Contemporary online shopping commonly operates an omni-channel supply chain and provides flexible service options for customers to select for the last-mile delivery, such as home delivery, in-store self-collection, lockers, etc. (Yuen et al. Citation2018; Xu and Jackson Citation2019; Yuen et al. Citation2019; Milioti, Pramatari, and Kelepouri Citation2020). Home delivery can be referred to as express delivery in this context, shipping online orders to a customer's delivery address.
There have been studies, framed by various conceptual models, which have examined determinants, effects or relationships associated with the express delivery service for last-mile delivery. Some typical examples are listed in . Among these works, the research questions have mainly focused on investigating the influence of the express delivery service on customer satisfaction and subsequent intention to repurchase online (e.g. Ma Citation2017; Chan, Liu, and Zhang Citation2018; Choi, Chung, and Young Citation2019; Jain, Gajjar, and Shah Citation2020; Javed and Wu Citation2020). The topics of inspecting the impact factors on the use of (Yeo, Goh, and Rezaei Citation2017; Xiang and Wu Citation2018; Yoo, Yu, and Jung Citation2018; Xu and Jackson Citation2019) or willingness to pay for (Huang, Shen, and Liang Citation2019; Saha, Zhuang, and Li Citation2020) the express delivery service have also been covered. Our paper falls under the scope of the ‘use’ of the express delivery service.
Table 1. Literature of models relevant to express delivery service for last-mile delivery.
The express delivery service needs to be evaluated in different dimensions to reflect the various aspects that customers may value. Different selections and classifications of delivery-related dimensions could result in completely different, even opposite, hypotheses and conclusions. It can be seen from the literature in that the most common dimensions for express delivery are delivery speed, timeliness, correctness, convenience, cost and intactness. Notably, Choi, Chung, and Young (Citation2019), Vakulenko et al. (Citation2019), Saha, Zhuang, and Li (Citation2020) and Sorkun, Hüseyinoğlu, and Börühan (Citation2020) include most of these dimensions in their work. Our paper also takes the delivery speed, timeliness, correctness, convenience and cost into consideration.
An interesting finding can be observed from the delivery dimensions – normally either speed or timeliness is selected, and they are classified as the same construct even if they are both selected. Only one study (Sorkun, Hüseyinoğlu, and Börühan Citation2020) contains both the delivery speed and timeliness as measurement items, although they are grouped under the same construct, called delivery efficiency. However, the critical dimensions of speed and timeliness describe quite different concepts. The delivery speed reflects the elapsed time (or lead time) from receiving to successfully delivering a customer order, while the delivery timeliness refers to the degree of compliance with the promised time by which the order would be delivered. In other words, the delivery timeliness partly reflects the delivery reliability, in which other delivery dimensions such as correctness and intactness can also be included. On this basis, the delivery speed and reliability should be distinguished from each other as suggested by Handfield and Pannesi (Citation1992) and Jalili Marand, Li, and Thorstenson (Citation2020). To the best of our knowledge, our paper, represents the first time that delivery speed and delivery reliability (i.e. timeliness and correctness) have been differentiated in a survey study on the express delivery service. Only by using this method can any potentially different effects of delivery speed and reliability on the use of express delivery be further explored.
2.2. Unified Theory of Acceptance and Use of Technology 2 (UTAUT2)
The Unified Theory of Acceptance and Use of Technology (UTAUT) was proposed by Venkatesh et al. (Citation2003) as a conceptual model, originally to understand the information technology acceptance and use from a consumer's angle. UTAUT integrates elements across eight models, i.e. the Theory of Reasoned Action (TRA), Technology Acceptance Model (TAM), Motivational Model (MM), Theory of Planned Behaviour (TPB), combined TAM and TPB (C-TAM-TPB), Model of Personal Computer Utilisation (MPCU), Innovation Diffusion Theory (IDT) and Social Cognitive Theory (SCT), and it outperforms each of the eight original models. UTAUT was then extended by Venkatesh, Thong, and Xu (Citation2012) to UTAUT2, which incorporated additional constructs and relationships into UTAUT, thus achieving a substantial improvement in the variance explained in behavioural intention and technology use. Since the express delivery service is one of the options for last-mile delivery (as well as other delivery methods) that customers can select during online shopping, which is highly dependent on information technology, the examination of its adoption is within the applicable scope of UTAUT2 or UTAUT. Therefore, it is appropriate that this paper utilises UTAUT2 as the theoretical foundation for proposing our conceptual model due to its superiority and applicability.
Some literature provides us with good references to adjust UTAUT2 to our problem of designing the conceptual research model. There have been only two studies on express delivery service employing UTAUT2 or UTAUT as conceptual models (see ). Saha, Zhuang, and Li (Citation2020) used UTAUT2 to reveal the determinants of customers' willingness to pay more for delivery and intention to repurchase online, while Xiang and Wu (Citation2018) used UTAUT to discover the factors particularly influencing students' willingness to use campus express delivery services. Both studies looked at different problems than ours, and only considered delivery timeliness, not delivery speed. Apart from the two on express delivery, there have also been studies applying UTAUT2 or UTAUT to other last-mile delivery-related contexts, such as omni-channel shopping (Kazancoglu and Aydin Citation2018), food delivery apps (Lee, Sung, and Jeon Citation2019; Zhao and Bacao Citation2020), autonomous delivery vehicles (Kapser and Abdelrahman Citation2020) and self-service parcel delivery services (Zhou et al. Citation2020).
Regarding the constructs of conceptual models, it is stated in the original UTAUT that performance expectancy, effort expectancy and social influence are direct determinants of behavioural intention, which further determines technology-use behaviour, while facilitation conditions are the direct determinant of use behaviour (Venkatesh et al. Citation2003). On top of the UTAUT, the original UTAUT2 added a link between facilitation conditions and behavioural intention, and integrated three additional constructs: hedonic motivation, price value and habit. The effects of all constructs on behavioural intention and use behaviour are moderated by age, gender and experience (Venkatesh, Thong, and Xu Citation2012). When the original UTAUT2 or UTAUT are referenced by different specific problems to define their own conceptual models, the constructs and relationships, as well as the measurement items under each construct, can be adapted and modified, either partially or fully as needed. This is why the conceptual models of the above-mentioned delivery problems have different structures (i.e. constructs and relationships), even though they are all based on UTAUT2 or UTAUT. Following the same philosophy, tailored from UTAUT2, our conceptual model for the use of an express delivery service is uniquely made up of performance expectancy (split into two lanes, i.e. delivery speed and delivery reliability), effort expectancy and facilitating conditions, directly influencing behavioural intention. Social influence is not considered, as we see people as capable of making independent decisions. We also do not consider the moderating effects of age, gender and experience, partly due to the nature of our problem. We regard the age and gender as less important or influential factors that we do not necessarily need to focus on in terms of their moderating effects, especially in an express delivery service adoption problem of no age or gender bias. In addition, as some constructs are newly developed, our primary goal is to explore their direct effects in this paper. After that, regarding the experience factor, as well as other reasonably possible factors, their moderating effects could be investigated in future studies.
3. Model formulation and hypothesis development
The relationship between various impact factors and customers' express delivery service adoption for last-mile delivery in the UK can be appropriately depicted with reference to the UTAUT2 model (Venkatesh, Thong, and Xu Citation2012). Our UTAUT2-based conceptual research model, shown in consists of the constructs performance expectancy (divided into delivery speed and delivery reliability), effort expectancy, facilitating conditions and behavioural intention.
Figure 1. Research model (UTAUT2-based (Venkatesh, Thong, and Xu Citation2012)).
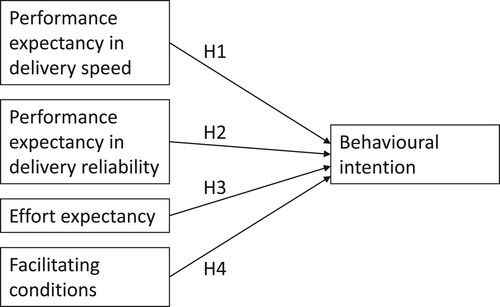
3.1. Performance expectancy
The independent variable performance expectancy is defined as the degree to which using an express delivery service will provide benefits to customers when carrying out last-mile delivery of online orders (Venkatesh, Thong, and Xu Citation2012). Significantly, we identify two subdivided evaluation criteria as constructs – performance expectancy in delivery speed (PEDS) and performance expectancy in delivery reliability (PEDR) – to reflect the two crucial aspects of express delivery service performance.
It is the first time that delivery speed and reliability have been considered as separate constructs in the UTAUT2-based model, instead of two measurement items in the same construct. This new definition enables us to explore their potentially different impacts on the behavioural intention to adopt an express delivery service. The delivery speed is measured by expected waiting time, while the reliability considers delivery ‘at the right time’ (timeliness) and ‘at the right place’ (correctness).
According to the validations from previous studies modelling last-mile delivery problems based on UTAUT2 or UTAUT (Xiang and Wu Citation2018; Lee, Sung, and Jeon Citation2019; Kapser and Abdelrahman Citation2020; Zhao and Bacao Citation2020; Zhou et al. Citation2020), performance expectancy has a positive influence on customer behavioural intention to use the service or technology. Thus, the following two hypotheses are proposed:
Hypothesis 1 Performance expectancy in delivery speed (PEDS) has a positive influence on customer behavioural intention (BI) to adopt an express delivery service for last-mile delivery.
Hypothesis 2 Performance expectancy in delivery reliability (PEDR) has a positive influence on customer behavioural intention (BI) to adopt an express delivery service for last-mile delivery.
3.2. Effort expectancy
The independent variable effort expectancy (EE) is the degree of ease associated with customers' use of an express delivery service in last-mile delivery for online purchases (Venkatesh, Thong, and Xu Citation2012). The degree of ease for customers would increase if the essential core service could made to cater to the needs or convenience of different people. For example, if different delivery options are offered, customers could choose the one that suits them best and put less effort in receiving their parcels, e.g. shorter occupied time.
In past studies on the last-mile delivery service, the impact of EE on BI has been validated with different outcomes, i.e. either positive (Xiang and Wu Citation2018; Zhou et al. Citation2020) or no significant impact (Lee, Sung, and Jeon Citation2019; Kapser and Abdelrahman Citation2020; Zhao and Bacao Citation2020). In order to prove the case in our problem, the hypothesis is formulated as follows:
Hypothesis 3 Effort expectancy (EE) has a positive influence on customer behavioural intention (BI) to adopt an express delivery service for last-mile delivery.
3.3. Facilitating conditions
The independent variable facilitating conditions (FC) refers to customers' perceptions of the resources and support available to use an express delivery service for last-mile delivery (Venkatesh, Thong, and Xu Citation2012). This variable would increase when the amount and variety of additional resources or support provided to customers are high before, in or after the core service. Such resources and support, for instances, could be the text messages sent to customers for delivery updates, the return, exchange and refund services for the unwanted items that customers receive, or the multiple delivery charge schemes which map different delivery options for customers to compare and select, etc.
Similarly to the above-mentioned factors, the effect of FC on BI has also been validated with either positive (Kapser and Abdelrahman Citation2020; Zhou et al. Citation2020) or no significant impact (Lee, Sung, and Jeon Citation2019). To test the effect of FC in our context, the following hypothesis is proposed:
Hypothesis 4 Facilitating conditions (FC) have a positive influence on customer behavioural intention (BI) to adopt an express delivery service for last-mile delivery.
4. Methodology
A five-year longitudinal survey was undertaken in the UK from 2015 to 2019, using a questionnaire designed to verify the proposed UTAUT2-based research model. The questionnaire had some minor revisions in earlier years ( 2015–2016), i.e. some measurement items were removed or rephrased (the meaning remains unchanged) due to their weak relevance or misunderstanding by respondents. We only introduce the final and stable version of the questionnaire as follows and all the analyses in this paper are based on it. All the questionnaires were answered on a one-to-one and face-to-face basis on papers or tablets by the respondents who were targeted randomly by us at different UK national events over the years. The respondents were from all over the country. The collected responses were then coded to store in spreadsheets.
4.1. Questionnaire design
In our questionnaire, the measurement items designed for the five constructs, PEDS, PEDR, EE, FC and BI, are adapted from the validated measurements in previous research relevant to the express delivery service, as shown in . All measurement items except BI1 are scored on the five-point Likert scale, ranging from 1 = ‘strongly disagree’ to 5 = ‘strongly agree’. BI, as the dependent variable, is a dichotomous variable coded as 0 = ‘no’ and 1=‘yes’. The descriptive statistics, i.e. mean, standard deviation and relative frequency of the constructs can be found from .
Table 2. Measurement items.
Table 3. Descriptive statistics of constructs.
4.2. Demographics of respondents
lists the different UK national events during which our questionnaire was answered, and shows the demographic characteristics of the respondents. In total, 3964 responses to the questionnaire were collected over the 5 years.
Table 4. Five-year samples (N=3964).
Table 5. Demographics of respondents.
5. Results
In this section, the reliability, validity, multicollinearity and nonparametric tests of the research model with measurement items are verified and the hypotheses are tested. The IBM SPSS Statistics version 26 was used as the analysis software to examine the data.
5.1. Reliability and validity analyses
In order to analyse the reliability of the measurement items designed in the questionnaire for the research model, Cronbach's Alpha (Cronbach Citation1951) is calculated for each construct, as shown in . Of the constructs, PEDS, EE and FC have high ( alpha
) to moderate (
alpha
) levels of reliability, while PEDR shows a comparatively low (alpha
) reliability (Hinton, McMurray, and Brownlow Citation2014). BI has no Cronbach's Alpha value because it has only one measurement item. It is worth noting that each of the constructs PEDS, PEDR, EE and FC has only two to three measurement items, thus leading to relatively low Cronbach's Alpha values. However, the low alpha values do not necessarily indicate unsatisfactory construct, as slightly increasing the number of measurement items could lead to higher alpha values (Taber Citation2018). Schmitt (Citation1996) has also suggested that there is no general level where alpha becomes acceptable, but rather that the constructs with low alpha values can still prove useful in some cases. Thus, in this paper, we accept the alpha values as shown in .
Table 6. Reliability analysis.
In addition, exploratory factor analysis (EFA) is conducted to evaluate the construct validity of the questionnaire. According to the rotated component matrix from EFA (see ), four components can be extracted from the questionnaire. For instance, measurement items PEDS1 and PEDS2 should be grouped into the same component, i.e. component 1, as the corresponding factor loadings are 0.867 and 0.882 (> 0.5 with significance). Similarly, FC1, FC2 and FC3 should be grouped into component 2, as the corresponding factor loadings are 0.634, 0.671 and 0.795; EE1 and EE2 should be grouped together, depending on the factor loadings 0.907 and 0.709; and finally PEDR1 and PEDR2 should be grouped, owing to the factor loadings 0.772 and 0.678. It can be seen that the number of extracted components, as well as the measurement items under each one, are completely aligned with the proposed constructs. Moreover, the eigenvalues of the four components are larger than 1 and the cumulative total variance explained is 68.2%. These verify the validity of the proposed model and questionnaire.
Table 7. Rotated component matrix from EFA.
5.2. Multicollinearity diagnostics
The collinearity diagnostics is conducted for the constructs PEDS, PEDR, EE and FC. The statistics results are shown in . Since each construct's tolerance is larger than 0.1 and variance inflation factor (VIF) is less than 10, they indicate that there does not exist multicollinearity among the constructs. It assures that each construct in the model is statistically unique.
Table 8. Collinearity statistics.
5.3. Nonparametric tests
We did a five-year longitudinal survey from 2015 to 2019 in the UK. Although we test the hypotheses based on the five-year data as a whole, we can also take a closer look at whether there are significant differences in each construct year by year. Due to the non-normality of each construct in all years, the nonparametric tests are carried out to check the differences.
The K-independent-samples nonparametric tests, regarding each year's data as a group, are performed for all the constructs. The results show statistically significant difference between the five years as the asymptotic p<.05. It triggers further two-by-two comparisons. The two-independent-samples nonparametric tests, more specifically the Mann–Whitney U tests are conducted for any two years among 2015 and 2019. The asymptotic p values of the five constructs can be found from Tables , respectively. The p<.05 (in bold) indicates that the difference between the two years is statistically significant, while p>.05 implies that the difference is insignificant. It can be seen that EE has less significant difference between years than the other four constructs.
Table 9. Asymptotic p values of nonparametric tests (two independent samples) for PEDS.
Table 10. Asymptotic p values of nonparametric tests (two independent samples) for PEDR.
Table 11. Asymptotic p values of nonparametric tests (two independent samples) for EE.
Table 12. Asymptotic p values of nonparametric tests (two independent samples) for FC.
Table 13. Asymptotic p values of nonparametric tests (two independent samples) for BI.
5.4. Hypothesis testing
Binary logistic regression is adopted to test the proposed Hypotheses 1–4. First, the overall test of the model takes place via the omnibus tests of model coefficients. It confirms that the research model is statistically significant because p<.001. Then, the regression output shows that the overall percentage of cases that are correctly classified by the model is 91.7%. Since the pseudo- values obtained from logistic regression are not equivalent to
, it is suggested to use them with extreme caution (Baguley Citation2012). Thus we omit the analysis of pseudo-
here.
The hypothesis testing results are shown in . It can be concluded that PEDR positively affects BI ( ), therefore Hypothesis 2 is supported. Exp
, which represents the odds ratio for PEDR, implies that, keeping all other independent variables constant, for every unit increase in PEDR, the probability of a customer's express delivery service adoption increases by 22.7%. What is beyond our expectation is that the relationships between PEDS and BI, as well as EE and BI, are statistically insignificant (p>.05 ), leading to Hypotheses 1 and 3 being unsupported. In terms of FC, it has a negative influence on BI rather than a positive one (
), thus making Hypothesis 4 unsupported. The exp
value reveals that for every unit increase in FC, the probability of a customer's express delivery service adoption decreases by 37.7%, keeping all other independent variables constant. The results of the hypothesis testing are correspondingly illustrated in the research model, as displays.
Figure 2. Research model results.
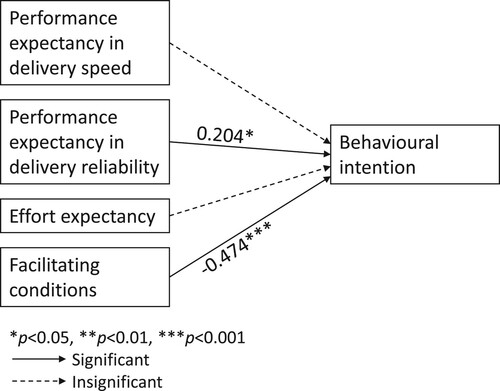
Table 14. Hypothesis testing.
6. Discussion
This section further discusses the results of the hypothesis testing and the possible reasons behind. The delivery speed and reliability are, for the first time, defined in our paper as separate constructs (i.e. PEDS and PEDR), suggesting that the performance expectancy of the express delivery service should be seen as two different focuses in the UTAUT2-based model. The different results for Hypotheses 1 and 2 exactly justify the necessity of these new definitions. The insignificant influence of PEDS on BI is contrary to our intuition, while PEDR is proven to have a positive impact on BI. This reflects the notion that customers who shop online regard the performance of delivery reliability, rather than delivery speed, as an important factor when they decide whether to use an express delivery service.
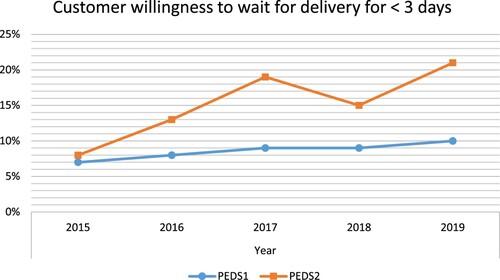
With respect to the delivery speed, some year-on-year trends can be inferred from the five-year longitudinal survey, as shows. Over the past five years, more and more customers have preferred fast delivery, especially for high-value goods. Despite this trend, it does not affect the customer decision on the adoption of an express delivery service. On this basis, the Kano model (Kano Citation1984; Sauerwein et al. Citation1996) can be used to explain the phenomenon. PEDS could be considered as an attractive requirement as the Kano model classifies – it does not cause dissatisfaction or change in customer BI if not met (i.e. slow delivery), but provides great satisfaction when entirely fulfilled (i.e. fast delivery).
Figure 3. Customer willingness to wait for delivery for fewer than 3 days.
When looking at delivery reliability, a better performance of receiving the purchased goods ‘at the right time, at the right place’ essentially makes customers more willing to choose the express delivery service. PEDR could be seen as an one-dimensional requirement in the Kano model, as customer BI is proportional to the fulfilment level in PEDR; i.e. the higher the delivery reliability, the higher the customer BI, and vice versa. We see the same emphasis on the 2 key factors of ‘at the right time, at the right place’ in the interviews with 24 LML service providers (conducted as part of the longitudinal survey) when it comes to delivery reliability, which is a strong support of evidence from the other party involved in express delivery.
From the validation of Hypothesis 3, we find that no matter whether the ease of customers using an express delivery service increases or not, it does not impact the service adoption. This aligns with the insignificant results from a large number of related works on other last-mile delivery services (Lee, Sung, and Jeon Citation2019; Kapser and Abdelrahman Citation2020; Zhao and Bacao Citation2020). Although online shopping platforms may provide a variety of delivery options for customers to choose from, e.g. same-day delivery, 1-day delivery, weekend delivery, etc., this will not dictate customers' choice of express delivery service.
The testing of Hypothesis 4 yields the result that customers' perceptions of the resources and support have an influence on whether they use an express delivery service; however, it is a negative one. It deviates from either the positive (Kapser and Abdelrahman Citation2020; Zhou et al. Citation2020) or insignificant results (Lee, Sung, and Jeon Citation2019) obtained from previous studies. This may be because the support and information given or updated by online shopping and last-mile delivery platforms, like text messages for delivery tracking, return services or separate delivery fees, are not necessarily better because there are more of them or they are more diverse. Customers appreciate high-quality additional support. Currently however, it is often of unstable quality due to insufficient coordination, such as imprecise estimated time windows of arrival, hidden complexities in return procedures or inconsistencies between the delivery fees and the promised services they correspond to. This leads to customers being reluctant to select an express delivery service with a lot of potential uncertainties in additional support, and means they are more likely to go for a more conservative basic service with stable quality. This reflects customers' desire for quality rather than fancy service.
7. Implications and conclusions
This section looks into theoretical and managerial implications, and draws conclusions from the paper.
7.1. Theoretical implications
The different influences of delivery speed and reliability on customers' intention to adopt an express delivery service argue for the need to distinguish between them while evaluating the delivery performance. Future studies could identify more comprehensive segmentations of delivery performance, namely, more differentiated independent constructs to present the delivery performance of express services (Allen et al. Citation2018; Mangiaracina et al. Citation2019; Ignat and Chankov Citation2020; Premkumar, Gopinath, and Mateen Citation2020) or other last-mile delivery scenarios (Boysen, Fedtke, and Schwerdfeger Citation2020; Cai and Lo Citation2020). When taking a closer look at the construct delivery reliability, in addition to the measurement items of timeliness and correctness of shipping location covered in this paper, future studies could consider more factors in questionnaires, such as intactness and correctness of product, etc.
Since we developed the conceptual model based on UTAUT2 and the original UTAUT2 examined mediating and moderating effects, future studies could also investigate any factors that mediate or moderate the relationships between various delivery performance indicators and customers' intentions.
The five-year longitudinal survey not only allowed us to obtain more reliable results globally, but could also allow future studies to observe year-to-year trends. In particular, fast-changing data and interesting results could be expected from different countries in COVID-19 and post-COVID-19 phases, to reposition focuses on delivery criteria that influence the customer's intention (Liu et al. Citation2020).
7.2. Managerial implications
The key findings from the hypothesis testing are not so compatible with the intuition or experience of practitioners (often LML service providers), so they could reshape new guidance on strategies. Unexpectedly, the delivery reliability influences customers' intention to adopt express delivery in a positive way, while the delivery speed does not contribute at all. In this case, in order to achieve higher customer loyalty, practitioners should put more effort into improving delivery reliability, i.e. delivering ‘at the right time, at the right place’, rather than as fast as they can.
In addition, the facilitating conditions have a negative influence on customers' intention, while the effort expectancy has no significant impact. The former reveals the need for practitioners to provide only a few but high-quality additional support services. If the service quality cannot be guaranteed, it is better not to launch the services as a gimmick, otherwise this could be counter-productive and cause customers to stop using the express delivery itself. Similarly, since offering various options to increase the ease of use for customers makes no difference to behaviour intention, the emphasis originally placed on this could be reallocated to other aspects.
7.3. Conclusions
We examined the determinants of customers' usage of an express delivery service for last-mile delivery in this paper. A new conceptual research model with hypothetical effects was built based on UTAUT2. In the model, the delivery speed and delivery reliability indicators were set as two separate constructs for the first time, for the purpose of exploring their potentially different effects. After testing the hypotheses with a longitudinal survey lasting for five years in the UK, we obtained the following valid conclusions with respect to the effects: (i) performance expectancy in delivery reliability has a positive impact on customers' behaviour intention to adopt an express delivery service, while performance expectancy in delivery speed does not show a significant impact; (ii) effort expectancy has no significant impact on customers' behaviour intention, however, facilitating conditions show a negative influence. These statistical findings, to some extent, break the inherently presumed relationships and could trigger a new insight into promoting online shoppers' choice of express delivery service.
Acknowledgments
We acknowledge the Institute of Couriers and all those who participated in the data capture of the five-year longitudinal survey, and for providing access to their expertise. We also thank Prof. Ming Lim and Dr Vaggelis Giannikas for their assistance in the development of this paper.
Disclosure statement
No potential conflict of interest was reported by the author(s).
References
- Allen, J., M. Piecyk, M. Piotrowska, F. McLeod, T. Cherrett, K. Ghali, T. Nguyen, T. Bektas, O. Bates, S. Wise, and M. Austwick. 2018. “Understanding the Impact of E-Commerce on Last-Mile Light Goods Vehicle Activity in Urban Areas: The Case of London.” Transportation Research Part D: Transport and Environment 61: 325–338.
- Anderson, D. L., and H. L. Lee. 2000. “The Internet-Enabled Supply Chain: From the ‘First Click’ to the ‘Last Mile’.” Technical Report.
- Baguley, T. 2012. Serious Stats: A Guide to Advanced Statistics for the Behavioral Sciences. London: Macmillan International Higher Education.
- Boysen, N., S. Fedtke, and S. Schwerdfeger. 2020. “Last-Mile Delivery Concepts: A Survey from an Operational Research Perspective.” OR Spectrum 43: 1–58.
- Cai, Y.-J., and C. K. Lo. 2020. “Omni-Channel Management in the Sharing Economy Era: A Systematic Review and Future Research Agenda.” International Journal of Production Economics 229: 107729.
- Chan, T., Z. Liu, and W. Zhang. 2018. “Delivery Service, Customer Satisfaction and Repurchase: Evidence from an Online Retail Platform.” September 15.
- Chapman, R. L., C. Soosay, and J. Kandampully. 2003. “Innovation in Logistic Services and the New Business Model.” International Journal of Physical Distribution & Logistics Management 33 (7): 630–650.
- Choi, D., C. Y. Chung, and J. Young. 2019. “Sustainable Online Shopping Logistics for Customer Satisfaction and Repeat Purchasing Behavior: Evidence from China.” Sustainability 11 (20): 5626.
- Cronbach, L. J. 1951. “Coefficient Alpha and the Internal Structure of Tests.” Psychometrika 16 (3): 297–334.
- Daugherty, P. J., Y. Bolumole, and S. J. Grawe. 2019. “The New Age of Customer Impatience.” International Journal of Physical Distribution & Logistics Management 49 (1): 4–32.
- Han, Y., and G. Xie. 2019. “Determinants of Customer Perceived Online Shopping Logistics Service Quality Value: An Empirical Study from China.” International Journal of Logistics Research and Applications 22 (6): 614–637.
- Handfield, R. B., and R. T. Pannesi. 1992. “An Empirical Study of Delivery Speed and Reliability.” International Journal of Operations & Production Management 12 (2): 58–72.
- Hinton, P. R., I. McMurray, and C. Brownlow. 2014. SPSS Explained. London: Routledge.
- Huang, W.-H., G. C. Shen, and C.-L. Liang. 2019. “The Effect of Threshold Free Shipping Policies on Online Shoppers' Willingness to Pay for Shipping.” Journal of Retailing and Consumer Services 48: 105–112.
- Ignat, B., and S. Chankov. 2020. “Do E-Commerce Customers Change Their Preferred Last-Mile Delivery Bsed on Its Sustainability Impact?” The International Journal of Logistics Management 31 (3): 521–548.
- IMRG. 2020. “IMRG UK Consumer Home Delivery Review 2019/20.” Technical Report.
- Jain, N. K., H. Gajjar, and B. J. Shah. 2020. “Electronic Logistics Service Quality and Repurchase Intention in E-Tailing: Catalytic Role of Shopping Satisfaction, Payment Options, Gender and Returning Experience.” Journal of Retailing and Consumer Services 59: 102360.
- Jalili Marand, A., H. Li, and A. Thorstenson. 2020. “Competing on Price, Speed, and Reliability: How Does Bounded Rationality Matter?” Journal of the Operational Research Society. doi:10.1080/01605682.2020.1759384.
- Javed, M. K., and M. Wu. 2020. “Effects of Online Retailer After Delivery Services on Repurchase Intention: An Empirical Analysis of Customers' Past Experience and Future Confidence with the Retailer.” Journal of Retailing and Consumer Services 54: 101942.
- Kano, N. 1984. “Attractive Quality and Must-Be Quality.” Hinshitsu (Quality, The Journal of Japanese Society for Quality Control) 14: 39–48.
- Kapser, S., and M. Abdelrahman. 2020. “Acceptance of Autonomous Delivery Vehicles for Last-Mile Delivery in Germany–Extending UTAUT2 with Risk Perceptions.” Transportation Research Part C: Emerging Technologies 111: 210–225.
- Kazancoglu, I., and H. Aydin. 2018. “An Investigation of Consumers' Purchase Intentions Towards Omni-Channel Shopping.” International Journal of Retail & Distribution Management 46 (10): 959–976.
- Kukar-Kinney, M., N. M. Ridgway, and K. B. Monroe. 2009. “The Relationship Between Consumers' Tendencies to Buy Compulsively and Their Motivations to Shop and Buy on the Internet.” Journal of Retailing 85 (3): 298–307.
- Lee, S. W., H. J. Sung, and H. M. Jeon. 2019. “Determinants of Continuous Intention on Food Delivery Apps: Extending UTAUT2 with Information Quality.” Sustainability 11: 3141.
- Liao, T.-H., and C.-J. Keng. 2013. “Online Shopping Delivery Delay: Finding a Psychological Recovery Strategy by Online Consumer Experiences.” Computers in Human Behavior 29 (4): 1849–1861.
- Liu, W., Y. Liang, X. Bao, J. Qin, and M. K. Lim. 2020. “China's Logistics Development Trends in the Post COVID-19 Era.” International Journal of Logistics Research and Applications. doi:10.1080/13675567.2020.1837760.
- Ma, S. 2017. “Fast or Free Shipping Options in Online and Omni-Channel Retail? The Mediating Role of Uncertainty on Satisfaction and Purchase Intentions.” The International Journal of Logistics Management 28 (4): 1099–1122.
- Mangiaracina, R., A. Perego, A. Seghezzi, and A. Tumino. 2019. “Innovative Solutions to Increase Last-Mile Delivery Efficiency in B2C E-Commerce: A Literature Review.” International Journal of Physical Distribution & Logistics Management 49 (9): 901–920.
- Mena, C., M. Bourlakis, J. Bhattacharjya, A. Ellison, and S. Tripathi. 2016. “An Exploration of Logistics-Related Customer Service Provision on Twitter.” International Journal of Physical Distribution & Logistics Management 46 (6/7): 659–680.
- Milioti, C., K. Pramatari, and I. Kelepouri. 2020. “Modelling Consumers' Acceptance for the Click and Collect Service.” Journal of Retailing and Consumer Services 56: 102149.
- Murfield, M., C. A. Boone, P. Rutner, and R. Thomas. 2017. “Investigating Logistics Service Quality in Omni-Channel Retailing.” International Journal of Physical Distribution & Logistics Management 47 (4): 263–296.
- Office for National Statistics. 2020. “Internet Sales as a Percentage of Total Retail Sales (Ratio) (%).” Accessed November 16, 2020. https://www.ons.gov.uk/businessindustryandtrade/retailindustry/timeseries/j4mc/drsi.
- Parcelhub. 2020. “Setting the Innovation Agenda with Proactive Delivery.” Technical Report.
- Premkumar, P., S. Gopinath, and A. Mateen. 2020. “Trends in Third Party Logistics – The Past, the Present & the Future.” International Journal of Logistics Research and Applications. doi:10.1080/13675567.2020.1782863.
- Rodrigues, V. S., D. Stantchev, A. Potter, M. Naim, and A. Whiteing. 2008. “Establishing a Transport Operation Focused Uncertainty Model for the Supply Chain.” International Journal of Physical Distribution & Logistics Management 38 (5): 388–411.
- Saha, S. K., G. Zhuang, and S. Li. 2020. “Will Consumers Pay More for Efficient Delivery? An Empirical Study of What Affects E-Customers' Satisfaction and Willingness to Pay on Online Shopping in Bangladesh.” Sustainability 12 (3): 11–21.
- Sauerwein, E., F. Bailom, K. Matzler, and H. H. Hinterhuber. 1996. “The Kano Model: How to Delight Your Customers.” In International Working Seminar on Production Economics, Innsbruck; Vol. 1, 313–327.
- Schmitt, N. 1996. “Uses and Abuses of Coefficient Alpha.” Psychological Assessment 8 (4): 350.
- Sorkun, M. F., I. Ö. Y. Hüseyinoğlu, and G. Börühan. 2020. “Omni-Channel Capability and Customer Satisfaction: Mediating Roles of Flexibility and Operational Logistics Service Quality.” International Journal of Retail & Distribution Management 48 (6): 629–648.
- Taber, K. S. 2018. “The Use of Cronbach's Alpha When Developing and Reporting Research Instruments in Science Education.” Research in Science Education 48 (6): 1273–1296.
- Vakulenko, Y., P. Shams, D. Hellström, and K. Hjort. 2019. “Online Retail Experience and Customer Satisfaction: The Mediating Role of Last Mile Delivery.” The International Review of Retail, Distribution and Consumer Research 29 (3): 306–320.
- Venkatesh, V., M. G. Morris, G. B. Davis, and F. D. Davis. 2003. “User Acceptance of Information Technology: Toward a Unified View.” MIS Quarterly 27 (3): 425–478.
- Venkatesh, V., J. Y. Thong, and X. Xu. 2012. “Consumer Acceptance and Use of Information Technology: Extending the Unified Theory of Acceptance and Use of Technology.” MIS Quarterly 36 (1): 157–178.
- Xiang, Z., and W. Wu. 2018. “The Willingness to Use the Campus Express Delivery Service Based on UTAUT.” In 2018 5th International Conference on Industrial Economics System and Industrial Security Engineering (IEIS),Toronto, 1–5. IEEE.
- Xiao, Z., J. J. Wang, and Q. Liu. 2018. “The Impacts of Final Delivery Solutions on E-Shopping Usage Behaviour.” International Journal of Retail & Distribution Management 46 (1): 2–20.
- Xu, X., and J. E. Jackson. 2019. “Examining Customer Channel Selection Intention in the Omni-Channel Retail Environment.” International Journal of Production Economics 208: 434–445.
- Yeo, V. C. S., S. -K. Goh, and S. Rezaei. 2017. “Consumer Experiences, Attitude and Behavioral Intention Toward Online Food Delivery (OFD) Services.” Journal of Retailing and Consumer Services 35: 150–162.
- Yoo, W., E. Yu, and J. Jung. 2018. “Drone Delivery: Factors Affecting the Public's Attitude and Intention to Adopt.” Telematics and Informatics 35 (6): 1687–1700.
- Yuen, K. F., X. Wang, F. Ma, and Y. D. Wong. 2019. “The Determinants of Customers' Intention to Use Smart Lockers for Last-Mile Deliveries.” Journal of Retailing and Consumer Services 49: 316–326.
- Yuen, K. F., X. Wang, L. T. W. Ng, and Y. D. Wong. 2018. “An Investigation of Customers' Intention to Use Self-Collection Services for Last-Mile Delivery.” Transport Policy 66: 1–8.
- Zhao, Y., and F. Bacao. 2020. “What Factors Determining Customer Continuingly Using Food Delivery Apps During 2019 Novel Coronavirus Pandemic Period?” International Journal of Hospitality Management 91: 102683.
- Zhou, M., L. Zhao, N. Kong, K. S. Campy, G. Xu, G. Zhu, X. Cao, and S. Wang. 2020. “Understanding Consumers' Behavior to Adopt Self-Service Parcel Services for Last-Mile Delivery.” Journal of Retailing and Consumer Services 52: 101–911.