
 ?Mathematical formulae have been encoded as MathML and are displayed in this HTML version using MathJax in order to improve their display. Uncheck the box to turn MathJax off. This feature requires Javascript. Click on a formula to zoom.
ABSTRACT
This study aims to explore how cross-border e-commerce (CBEC) enterprises achieve a desired balance state of supply chain resilience and vulnerability. This study proposes the concept of the balance state of supply chain resilience and vulnerability, which refers to the proximity of the current balance state of the supply chain to the ideal one and the anti-ideal one. To evaluate the balance state, a model is constructed using the integrating fuzzy Analytic Hierarchy Process (AHP) and the fuzzy Technique for Order of Preference by Similarity to Ideal Solution (TOPSIS) methods, which holistically consider the drivers of the resilience and vulnerability of the cross-border e-commerce supply chain (CBECSC). An empirical study is included in this paper to demonstrate how the proposed model works. The empirical results suggest that the CBECSC should maintain resilience and vulnerability in an appropriate balance state instead of pursuing either (high) resilience or (low) vulnerability without considering the other.
1. Introduction
With the growth of global trade, cross-border e-commerce (CBEC) has shown a solid momentum of stable and rapid development (Wang et al. Citation2018). It still faces several obstacles, such as tariff barriers, unreliable and lengthy transport times, and complex and almost impossible return processes (Van Heel, Lukic, and Leeuwis Citation2014). CBEC business features small amount, high frequency, and cross-border delivery (Wang et al. Citation2015). This leads to more complexities such as the conflict between small amount purchase and continuous supply, complicated customs declaration, and long delivery time. These factors make the cross-border e-commerce supply chain (CBECSC) more complex than the traditional supply chain. In addition, the numbers of natural disasters (e.g. hurricanes, earthquakes, and tsunamis strike) and man-made disasters (e.g. accidents, trade conflicts, wars, and strikes) that affect supply chains have been increasing. There is a belief that global supply chains are suffering from unexpected accidents, leading to the disruption of supply chains, which impacts their efficiency (Bogataj and Bogataj Citation2007; Mentzer, Myers, and Stank Citation2006; Tang Citation2006; Pettit, Croxton, and Fiksel Citation2013; Kaur and Singh Citation2020). Due to the complexity of the business, the CBECSC seems to be more vulnerable to constant changes of the global economic, business, and political environments. To maintain the continuity of supply chains, CBECSC managers need to improve supply chain resilience (SCR), weaken supply chain vulnerability (SCV) against supply chain disruptions, and strike a balance between SCR and SCV because of limited resources.
In fact, SCR and SCV are different dimensions with multiple influences. For example, increasing SCR can help enterprises reduce risks so that they can quickly recover after a disruption. However, increasing SCR may increase SCV (or other risks) to enterprises to some extent. For instance, establishing multiple decentralised factories would increase financial risks. Generally, the more resilient the supply chain, the more quickly the supply chain will recover from disruption. Nevertheless, managers should not endlessly pursue higher resilience because improving resilience means investing large amounts of resources and requires upstream and downstream enterprises to work together, which bring new risks. This value cannot be recognised until a supply chain disruption or risk occurs. Additionally, these resources may affect the financial performance of enterprises (Slone, Mentzer, and Dittmann Citation2007). Different CBECSC enterprises are in different stages of development and operating environments. A unilateral evaluation is not suitable for CBECSC management. Hence, CBECSC enterprises need to achieve a desired balance state between resilience and vulnerability (BSRV). Identifying the BSRV would cause managers to have a better understating of the stability of the supply chain and help firms be more economically sustainable (Pettit, Croxton, and Fiksel Citation2013). Compared with improving SCR or reducing SCV unilaterally, this decision-making approach is more scientific and effective, enabling enterprises to invest resources where they are most needed, avoid misallocation of resources, and reduce inputs into SCR construction or SCV risk control of the supply chain.
In practice, there exist some real-life examples. One example is the face mask supply chain during the COVID-19 epidemic in 2020. When the COVID-19 first broke out, the shortage of mask posed challenges to the supply chain (Armani et al. Citation2020; Lee et al. Citation2020). In the initial phase of the epidemic, the sudden huge demand makes the supply chain vulnerable, and many mask manufacturers were unable to obtain the raw materials to maintain production, facing the risk of disruption. While some manufacturers stockpiled large quantities of high-priced raw materials, making their supply chains much more resilient for dealing with disruptions. However, as the epidemic stabilised subsequently and supplies increased, the demand for masks was met, and then the price gradually fell. The manufacturers hoarding expensive raw materials faced big losses. Therefore, mask manufacturers need to ensure that the supply chain should maintain an appropriate balance state between resilience and vulnerability, i.e. the BSRV. For one thing, it needs to reduce vulnerability, maintain a certain safety stock to avoid production disruption. For another, it is also necessary to increase resilience, enhance more control over the upstream and downstream of the supply chain for restoring production faster once disruption occurs. This requires managers to choose appropriate measurement tool to evaluate, improve and achieve the desired BSRV.
Existing literature (e.g. Christopher and Peck Citation2004; Ponomarov and Holcomb Citation2009; Ponis and Koronis Citation2012; Wagner and Bode Citation2006) on SCR and SCV is informative and focusses primarily on theoretical concepts of the phenomenon. Some studies (Wagner and Neshat Citation2010; Soni, Jain, and Kumar Citation2014; Kurniawan et al. Citation2017; Chowdhury, Quaddus, and Agarwal Citation2019) present the importance of SCR and SCV from the perspective of empirical studies. In addition, several actual cases demonstrate that SCR and SCV are crucial to maintaining the continuity of the supply chain. However, previous studies focusing on SCR or SCV independently do not provide adequate information for managers to make informed and balanced decisions. Especially in the CBECSC, considering the complexity of its activities, such a single-dimensional measurement cannot adapt to the development of CBEC. It is frequently stated that ‘if you cannot measure it, you cannot manage it'. Measurement of the BSRV is necessary. Only in this way can enterprises estimate the balance state prior to and after implementing management measures, re-examine the level of the balance state, and track this level over time. We believe that this approach would be conducive to making effective management decisions in the different development stages of a CBECSC enterprise. Nevertheless, studies on this issue are still scarce, leaving a research gap that needs to be filled. Thus, motivation for this study was to propose an approach to estimate the BSRV in the CBECSC. An analytical framework that evaluates the BSRV of the CBECSC is established, which is possibly the first attempt to investigate the BSRV in the CBECSC field.
The remainder of this paper is organised as follows. In Section 2, related research studies are reviewed. Section 3 describes the proposed approach for estimating the BSRV. Then, the proposed approach is further illustrated through an empirical study in Section 4. Section 5 discusses the implications of the proposed approach for theory and practice. Conclusions and limitations are summarised in Section 6.
2. Literature review
This section provides an elaboration on two streams of relevant literature: cross-border e-commerce supply chain and supply chain resilience and vulnerability.
2.1. Cross-border e-commerce supply chain
CBEC can be defined as the process of selling products to a consumer located in a foreign country by means of online channels (Giuffrida et al. Citation2017). It is a certain kind of international business activity executed by trade entities that belong to disparate customs territories. In CBEC, deals are concluded, electronic payments are settled via e-commerce platforms, and goods are delivered by a cross-border logistics service (Fingar Citation2000; Kauffman and Walden Citation2001; Hameri and Hintsa Citation2009). CBECSC can be regarded as an organisation form that is led by core enterprises, aiming to meet cross-border e-commerce customer needs via collaboration with supply chain partners, involving in the whole process of product design, procurement, production, sales and service (Liu, Dou, and Yang Citation2021). Compared with the general supply chain, CBECSC is special with several characteristics such as cross-border deals and logistics, more complex structure.
As a new trade model, CBECSC is attracting more attention from academics. Kawa (Citation2017) developed a model to promote cooperation between online shops dealing with CBEC activities. Shi, Wang, and Alwan (Citation2020) proposed a new data-driven approach to manage CBECSC inventory in overseas warehouses. Liu and Li (Citation2020) provided a new tool to solve the product traceability problem in CBECSC based on Blockchain technology. Although the research on CBECSC has made some progress, the BSRV problem has still not been explored, which is worth paying attention to.
2.2. Supply chain resilience and vulnerability
SCR can be defined as ‘the adaptive capability of the supply chain to prepare for unexpected events, respond to disruptions, and recover from them by maintaining continuity of operations at the desired level of connectedness and control over structure and function' (Ponomarov and Holcomb Citation2009). Supply chain disruptions refer to ‘unplanned events that may occur in the supply chain might affect the normal or expected flow of materials and components' (Svensson Citation2001). Numerous scholars have carried out theoretical research and put forward many valuable viewpoints of SCR. For instance, Christopher and Rutherford (Citation2004) argue that a resilient supply chain is certainly robust and must also be adaptable. Gu, Yang, and Huo (Citation2021) hold the view that the application of information technology between suppliers and customers can improve SCR and supply chain performance.
Some studies focus on the measurement of SCR. Datta, Christopher, and Allen (Citation2007) proposed an agent-based computational framework to improve operational resilience by considering demand variability, production, and distribution capacity. Similarly, Tan, Cai, and Zhang (Citation2020) proposed a simulation model considering operational behaviours to capture disruption-recovery dynamics to analyse SCR. This study analysed a supply chain network structure, designed mitigation strategies to build redundancy, and developed contingency strategies for recovering the affected network. These two studies use the simulation model with parameters to simulate the state of the supply chain before a disruption, the response to the disruption and recovery from the disruption, making many contributions to the quantitation of SCR. However, there are still some limitations. For example, the parameter setting in the simulation method will affect the evaluation results. In addition, Soni, Jain, and Kumar (Citation2014) developed an interpretive structural modelling approach by using graph theory to measure resilience via a single numerical index; their measure considered major enablers of resilience and their interrelationships. Similarly, based on graph theory, a conceptual model of a supply chain network considering the relationships between plants and materials was proposed by Tan, Zhang, and Cai (Citation2019) to quantify structural redundancy for SCR. These two articles construct a network of SCR elements based on graph theory, according to the degree of inheritance of elements and the interactions among them to evaluate SCR. This method depends on the relationship between elements but ignores the current performance of elements. In this study, we propose a comprehensive fuzzy AHP and fuzzy TOPSIS method to estimate SCR that takes the ideal solution of every evaluated object as the reference point in the measurement.
SCV can be defined as ‘a function of certain supply chain characteristics and that the loss a firm incurs is a result of its supply chain vulnerability to a given supply chain disruption' (Wagner and Bode Citation2006). Jüttner, Peck, and Christopher (Citation2003) believe that new approaches need to be developed to track SCV in supply chain risk management. Previous studies on SCV issues are performed at different levels, including the economic system, the industry, and the specific supply chain. McKinnon (Citation2006) analyses the vulnerability of the UK economy under a temporary disruption of road freight transportation in the country and illustrates that individual enterprises can do little to weaken this vulnerability. Wagner and Neshat (Citation2010) and Hendricks and Singhal (Citation2005) both indicate that various industries are influenced differently by supply chain disruptions.
For the measurement of SCV, Bogataj and Bogataj (Citation2007) used the frequency space to measure supply chain risk and vulnerability through a parametric linear programming approach. Neureuther and Kenyon (Citation2009) constructed a model of risk, called the risk assessment index, to evaluate the vulnerability of different supply chain structures. These works evaluate supply chain risk for quantifying SCV. In addition, Wagner and Neshat (Citation2010) used graph theory to measure supply chain vulnerability with the consideration of ten drivers. Blackhurst et al. (Citation2018) developed a network approach-based visualisation and clustering analysis to assess the vulnerabilities of a supply chain network. These studies develop a directed graph of SCV elements to calculate SCV. It also depends on the relationship between elements but neglects the impact of risk. Hence, we believe that direct risk assessment may be a more effective way to assess SCV. Following Bogataj and Bogataj (Citation2007), Neureuther and Kenyon (Citation2009), this study measures SCV from the perspective of supply chain risk based on fuzzy AHP and fuzzy TOPSIS.
In the literature, there is some controversy about SCR and SCV. Some academics emphasise that supply chain risk management (SCRM) aims to increase SCR (Sheffi Citation2005; Rao and Goldsby Citation2009). However, other scholars believe that reducing SCV is the main target of SCRM (Jüttner, Peck, and Christopher Citation2003). These two perspectives seem reasonable but are not identical. For example, SCRM does not necessarily reduce SCV and improve SCR at the same time. More specifically, increasing SCR does not necessarily impair SCV at the same time, and vice versa. Likewise, a supply chain with high SCV may have high or low SCR (Jüttner, Peck, and Christopher Citation2003). In practice, the effort of mitigating one type of disruption (equivalently improving SCR) may initiate another disruption elsewhere (equivalently increasing SCV) (Spiegler, Naim, and Wikner Citation2012). For instance, increasing inventory may not shift production in a timely manner, and a decentralised supplier network may affect additional complexities of logistics and delivery. Theoretically, an optimal supply chain should have the highest SCR and lowest SCV. However, this optimal situation of SCR and SCV may not exist in practice for various reasons. Therefore, we propose that SCR and SCV should be maintained at relatively reasonable levels, that is, a satisfactory balance state for supply chain managers.
In the CBEC field, since products need to be delivered across borders, the interaction process among buyers, sellers, platforms and third-party service providers become more complex (Koh, Fichman, and Kraut Citation2012). There exist many potential risks and uncertainties such as natural disasters, tariff policy, confiscation risk, political crisis, delivery risk, and after-sales service uncertainty and so on, which may impact the operation of CBECSC (Chiu et al. Citation2014; Liu, Dou, and Yang Citation2021). This brings great challenges to SCR and SCV management. Therefore, how to achieve the desired balance state of SCR and SCV at a reasonable cost becomes a key issue for CBECSC enterprises.
Some studies have drawn great attention to the SCR of CBEC. For example, Liu, Dou, and Yang (Citation2021) explored the influencing factors of SCR in the CBEC environment by integrating the fuzzy decision-making and trial evaluation laboratory and interpreted structure model. Regarding the SCV of CBEC, Mou et al. (Citation2017) considered that delivery risk and confiscation risk resulted in the vulnerability of CBEC because of potential shipping and customs-related problems. Du, Li, and Sun (Citation2019) proposed a hybrid risk evaluation method and analysed CBEC small-and-medium-sized enterprises’ risk factor to mitigate supply chain risk. On the whole, these valuable studies have made great progress in CBECSC management. Existing studies investigate SCR or SCV in the CBEC context in isolation. Considering that SCR and SCV are two important dimensions of supply chains, a single-dimensional measurement may not meet the needs of current CBECSC management. Besides, the complexity of CBEC business requires the supply chain to be more resilient and less vulnerable. In practice, due to limited resources, managers may face an important problem: investing resources in improving resilience first or reducing vulnerability first, or both. Therefore, managers need to understand the BSRV to make reasonable decisions instead of unilaterally pursuing the highest resilience or the lowest vulnerability. Additionally, managers need to track the BSRV over a long period to estimate whether it is at the desired level and then adjust resource allocation. However, research on this issue is still scarce.
3. Methodology
First, the concept of the BSRV is proposed in this study. The BSRV can be defined as the proximity value of the current balance state of the supply chain to the ideal one and the anti-ideal one. The ideal balance state can be regarded as the combination of the highest resilience and the lowest vulnerability, expressed mathematically as (1, 0). The anti-ideal balance state can be regarded as the combination of the lowest resilience and the highest vulnerability, expressed as (0, 1). The greater the proximity value, the higher the balance state and the better the supply chain risk mitigation performance. By calculating the BSRV, the information of SCR and SCV can also be obtained. It would be conducive to handling uncertainties and risks to avoid supply chain disruptions.
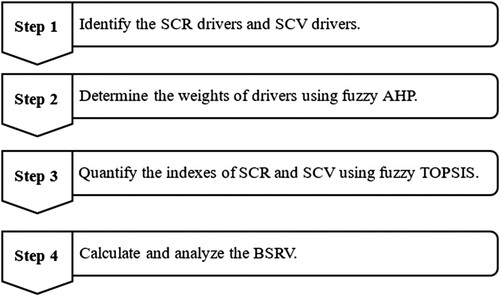
The paper aims to construct a measurement model for evaluating the BSRV of the CBECSC, which depends upon the current state of SCR and SCV. Multi-Criteria Decision Models (MCDM), such as AHP and TOPSIS, are comprehensive decision-making approaches. These two methods can measure variables and identify the best potential decision alternative. Evaluating the current performance of SCR and SCV requires a fuzzy evaluation by industry experts. Thus, considering the performances of SCR and SCV, quantify them and to further calculate the proximity value of the current balance state to the ideal one and the anti-ideal one, an integration method of fuzzy AHP and fuzzy TOPSIS is constructed in this study, as these two methods are appropriate for dealing with the vague measurements given by experts. This method is suitable for supply chain management and has been used in the literature (Samvedi, Jain, and Chan Citation2013; Wang et al. Citation2012; Liu, Dou, and Yang Citation2021). The integrated approach can provide more precise information for measuring the BSRV. The methodology consists of four steps, as shown in . The first step identifies SCR drivers and SCV. The second step assigns the weights of the drivers according to their importance using the Fuzzy AHP method. The third step quantifies the indexes of the SCR and SCV of the CBECSC based on the Fuzzy TOPSIS method. The fourth step focuses on calculating and analysing the BSRV.
Figure 1. The flow of the proposed methodology.
3.1. Identify SCR drivers and SCV drivers in the CBECSC
In this study, ‘drivers' mean the elements influencing SCR and SCV. The resilience and vulnerability of a supply chain themselves cannot be observed directly, but the drivers that determine the level of resilience and vulnerability can be observed directly. For example, Soni, Jain, and Kumar (Citation2014) adopted drivers to measure SCR, and Wagner and Neshat (Citation2010) used drivers to estimate SCV. In this study, we adopted a combination of literature research and expert interviews to determine the drivers of SCR and SCV. In the first round, we collected the drivers of SCR and SCV from existing studies. In the second round, we performed a survey by interviewing six managers from four Chinese CBEC enterprises (Osell, Zongteng, Bizark, and Linca) to identify important drivers. These six interviewees were purposely selected since they were senior and experienced managers responsible for the CBECSC business in their respective companies. Their background information and details of the interviews are presented in . We interviewed three managers during a visit at Osell, one manager during a visit at Zongteng, one manager during a visit at Bizark, and one manager during a visit at Linca. The interviews were conducted in Chinese Mandarin in July and August of 2020, and the average interview time was approximately 30–60 min. We employed a four-part interview protocol (see Appendix 1) to understand: (1) background information of the companies; (2) SCR management and drivers; (3) SCV management and drivers; and (4) the balance state of SCR and SCV. The interviewees were asked to identify important SCR drivers and SCV drivers among the provided drivers or propose new drivers. If a driver was identified by at least four interviewees, then the driver was considered as an important driver that would be adopted in the evaluation process. Through evaluating the drivers, we were able to obtain the SCR index and SCV index and then estimate the BSRV.
Table 1. List of interviewees, their job titles and organisations.
3.1.1. SCR drivers
As mentioned above, SCR is the capability to deal with temporary supply chain disruption. Drivers involve how supply chain readiness, response, and recovery can be implemented quickly. According to the literature, we believe that seven drivers (supply chain agility, supply chain structure, supply chain visibility, information sharing, risk and revenue sharing, geographic distribution, collaboration with supply chain partners) may be important for SCR management. The related supporting literature references are shown in . Although these SCR drivers were originally proposed for the general supply chain, we believe that these drivers may still be suitable for the CBECSC and that they would be further identified by experienced practitioners. The results regarding the SCR drivers from the interview are shown in . The identified SCR drivers in the CBECSC are shown in . Here, we further illustrate these drivers.
Figure 2. Supply chain resilience drivers.
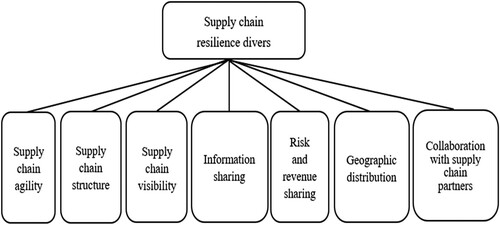
Table 2. SCR drivers and corresponding supporting literature.
Table 3. Survey result about SCR drivers from interviewTable Footnotea.
Agility is defined as the ability of a firm to quickly respond to changes in an uncertain and changing environment in a certain amount of time (Prater, Biehl, and Smith Citation2001). All the interviewees argued that agility would be of significant help to increase the resilience of the CBECSC. Some enterprises in the global business environment face several uncertainties that make them difficult to operate reliably because of their overlong response time to demand change or supply chain disruption. SCR requires high agility to respond quickly to unpredictable events and thus to maintain a competitive advantage in the market. For instance, Jingdong, a leading e-commerce enterprise in China, has established more than 110 overseas warehouses on five continents to meet the demands of consumers quickly and reliably (Wang et al. Citation2018). The interviewees from Osell and Zongteng reported that their companies adopted an overseas warehouse mode to increase SCR. Thus, agility is a key for the CBECSC to survive and recover in a changing and unpredictable environment.
Supply chain network structure significantly determines the impact degree of the disruption, which has been identified to have a crucial impact on SCR (Ivanov Citation2018; Dixit, Verma, and Tiwari Citation2020). Generally, the more complex and dynamic a supply chain is, the more vulnerable it is to disruption (Tang Citation2006). An appropriate supply chain structure can increase resilience (Trkman and McCormack Citation2009). In the interview, all interviewees agreed that supply chain structure had a significant impact on SCR.
Supply chain visibility refers to information processing and display throughout the whole supply chain, which involves all the entities and events regarding end-to-end orders, including design, production, inventory, transportation, distribution, return, and any events occurring in the supply chain (Wei and Wang Citation2010). One interviewee from Osell believed that supply chain visibility could facilitate enterprises to effectively control the whole supply chain. Osell built a visual information system. Chopra and Sodhi (Citation2004) argued that improvement of the visibility of demand information could mitigate supply chain risks. Christopher and Lee (Citation2004) hold a similar view and believe that increasing ‘end-to-end' visibility could simultaneously lower supply chain risks and improve the confidence of supply chain members for maintaining the continuity of the supply chain and preventing over-reactions. Considering that the CBECSC involves various activities in different countries, visibility is conducive to making the supply chain respond to disruptions or emergencies quickly.
Information sharing is crucial in the upstream and downstream of a supply chain. To achieve information sharing, the information community centred on the core enterprise must be established so that supply chain members can exchange information accurately and quickly. Lee, Padmanabhan, and Whang (Citation1997) illustrated that information sharing can significantly mitigate the consequences of the bullwhip effect on a supply chain. In the CBECSC, if information can be shared among upstream and downstream enterprises, then their decisions will no longer be isolated. In this context, supply chain members can make preparation for disruptions or unpredicted accidents together. Different from supply chain visibility, information sharing is not only about the process information of physical orders but also about other more important information, such as sales information, new product research and development, product strategy, etc.
In addition to information sharing, risk and revenue should be shared among supply chain members. The interviewee from Bizark said that risk and revenue sharing could improve the degree of cooperation and trust among supply chain partners so that they can cope with sudden changes together. According to the hypothesis of economic man, supply chain members make decisions based on their optimal revenues. Undoubtedly, revenue is always associated with risk. Accordingly, risk and revenue sharing is a vital factor for long-term collaboration with supply chain partners. In practice, risk and revenue sharing is a kind of constraint and incentive mechanism for supply chain members, which enables the core enterprise to share benefits with its upstream and downstream partners to obtain advantages in the competition with other supply chains (Narayanan and Raman Citation2004). Therefore, risk and revenue sharing mechanism is helpful to improve the SCR of the CBECSC.
The geographic distribution of supply chain members may influence the supply chain’s ability to cope with disruptions. Geographic dispersion prevents a single disruptive event affecting ‘all the entities at the same time and/or with the same magnitude' (Manuj and Mentzer Citation2008), which benefits the supply chain (Pettit, Fiksel, and Croxton Citation2010). Nevertheless, geographic dispersion may also bring new risks, such as longer lead times, transportation delays, increasing supply chain disruption risk (Chopra and Sodhi Citation2004; Christopher and Peck Citation2004). Habermann, Blackhurst, and Metcalf (Citation2015) outlined that co-location with suppliers seems to have beneficial effects on reducing disruption duration. In the interview, the practitioner from Zongteng said that geographic distribution had little effect on the resilience of CBECSC, but clustering or co-locating supply chain entities could enable the supply chain to work closely together and recover more quickly from disruptions, which depended on the core enterprise’s ability to control the supply chain.
Scholten and Schilder (Citation2015) found that collaborative activities between supply chain partners have a positive influence on increasing SCR via increased visibility, velocity and flexibility. Dubey et al. (Citation2020) also argued that collaboration is a strong predictor of the SCR in the humanitarian relief supply chain. Collaboration between supply chain partners can bond all partners to exchange information quickly (Jüttner and Maklan Citation2011). Based on the literature review, it is observed that collaboration among partners provides some benefits, such as higher visibility, which help to enhance SCR. The practitioner from Linca said that collaboration enables partners to trust each other more and respond more quickly when faced with disruption.
Besides, one interviewee from Osell believed that corporate strength was related to SCR. If the core enterprise was well-funded and had many relevant business units, it could mobilise more resources to deal with the supply chain disruption calmly. The interviewee from Zongteng argued that trust among supply chain partners might influence SCR. Trust could promote better cooperation among partners for the sake of long-term goals. Considering that the concept of corporate strength was too large, and that the function of trust is similar to collaboration, and that each driver was proposed by only one interviewee, these two drivers were not included in the evaluation.
3.1.2. SCV drivers
Reducing SCV is an important part of CBECSC management. There is general acceptance that supply chain risk and vulnerability are closely linked (Peck Citation2006; Waters Citation2011). SCV can be predicted by measuring the cost of risk in a supply chain (Bogataj and Bogataj Citation2007). Based on existing studies and our knowledge of the CBECSC, we first considered that twelve drivers (quality risk, delivery risk, suppliers’ dependency, worker strikes, machine failure, risks in global logistics network, sudden demand fluctuation, forecasting error, customers’ dependency, natural and man-made disasters, political instability, exchange rate fluctuation) should be noted in SCV management. The related supporting literature references are shown in . As mentioned, interviewees were also invited to identify important SCV drivers. The results concerning SCV drivers are shown in . Eleven SCV drivers of the CBECSC were identified. Notably, customers’ dependency and political instability were only identified by two interviewees, but tariff policy was proposed by all interviewees because of its significant impact. Most interviewees explained that they have numerous customers and that the effect of political instability on supply chains was much less than tariff policy. Here, we classify these important SCV drivers into four categories from the perspective of supply chain risk management, that is, supply side risks, operation process risks, demand side risks, and environmental risks. The detailed categorisation of SCV drivers is shown in .
Figure 3. Supply chain vulnerability drivers.
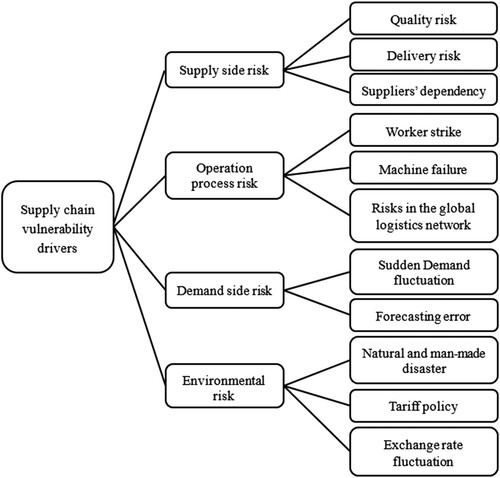
Table 4. SCV drivers and corresponding supporting literature.
Table 5. Survey result about SCV drivers from interviewTable Footnotea.
SCV drivers on the supply side include quality risk, delivery risk, and suppliers’ dependency. One interviewee from Osell said that quality risk should be given top priority in CBECSC management. Quality risk refers to the risk that the materials or products provided by the suppliers may not meet the quality requirements, which may negatively impact the ability of the downstream enterprises to produce products (Samvedi, Jain, and Chan Citation2013). Similarly, delivery risk means that the materials or products provided may not be delivered on time, which may result in either delaying or disrupting the material flow of the supply chain (Vilko and Hallikas Citation2012). In addition, suppliers’ dependency can significantly impact SCV (Wagner and Neshat Citation2010). Dependence on certain suppliers places buying firms in a dilemma if the suppliers cannot meet the purchasing agreements, particularly in single-source procurements (Hallikas et al. Citation2005). A classic example is Robert Bosch and auto manufacturers (Wagner and Bode Citation2006).
The SCV drivers on the demand side are sudden demand fluctuation and forecasting error (Samvedi, Jain, and Chan Citation2013). Several situations, such as market competition, financial situation of customers, and shopping season, lead to a sudden demand fluctuation in the CBECSC. The sudden demand fluctuation leaves a gap between demand and supply, thus inducing a disruption of the supply chain. Furthermore, another SCV driver resides in the process of forecasting customers’ demands. Christopher and Peck (Citation2004) argue that most organisations are forecast-driven rather than demand-driven. The interviewees from Zongteng and Linca both noted that the overseas demand forecasting of their firms was based on past sales. Consequently, if their demand forecasts were way off, then their subsequent decisions might disrupt the supply chain, especially for products with a short life-cycle, such as electrical products.
The SCV drivers in the operation process include worker strikes, machine failures, and risks in the global logistics network. It is easy to understand that worker strikes and machine failures can influence production, which may induce supply chain disruptions. An example is the strike in a General Motors plant in the USA in 2019, halting the production of cars for 40 days. Another important aspect is the risks in the global logistics network. The interviewee from Linca emphasised that the CBECSC generally involves multiple entities in multiple countries and requires an efficient global logistics network (including transportation, customs clearance, storage, and distribution) to link these activities to meet the demands of consumers in a timely manner. Once problems arise in the logistics network, they are likely to disrupt the whole supply chain.
Furthermore, the SCV drivers of the CBECSC are also related to natural and man-made disasters, tariff policy, and exchange rate fluctuation. These factors belong to environmental risks, sharing one commonality: any supply chain can only passively face the occurrence of disasters or a change in tariff policy and exchange rate. The impact of disasters on SCV has been addressed in the literature (Craighead et al. Citation2007). All the interviewees noted that tariff policy had impacted CBECSC operations in recent years. They gave an obvious example of the change in the tariff policy caused by the US–China trade war. For the CBECSC, exchange rate fluctuation is also an important SCV driver. For instance, the fluctuation in the exchange rate between the RMB and the pound was influenced by Brexit.
3.2. Fuzzy AHP for measuring weights
The AHP method has been applied in various situations extensively reported in the literature since it was proposed by Saaty in the 1970s (Dağdeviren, Yavuz, and Kılınç Citation2009). To better solve the problem of dealing with subjective assessments, fuzzy AHP was developed by combining AHP and Fuzzy set theory. The basic concepts and principles of Fuzzy set theory are provided in Appendix 2. Fuzzy AHP also quickly achieved great acceptance in a host of different decision-making research studies (Chang Citation1996; Junior, Osiro, and Carpinetti Citation2014; Sun Citation2010). This study uses fuzzy AHP to determine the weights of the drivers. First, we assume a committee of s decision-makers, noted as committee D. The relative importance weights of the drivers can be expressed by triangular fuzzy numbers (TFNs). The evaluation problem of the weights of SCR drivers or SCV drivers can be expressed in matrix format as:
(1)
(1) where
are SCR drivers or SCV drivers.
is the fuzzy comparison value of driver i to driver j by committee D. Following Sun (Citation2010), Hsieh, Lu, and Tzeng (Citation2004), and Buckley (Citation1985), by using the geometric mean technique to define the fuzzy geometric mean, the fuzzy weights of each driver can be calculated by formulas (2) and (3).
(2)
(2)
(3)
(3) where
denotes a geometric mean of the fuzzy comparison value of driver i to each driver;
denotes the fuzzy weight of driver i, which can be represented by a TFN,
.
,
and
represent the lower, middle, and upper values of the fuzzy weight of driver i, respectively. To compare the weights of the drivers, the procedure of defuzzification should be employed to determine the best nonfuzzy value, that is, the weight
. Following Hsieh, Lu, and Tzeng (Citation2004) and Sun (Citation2010), the centre of area (COA) method is adopted to calculate the weight
of each driver, which can be obtained by the following equation:
(4)
(4)
3.3. Fuzzy TOPSIS for measuring the SCR index and SCV index
TOPSIS is a multiple-criteria evaluation method used to obtain solutions from specific alternatives. The fundamental principle of TOPSIS is to determine the ideal solution and the anti-ideal solution according to the evaluation criteria. Then, the distances between the alternatives and the ideal solution and the anti-ideal solution can be found. Finally, these distances can be used to calculate the closeness coefficients of the alternatives (Chen and Hwang Citation1992). Generally, the alternative that is closest to the ideal solution and farthest from the anti-ideal solution is regarded as the optimum. However, traditional TOPSIS has a limitation of not being able to dispose of vague assessments. To address this problem, Chen and Hwang (Citation1992) first merged Fuzzy set theory with TOPSIS to construct fuzzy TOPSIS. Due to this merger, fuzzy TOPSIS is applied to handle various multi-attribute decision-making problems, such as risk assessment (Samvedi, Jain, and Chan Citation2013) and supplier selection (Chen, Lin, and Huang Citation2006). More details about fuzzy TOPSIS can be found in Karsak (Citation2002) and Yong (Citation2006). In this subsection, the proposed approach is used to quantify the SCR index and SCV index of the CBECSC.
In this approach, the distance of each SCR driver and SCV driver between its actual performance and the ideal value (or anti-ideal value) can be calculated. The closeness coefficients and
for each SCR driver and SCV driver for calculating their closeness to the ideal values can be obtained by the formulas given below.
(5)
(5)
(6)
(6) where
represents the fuzzy evaluation value of SCR driver i by committee D;
and
are the ideal value and the anti-ideal value of the SCR driver i, respectively. Likewise,
represents the fuzzy evaluation value of SCV driver i by the committee D;
and
are the ideal value and the anti-ideal value of SCV driver i, respectively. The closeness coefficients are in the range of [0, 1]. Then, by combining the scores with the weights assigned to the drivers, the final SCR index Ir and SCV index Iv can be obtained by the following formulas:
(7)
(7)
(8)
(8)
3.4. Evaluation of the BSRV
According to the above formulas, the SCR index and SCV index can be obtained. The practical balance state of SCR and SCV is denoted as I (Ir, Iv). Generally, the performance of supply chain resilience is opposite to that of vulnerability (Jüttner and Maklan Citation2011). To measure the BSRV, here, we define the ideal balance state and the anti-ideal balance state as and
, respectively, as shown in . Hence, the distances of I (Ir, Iv) from the ideal balance state and the anti-ideal balance state can be calculated. As a result, the BSRV coefficient m can be defined to determine the balance state of resilience and vulnerability, which can be calculated as follows:
(9)
(9)
Figure 4. Illustration of the balance state of resilience and vulnerability.
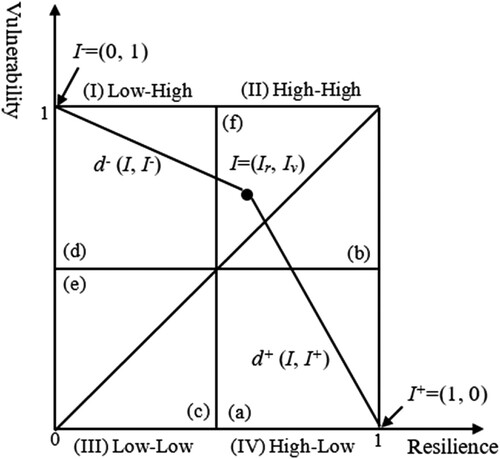
Obviously, m is in the range of [0, 1]. The BSRV reflects the balance state of resilience and vulnerability in the CBECSC. The closer the BSRV is to 1, the closer the balance state of resilience and vulnerability is to the ideal balance state (). The closer the BSRV is to 0, the closer the balance state of resilience and vulnerability to the anti-ideal balance state. To estimate the BSRV of the CBECSC better, we also consider the indexes of SCR and SCV. As shown in , we classify four types, high-high, low-low, low-high and high-low patterns, mapped along the two dimensions: SCR and SCV. The high-low type is illustrated as an example. The high-low type shows a CBECSC with high-value (greater than 0.5) resilience and low-value (less than 0.5) vulnerability. Similar explanations for other types can be obtained.
To further make sense of the findings, we set the threshold value of the BSRV (i.e. the desired balance state) to 0.5 in this study. If the BSRV value is greater than 0.5, then SCR and SCV can be considered to have reached the desired balance state, and vice versa. Notably, this threshold value also can be set to any value between 0 and 1 by the decision maker in practice. Combined with the abovementioned four types, there are six result scenarios, as shown in . Finally, four improving strategies are developed for CBECSC management.
If
and the combination of SCR and SCV belongs to the high-low type, that is, area (a) in , then the CBECSC has reached the desired balance state. It should remain in the balance state and does not need to pursue greater resilience or less vulnerability.
If
If
If
If
If
Table 6. Scenarios and strategies.
Note that although scenarios (2) and (3) have reached the desired balance state, they have evident weaknesses: high vulnerability (greater than 0.5) or low resilience (less than 0.5). If the decision makers intend to further keep or reach a better state in the future, they also need to choose appropriate strategies (decreasing vulnerability first or increasing resilience first) according to the results. The proposed methodology is illustrated using an empirical study in the next section.
4. Empirical study
The proposed approach was applied to calculate the BSRV for a Chinese CBEC enterprise, Osell. It was founded in China in 2009, focusing on providing end-to-end cross-border e-commerce services, including warehousing, international logistics, customs clearance, taxation, and sorting, etc. Osell has grown into one of the largest CBEC enterprises in China, operating more than 20 overseas warehouses and employing approximately 1,000 people worldwide. To accurately evaluate the BSRV of Osell’s CBECSC, a committee of five experts was formed. Three of these experts are senior managers at Osell, and they were also interviewees. Two of these experts are academics in the CBECSC field, and they were the researchers who performed this study. On average, these experts have worked in their positions and fields for more than ten years. The experts all have a quite good understanding of the CBECSC.
First, the weights of the SCR drivers and SCV drivers were assigned by using fuzzy AHP. Considering that a single expert may sometimes give misevaluations, in this study, the committee of five experts was asked to give their final linguistic variables after discussion. The values of the weights were chosen by the committee in the form of linguistic variables, which are defined in . gives the pairwise comparison matrix for the SCR drivers that was formed using the linguistic variables of the committee. The pairwise comparison matrices for the SCV drivers in the hierarchy are represented in . Then, the linguistic variables can be transferred to the corresponding TFNs.
Table 7. Pairwise comparison of SCR drivers in linguistic variables.
Table 8. Pairwise comparison of SCV drivers in linguistic variables.
Second, the SCR index and SCV index were measured based on fuzzy TOPSIS. Here, the SCR index was measured by evaluating the performance of the SCR drivers, and the SCV index was measured by evaluating supply chain risks. Supply chain risks lead to undesired results or consequences (Harland, Brenchley, and Walker Citation2003). A formula for quantifying supply chain risk is widely accepted: Risk = P × I, where risk is the function of the occurrence probability (P) of the risk and the impact (I) of the risk on the supply chain (Manuj and Mentzer Citation2008; Wang et al. Citation2012). In this study, each risk is also measured against two parameters, namely, the probability of risk occurrence and its impact on the supply chain if it occurred. Nine linguistic variables were used to estimate the probability and impact of risk occurrence, namely, Extremely low (EL), Quite low (QL), Low (L), Slightly low (SL), Moderate (M), Slightly high (SH), High (H), Quite high (QH), and Extremely high (EH). Similarly, nine linguistic variables were adopted to evaluate the performance of the SCR driver, namely, Extremely poor (EP), Quite poor (QP), Poor (P), Slightly poor (SP), Moderate (M), Slightly good (SG), Good (G), Quite good (QG), and Extremely good (EG). Following Wang et al. (Citation2012), to specify these linguistic variables, the corresponding TFNs are defined in .
Table 9. Linguistic variables for evaluation.
and present the evaluations of the committee for SCR drivers and SCV drivers and show the results of the SCR index and the SCV index by using Equations (1)–(8), that is, Ir = 0.4431 and Iv = 0.5247, respectively.
Table 10. Result of SCR index.
Table 11. Result of SCV index.
Finally, the BSRV of Osell’s CBECSC was calculated and analysed. According to EquationEquation (9)(9)
(9) , the BSRV coefficient, m, was calculated as 0.4592. In summary, Osell’s CBECSC has a BSRV value of 0.4592, with an SCR index of 0.4431 and an SCV index of 0.5247, belonging to the low-high type. This means that Osell’s CBECSC has not reached the desired BSRV, and there exists an improvement potential of 0.5408. If not given more attention, then the CBECSC may become less resilient and more vulnerable. When a supply chain disruption or risk occurs, the situation of Osell’s CBECSC may move to an undesirable status. The measurement of the BSRV provides managers with information to understand the state of the supply chain and guidelines to make improvements in supply chain management. According to the findings, Osell should take the fourth strategy to improve BSRV, that is, focus on improving SCR and reducing SCV together. If the improvement strategy does not emphasise this point, then it may lead to resource misallocation, ultimately resulting in resource waste and unsatisfactory improvement effectiveness. Therefore, the evaluation of the BSRV can be conducive to understanding the status quo of supply chain and realising the desired BSRV with limited resources in the supply chain management.
The evaluation results were provided to the Osell managers. The managers thought that the results were significant and in line with the reality of the CBECSC. The evaluation of the BSRV of the CBECSC provides more information, which is conducive to improving supply chain management. Managers can examine the total level of SCR and SCV and implement different improvement strategies. The enterprise should take measures to allocate resources to improve the crucial SCR drives or SCV drives based on the findings obtained, which can be regarded as a warning signal for supply chain management. For instance, the scores presented in can be a starting point for enhancing the resilience of the CBECSC. For SCR, the CBECSC has some room for improvement, at 0.5509. Particularly, Osell should strengthen the performance of supply chain agility and risk and revenue sharing. Although these two drivers have higher scores (0.1320 and 0.0618, respectively), this is because they have greater weights (0.3521 and 0.2473, respectively). Actually, their closeness coefficients are lower (0.3750 and 0.2500, respectively), which means they are further from the ideal performance compared with other drivers. Thus, these drivers have more potential for improvement. Likewise, the scores presented in can be the starting point for monitoring and reducing SCV. For SCV, the lower the SCV index, the better. The CBECSC has an improvement potential of 0.5247. Particularly, Osell should focus on reducing the risks of quality and logistics as these two drivers have higher scores of 0.2880 and 0.0566, respectively. The risk management team can start dealing with the sources of high risks immediately according to the descending order of the scores. Furthermore, managers can measure and track the level of BSRV regularly to understand the management status of CBECSC resilience and vulnerability.
5. Implications for theory and practice
The evaluation model and empirical results provide researchers and practitioners with a better understanding of the balance state of SCR and SCV in China’s CBEC industry. The implications of this study for theory and practice are considered in the section.
5.1. Implications for theory
This study contributes to the SCRM literature by proposing a theoretical framework to address the balance issue of SCR and SCV. Some existing studies confirmed the importance of SCR and SCV independently (Soni, Jain, and Kumar Citation2014; Wagner and Neshat Citation2010). The proposed framework fills the gaps by constructing the linkages between SCR and SCV, extending the research of Pettit, Croxton, and Fiksel (Citation2019), which focuses on the firm’s balance issue of vulnerability and capability. The contribution of this paper is the notion that the CBECSC should achieve and maintain a desired BSRV, instead of pursuing either (high) resilience or (low) vulnerability without considering the other. Compared with existing studies focusing on a single-dimension evaluation of the supply chain, this paper may go one step further by exploring the balance issue with the consideration of SCR and SCV simultaneously. Consequently, we believe that it would provide theoretical insights on supply chain management.
With the developing of CBECSC, increasing attention has been drawn to extending resilience and vulnerability to the CBEC field (Liu, Dou, and Yang Citation2021). An example of estimating the BSRV in the CBECSC is provided in this study. The evaluable index system is established based on drivers in the CBECSC. These drivers are collected from related literature and then verified by practitioners in the survey, combining the knowledge of academics and industry experts. The framework and example provide guidelines for the measurement of BSRV in the CBECSC, which also contributes to CBEC literature.
Furthermore, this study constructs a simple evaluation method helping enterprises examine the BSRV and make decisions accordingly. Some studies use graph theory (Soni, Jain, and Kumar Citation2014; Wagner and Neshat Citation2010), simulation model (Munoz and Dunbar Citation2015), network method (Blackhurst et al. Citation2018) to measure SCR or SCV. For practitioners, these methods are too complex to implement. Additionally, these works do not consider the balance issue of SCR and SCV. The model proposed in this study is based on fuzzy AHP and fuzzy TOPSIS, which is easy to apply. It can enable enterprises to have a better understanding of the state of the supply chain: the degrees of SCR and SCV and how far they are from the desired balance state. The approach further aids enterprises in adjusting measures under differing conditions, focusing on increasing SCR, decreasing SCV, or both. The effectiveness of this approach has been proved by the empirical case, offering methodological insights for supply chain management.
5.2. Implications for practice
First, CBEC enterprises need to strengthen the construction and evaluation of the supply chain from two aspects: SCR and SCV. The unilateral evaluation has not adapted to the development of the current CBECSC. This paper evaluated and analysed the BSRV of a specific CBECSC, and the results show that supply chain management is not simply a matter of SCR or SCV but a balance system of SCR and SCR. Instead of blindly promoting SCR, enterprises need to keep SCR at a reasonable level with SCV to achieve the balanced development of SCR construction and SCV prevention. Hence, an appropriate balance between improving SCR and weakening SCV is critical for the overall performance of the supply chain.
Second, the proposed evaluation index system can be used to improve SCR and risk control, which can provide decision support in the management of the supply chain. The evaluation approach of the BSRV allows practitioners to identify the factors that impact SCR and SCV stronger and thus to devote effort to improving SCR and reducing SCV.
Third, the proposed analytical framework is generalisable and can be extended to other supply chains, such as a food supply chain, an electronic product supply chain, and an automotive supply chain, offering enterprises a beneficial guide to find the optimal balance state.
6. Conclusions
As two major dimensions to supply chain management, resilience and vulnerability are becoming important research topics. However, prior studies in this field consider only one of them and disregard the other, and few articles investigate the balance issue of the two. Conventional single-dimension study may not be able to fully understand the state of the supply chain risk management. The BSRV combines the two dimensions of resilience and vulnerability to examine the management level of the supply chain risks, which can provide managers with better decision support. To investigate this theoretical and practical issue, this study developed an analysis framework to evaluate the BSRV in the CBECSC. On the basis of identifying important drivers of SCR and SCV, the BSRV can be measured by the proposed evaluation model. To complement previous research, this approach gives insights into the appropriate consideration of both supply chain resilience and vulnerability, thereby avoiding the waste or misuse of resources in partially seeking the highest resilience or the lowest vulnerability, which is the novelty of this article. This article may lay the groundwork for quantifying the balance state of supply chain resilience and vulnerability.
The main contributions of this study can be summarised as follows. First, the concept of the BSRV is proposed in the CBECSC. Different from the previous literature that only focuses on measuring SCR or SCV, to the best of our knowledge, this study may be the first attempt to link SCR and SCV. Analysis of the BSRV is valuable and significant to allocate resources and maintain the continuity of the CBECSC rationally. Second, this paper develops a new approach to measure the BSRV based on the significant drivers of SCR and SCV by integrating fuzzy AHP and fuzzy TOPSIS methods. The proposed approach takes both SCR and SCV into consideration, which may be helpful for organisations to estimate resilience and vulnerability, adjust resource allocations in the supply chain management, re-examine, and track the level of the BSRV in uncertain environments in the long term. Third, this study focuses on the CBECSC, which is more complicated than domestic and/or traditional supply chains and subjects to risks due to long-distance transportation and international trade-related barriers. An empirical study of CBECSC improves the practical significance of the proposed approach.
On the whole, the proposed model provides value for evaluating the BSRV, and the application example demonstrates its effectiveness. However, this study is not free from limitations, which should be addressed in further research. First, the applicability of the proposed approach relies strongly on quantifying SCR drivers and SCV drivers. In this study, we identify drivers based on the literature and field surveys. A more extensive investigation of SCR drivers and SCV drivers may be able to provide a broader view of the BSRV evaluation. Additionally, we constructed an integrated evaluation model to measure the BSRV of CBECSC via fuzzy AHP and fuzzy TOPSIS methods, depending on the judgment of industry experts. More advanced methods can be incorporated with the judgment of experts to develop new approaches to measure the BSRV in complex applications, for example, big data analysis. Finally, this study presents a static evaluation of the SCR and SCV of CBECSC. More insights into improving the continuity of a supply chain may be obtained in a study considering dynamic changes in SCR and SCV over time. To this end, we expect more valuable and interesting studies will be performed on this topic in the future.
Acknowledgements
The authors would like to thank the editors and anonymous reviewers for their valuable and constructive comments.
Data availability statement
The authors confirm that the data supporting the findings of this study are available within the article.
Disclosure statement
No potential conflict of interest was reported by the author(s).
Additional information
Funding
References
- Armani, A. M., D. E. Hurt, D. Hwang, M. C. McCarthy, and A. Scholtz. 2020. “Low-tech Solutions for the COVID-19 Supply Chain Crisis.” Nature Reviews Materials 5 (6): 403–406.
- Awaysheh, A., and R. D. Klassen. 2010. “The Impact of Supply Chain Structure on the use of Supplier Socially Responsible Practices.” International Journal of Operations & Production Management 30 (12): 1246–1268.
- Blackhurst, J., M. J. Rungtusanatham, K. Scheibe, and S. Ambulkar. 2018. “Supply Chain Vulnerability Assessment: A Network Based Visualization and Clustering Analysis Approach.” Journal of Purchasing and Supply Management 24 (1): 21–30.
- Bogataj, D., and M. Bogataj. 2007. “Measuring the Supply Chain Risk and Vulnerability in Frequency Space.” International Journal of Production Economics 108 (1-2): 291–301.
- Buckley, J. J. 1985. “Fuzzy Hierarchical Analysis.” Fuzzy Sets and Systems 17 (3): 233–247.
- Chang, D. Y. 1996. “Applications of the Extent Analysis Method on Fuzzy AHP.” European Journal of Operational Research 95 (3): 649–655.
- Chen, C. T. 2000. “Extensions of the TOPSIS for Group Decision-Making Under Fuzzy Environment.” Fuzzy Sets and Systems 114 (1): 1–9.
- Chen, S. J., and C. L. Hwang. 1992. Fuzzy Multiple Attribute Decision Making Methods. Berlin: Springer.
- Chen, C. T., C. T. Lin, and S. F. Huang. 2006. “A Fuzzy Approach for Supplier Evaluation and Selection in Supply Chain Management.” International Journal of Production Economics 102 (2): 289–301.
- Chiu, C. M., E. T. Wang, Y. H. Fang, and H. Y. Huang. 2014. “Understanding Customers’ Repeat Purchase Intentions in B2C e-Commerce: the Roles of Utilitarian Value, Hedonic Value and Perceived Risk.” Information Systems Journal 24 (1): 85–114.
- Chopra, S., and M. S. Sodhi. 2004. “Supply-chain Breakdown.” MIT Sloan Management Review 46 (1): 53–61.
- Chowdhury, M. M. H., M. Quaddus, and R. Agarwal. 2019. “Supply Chain Resilience for Performance: Role of Relational Practices and Network Complexities.” Supply Chain Management: An International Journal 24 (5): 659–676.
- Christopher, M., and H. Lee. 2004. “Mitigating Supply Chain Risk Through Improved Confidence.” International Journal of Physical Distribution & Logistics Management 34 (5): 388–396.
- Christopher, M., and H. Peck. 2004. “Building the Resilient Supply Chain.” The International Journal of Logistics Management 15 (2): 1–14.
- Christopher, M., and C. Rutherford. 2004. “Creating Supply Chain Resilience Through Agile six Sigma.” Critical Eye 7 (1): 24–28.
- Craighead, C. W., J. Blackhurst, M. J. Rungtusanatham, and R. B. Handfield. 2007. “The Severity of Supply Chain Disruptions: Design Characteristics and Mitigation Capabilities.” Decision Sciences 38 (1): 131–156.
- Creazza, A., F. Dallari, and M. Melacini. 2010. “Evaluating Logistics Network Configurations for a Global Supply Chain.” Supply Chain Management: An International Journal 15 (2): 154–164.
- Dağdeviren, M., S. Yavuz, and N. Kılınç. 2009. “Weapon Selection Using the AHP and TOPSIS Methods Under Fuzzy Environment.” Expert Systems with Applications 36 (4): 8143–8151.
- Datta, P. P., M. Christopher, and P. Allen. 2007. “Agent-based Modelling of Complex Production/Distribution Systems to Improve Resilience.” International Journal of Logistics: Research and Applications 10 (3): 187–203.
- Dixit, V., P. Verma, and M. K. Tiwari. 2020. “Assessment of Pre and Post-Disaster Supply Chain Resilience Based on Network Structural Parameters with CVaR as a Risk Measure.” International Journal of Production Economics 227: 107655. doi:10.1016/j.ijpe.2020.107655.
- Du, S., H. Li, and B. Sun. 2019. “Hybrid Kano-Fuzzy-DEMATEL Model Based Risk Factor Evaluation and Ranking of Cross-Border e-Commerce SMEs with Customer Requirement.” Journal of Intelligent & Fuzzy Systems 37 (6): 8299–8315.
- Dubey, R., A. Gunasekaran, D. J. Bryde, Y. K. Dwivedi, and T. Papadopoulos. 2020. “Blockchain Technology for Enhancing Swift-Trust, Collaboration and Resilience Within a Humanitarian Supply Chain Setting.” International Journal of Production Research 58 (11): 3381–3398.
- Fingar, P. 2000. “Component-based Frameworks for e-Commerce.” Communications of the ACM 43 (10): 61–67.
- Gaudenzi, B., and A. Borghesi. 2006. “Managing Risks in the Supply Chain Using the AHP Method.” The International Journal of Logistics Management 17 (1): 114–136.
- Giuffrida, M., R. Mangiaracina, A. Perego, and A. Tumino. 2017. “Cross-border B2C e-Commerce to Greater China and the Role of Logistics: A Literature Review.” International Journal of Physical Distribution & Logistics Management 47 (9): 772–795.
- Gu, M., L. Yang, and B. Huo. 2021. “Patterns of Information Technology Use: Their Impact on Supply Chain Resilience and Performance.” International Journal of Production Economics 232: 107956. doi:10.1016/j.ijpe.2020.107956.
- Habermann, M., J. Blackhurst, and A. Y. Metcalf. 2015. “Keep Your Friends Close? Supply Chain Design and Disruption Risk.” Decision Sciences 46 (3): 491–526.
- Hallikas, J., K. Puumalainen, T. Vesterinen, and V. M. Virolainen. 2005. “Risk-based Classification of Supplier Relationships.” Journal of Purchasing and Supply Management 11 (2-3): 72–82.
- Hameri, A. P., and J. Hintsa. 2009. “Assessing the Drivers of Change for Cross-Border Supply Chains.” International Journal of Physical Distribution & Logistics Managemen 39 (9): 741–761.
- Harland, C., R. Brenchley, and H. Walker. 2003. “Risk in Supply Networks.” Journal of Purchasing and Supply Management 9 (2): 51–62.
- Hendricks, K. B., and V. R. Singhal. 2005. “An Empirical Analysis of the Effect of Supply Chain Disruptions on Long-run Stock Price Performance and Equity Risk of the Firm.” Production and Operations Management 14 (1): 35–52.
- Hsieh, T. Y., S. T. Lu, and G. H. Tzeng. 2004. “Fuzzy MCDM Approach for Planning and Design Tenders Selection in Public Office Buildings.” International Journal of Project Management 22 (7): 573–584.
- Ivanov, D. 2010. “An Adaptive Framework for Aligning (re)Planning Decisions on Supply Chain Strategy, Design, Tactics, and Operations.” International Journal of Production Research 48 (13): 3999–4017.
- Ivanov, D. 2018. “Supply Chain Management and Structural Dynamics Control.” In: Structural Dynamics and Resilience in Supply Chain Risk Management, 1–18. Cham: Springer.
- Junior, F. R. L., L. Osiro, and L. C. R. Carpinetti. 2014. “A Comparison Between Fuzzy AHP and Fuzzy TOPSIS Methods to Supplier Selection.” Applied Soft Computing 21: 194–209.
- Jüttner, U. 2005. “Supply Chain Risk Management.” International Journal of Logistics Management 16 (1): 120–141.
- Jüttner, U., and S. Maklan. 2011. “Supply Chain Resilience in the Global Financial Crisis: an Empirical Study.” Supply Chain Management: An International Journal 16 (4): 246–259.
- Jüttner, U., H. Peck, and M. Christopher. 2003. “Supply Chain Risk Management: Outlining an Agenda for Future Research.” International Journal of Logistics: Research and Applications 6 (4): 197–210.
- Karsak, E. E. 2002. “Distance-based Fuzzy MCDM Approach for Evaluating Flexible Manufacturing System Alternatives.” International Journal of Production Research 40 (13): 3167–3181.
- Kauffman, R. J., and E. A. Walden. 2001. “Economics and Electronic Commerce: Survey and Directions for Research.” International Journal of Electronic Commerce 5 (4): 5–116.
- Kaur, H., and S. P. Singh. 2020. “Disaster Resilient Proactive and Reactive Procurement Models for Humanitarian Supply Chain.” Production Planning & Control. doi:10.1080/09537287.2020.1834124.
- Kawa, A. 2017. “Supply Chains of Cross-border e-commerce.” In Asian Conference on Intelligent Information and Database Systems, 173–183. Cham: Springer.
- Koh, T. K., M. Fichman, and R. E. Kraut. 2012. “Trust Across Borders: Buyer-Supplier Trust in Global Business-to-Business e-Commerce.” Journal of the Association for Information Systems 13 (11): 886–922.
- Kurniawan, R., S. H. Zailani, M. Iranmanesh, and P. Rajagopal. 2017. “The Effects of Vulnerability Mitigation Strategies on Supply Chain Effectiveness: Risk Culture as Moderator.” Supply Chain Management: An International Journal 22 (1): 1–15.
- Lee, E., Y. Y. Chen, M. McDonald, and E. O’Neill. 2020. “Dynamic Response Systems of Healthcare Mask Production to COVID-19: A Case Study of Korea.” Systems 8 (2): 18. doi:10.3390/systems8020018.
- Lee, H. L., V. Padmanabhan, and S. Whang. 1997. “Information Distortion in a Supply Chain: The Bullwhip Effect.” Management Science 43 (4): 546–558.
- Liu, X., Z. Dou, and W. Yang. 2021. “Research on Influencing Factors of Cross Border E-commerce Supply Chain Resilience Based on Integrated Fuzzy DEMATEL-ISM.” IEEE Access 9: 36140–36153.
- Liu, Z., and Z. Li. 2020. “A Blockchain-Based Framework of Cross-Border e-Commerce Supply Chain.” International Journal of Information Management 52: 102059. doi:10.1016/j.ijinfomgt.2019.102059.
- Liu, Z., and A. Nagurney. 2011. “Supply Chain Outsourcing Under Exchange Rate Risk and Competition.” Omega 39 (5): 539–549.
- Manuj, I., and J. T. Mentzer. 2008. “Global Supply Chain Risk Management Strategies.” International Journal of Physical Distribution & Logistics Management 38 (3): 192–223.
- McKinnon, A. 2006. “Life Without Trucks: the Impact of a Temporary Disruption of Road Freight Transport on a National Economy.” Journal of Business Logistics 27 (2): 227–250.
- Meixell, M. J., and V. B. Gargeya. 2005. “Global Supply Chain Design: A Literature Review and Critique.” Transportation Research Part E: Logistics and Transportation Review 41 (6): 531–550.
- Mentzer, J. T., M. B. Myers, and T. P. Stank. 2006. Handbook of Global Supply Chain Management. Thousand Oaks, CA: Sage.
- Milgate, M. 2001. “Supply Chain Complexity and Delivery Performance: An International Exploratory Study.” Supply Chain Management: An International Journal 6 (3): 106–118.
- Mou, J., J. Cohen, Y. Dou, and B. Zhang. 2017. “Predicting Buyers’ Repurchase Intentions in Cross-border Ecommerce: A Valence Framework Perspective.” In Proceedings of the 25th European Conference on Information Systems (ECIS), Guimarães, Portugal, June 5–10, 2017, 2382–2394.
- Munoz, A., and M. Dunbar. 2015. “On the Quantification of Operational Supply Chain Resilience.” International Journal of Production Research 53 (22): 6736–6751.
- Narayanan, V. G., and A. Raman. 2004. “Aligning Incentives in Supply Chains.” Harvard Business Review 82 (11): 94–103.
- Naughton, S., I. Golgeci, and A. Arslan. 2020. “Supply Chain Agility as an Acclimatisation Process to Environmental Uncertainty and Organisational Vulnerabilities: Insights from British SMEs.” Production Planning & Control 31 (14): 1164–1177.
- Neureuther, B. D., and G. Kenyon. 2009. “Mitigating Supply Chain Vulnerability.” Journal of Marketing Channels 16 (3): 245–263.
- Peck, H. 2006. “Reconciling Supply Chain Vulnerability, Risk and Supply Chain Management.” International Journal of Logistics: Research and Applications 9 (2): 127–142.
- Pereira, S. C. F., M. R. S. Scarpin, and J. F. Neto. 2020. “Agri-food Risks and Mitigations: A Case Study of the Brazilian Mango.” Production Planning & Control. doi:10.1080/09537287.2020.1796134.
- Pettit, T. J., K. L. Croxton, and J. Fiksel. 2013. “Ensuring Supply Chain Resilience: Development and Implementation of an Assessment Tool.” Journal of Business Logistics 34 (1): 46–76.
- Pettit, T. J., K. L. Croxton, and J. Fiksel. 2019. “The Evolution of Resilience in Supply Chain Management: a Retrospective on Ensuring Supply Chain Resilience.” Journal of Business Logistics 40 (1): 56–65.
- Pettit, T. J., J. Fiksel, and K. L. Croxton. 2010. “Ensuring Supply Chain Resilience: Development of a Conceptual Framework.” Journal of Business Logistics 31 (1): 1–21.
- Ponis, S. T., and E. Koronis. 2012. “Supply Chain Resilience? Definition of Concept and its Formative Elements.” The Journal of Applied Business Research 28 (5): 921–935.
- Ponomarov, S. Y., and M. C. Holcomb. 2009. “Understanding the Concept of Supply Chain Resilience.” The International Journal of Logistics Management 20 (1): 124–143.
- Prater, E., M. Biehl, and M. A. Smith. 2001. “International Supply Chain Agility – Tradeoffs Between Flexibility and Uncertainty.” International Journal of Operations & Production Management 21 (5-6): 823–839.
- Rao, S., and T. J. Goldsby. 2009. “Supply Chain Risks: a Review and Typology.” International Journal of Logistics Management 20 (1): 97–123.
- Rogerson, M., and G. C. Parry. 2020. “Blockchain: Case Studies in Food Supply Chain Visibility.” Supply Chain Management: An International Journal 25 (5): 601–614.
- Samvedi, A., V. Jain, and F. T. Chan. 2013. “Quantifying Risks in a Supply Chain Through Integration of Fuzzy AHP and Fuzzy TOPSIS.” International Journal of Production Research 51 (8): 2433–2442.
- Scholten, K., and S. Schilder. 2015. “The Role of Collaboration in Supply Chain Resilience.” Supply Chain Management: An International Journal 20 (4): 471–484.
- Sheffi, Y. 2005. The Resilient Enterprise-Overcoming Vulnerability for Competitive Advantage. Cambridge, USA: The MIT Press.
- Shi, Y., W. Ting, and C. A. Layth. 2020. “Analytics for Cross-Border E-Commerce: Inventory Risk Management of an Online Fashion Retailer.” Decision Sciences 51 (6): 1347–1376.
- Simatupang, T., and R. Sridharan. 2008. “Design for Supply Chain Collaboration.” Business Process Management Journal 14 (3): 401–418.
- Slone, R., J. Mentzer, and J. Dittmann. 2007. “Are You the Weakest Link in Your Company’s Supply Chain?” Harvard Business Review 85 (9): 116–127.
- Soni, U., V. Jain, and S. Kumar. 2014. “Measuring Supply Chain Resilience Using a Deterministic Modeling Approach.” Computers & Industrial Engineering 74: 11–25.
- Spiegler, V. L., M. M. Naim, and J. Wikner. 2012. “A Control Engineering Approach to the Assessment of Supply Chain Resilience.” International Journal of Production Research 50 (21): 6162–6187.
- Sun, C. C. 2010. “A Performance Evaluation Model by Integrating Fuzzy AHP and Fuzzy TOPSIS Methods.” Expert Systems with Applications 37 (12): 7745–7754.
- Svensson, G. 2001. “Perceived Trust Towards Suppliers and Customers in Supply Chains of the Swedish Automotive Industry.” International Journal of Physical Distribution & Logistics Management 31 (9): 647–662.
- Tan, W. J., W. Cai, and A. N. Zhang. 2020. “Structural-aware Simulation Analysis of Supply Chain Resilience.” International Journal of Production Research 58 (17): 5175–5195.
- Tan, W. J., A. N. Zhang, and W. Cai. 2019. “A Graph-Based Model to Measure Structural Redundancy for Supply Chain Resilience.” International Journal of Production Research 57 (20): 6385–6404.
- Tang, C. S. 2006. “Robust Strategies for Mitigating Supply Chain Disruptions.” International Journal of Logistics: Research and Applications 9 (1): 33–45.
- Trkman, P., and K. McCormack. 2009. “Supply Chain Risk in Turbulent Environments-A Conceptual Model for Managing Supply Chain Network Risk.” International Journal of Production Economics 119 (2): 247–258.
- Tse, Y. K., and K. H. Tan. 2011. “Managing Product Quality Risk in a Multi-Tier Global Supply Chain.” International Journal of Production Research 49 (1): 139–158.
- Tse, Y. K., and K. H. Tan. 2012. “Managing Product Quality Risk and Visibility in Multi-Layer Supply Chain.” International Journal of Production Economics 139 (1): 49–57.
- Van Heel, B., V. Lukic, and E. Leeuwis. 2014. Cross-border E-Commerce Makes the World Flatter. Boston, MA: The Boston Consulting Group.
- Van Laarhoven, P. J., and W. Pedrycz. 1983. “A Fuzzy Extension of Saaty's Priority Theory.” Fuzzy Sets and Systems 11 (1-3): 229–241.
- Vilko, J., and J. Hallikas. 2012. “Origin and Impact of Supply Chain Risks Affecting Supply Security.” International Journal of Shipping and Transport Logistics 4 (2): 110–123.
- Wagner, S. M., and C. Bode. 2006. “An Empirical Investigation Into Supply Chain Vulnerability.” Journal of Purchasing and Supply Management 12 (6): 301–312.
- Wagner, S. M., C. Bode, and P. Koziol. 2009. “Supplier Default Dependencies: Empirical Evidence from the Automotive Industry.” European Journal of Operational Research 199 (1): 150–161.
- Wagner, S. M., and N. Neshat. 2010. “Assessing the Vulnerability of Supply Chains Using Graph Theory.” International Journal of Production Economics 126 (1): 121–129.
- Wang, L., Y. Chai, Y. Liu, and Y. Xu. 2015. “Qualitative Analysis of Cross-border e-Commerce Based on Transaction Costs Theory.” In 2015 IEEE 12th International Conference on e-Business Engineering, 166–172. IEEE, October.
- Wang, X., H. K. Chan, R. W. Yee, and I. Diaz-Rainey. 2012. “A Two-Stage Fuzzy-AHP Model for Risk Assessment of Implementing Green Initiatives in the Fashion Supply Chain.” International Journal of Production Economics 135 (2): 595–606.
- Wang, Y., F. Jia, T. Schoenherr, and Y. Gong. 2018. “Supply Chain-Based Business Model Innovation: The Case of a Cross-Border E-Commerce Company.” Sustainability 10 (12): 4362. doi:10.3390/su10124362.
- Wang, T. C., and H. D. Lee. 2009. “Developing a Fuzzy TOPSIS Approach Based on Subjective Weights and Objective Weights.” Expert Systems with Applications 36 (5): 8980–8985.
- Waters, D. 2011. Supply Chain Risk Management: Vulnerability and Resilience in Logistics. London: Kogan Page.
- Wei, H. L., and E. T. Wang. 2010. “The Strategic Value of Supply Chain Visibility: Increasing the Ability to Reconfigure.” European Journal of Information Systems 19 (2): 238–249.
- Wilson, M. C. 2007. “The Impact of Transportation Disruptions on Supply Chain Performance.” Transportation Research Part E: Logistics and Transportation Review 43 (4): 295–320.
- Yong, D. 2006. “Plant Location Selection Based on Fuzzy TOPSIS.” The International Journal of Advanced Manufacturing Technology 28 (7-8): 839–844.
- Zadeh, L. A. 1973. “Outline of a new Approach to the Analysis of Complex Systems and Decision Processes.” IEEE Transactions on Systems, Man, and Cybernetics SMC-3: 28–44.
- Zhao, X., J. Xie, and J. Leung. 2002. “The Impact of Forecasting Model Selection on the Value of Information Sharing in a Supply Chain.” European Journal of Operational Research 142 (2): 321–344.
Appendix 1. Interview protocol
1. Background information
Please introduce the background of your company, your cross-border e-commerce supply chain processes. Please describe the development of your company.
2. Cross-border e-commerce supply chain resilience management and drivers
What is your company’s resilience management process? Which of the following drivers are relatively important for cross-border e-commerce supply chain resilience management? (supply chain agility; supply chain structure; supply chain visibility; information sharing; risk and revenue sharing; geographic distribution; collaboration with supply chain partners)
If you think that there exist other important drivers, please add them.
3. Supply chain vulnerability management and drivers
What is your company’s vulnerability management process? Which of the following drivers are relatively important for cross-border e-commerce supply chain vulnerability management?
(quality risk; delivery risk; suppliers’ dependency; worker strikes; machine failure; risks in global logistics network; sudden demand fluctuation; forecasting error; customers’ dependency; natural and man-made disasters; political instability; exchange rate fluctuation)
If you think that there exist other important drivers, please add them.
4. The balance state of supply chain resilience and vulnerability
What do you think of the balance state of supply chain resilience and vulnerability? Has your company evaluated this issue? If yes, how do you measure the balance state of supply chain resilience and vulnerability?
Appendix 2. Fuzzy set theory
Fuzzy set theory is used to deal with decision-making processes based on imprecise and uncertain information (Zadeh Citation1973). On the basis of the concept of membership function, it is used to express the degree of adjectives often used in human natural language and a variety of life encountered ambiguous or uncertain problems. In this way, the value of the variable originally expressed in language can be converted into a corresponding fuzzy number through membership function. For the convenience of calculation, this study uses triangular fuzzy number (TFN) for fuzzy AHP and fuzzy TOPSIS. In many studies, TFN has been proven to be an effective tool to solve decision problems that involve imprecise and subjective information (Sun Citation2010; Wang and Lee Citation2009). Some basic definitions of TFN are given as follows (Chang Citation1996; Van Laarhoven and Pedrycz Citation1983; Chen, Lin, and Huang Citation2006).
Definition 1:
A TFN can be defined by a triplet
, as shown in Figure B1. The membership function
is defined in the following formula (B1):
Definition 2:
Let and
be two TFNs expressed by the triplets
and
, respectively. Given any real number k, the operational rules of these two TFNs are expressed as follows:
(B2)
(B2)
(B3)
(B3)
(B4)
(B4)
(B5)
(B5)
(B6)
(B6)
(B7)
(B7)
Definition 3:
Let and
be two TFNs, then the distance between them can be calculated as follow.
(B8)
(B8)
Figure B1. Triangular fuzzy number .
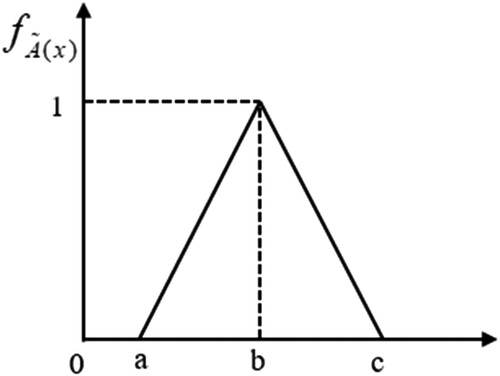
Definition 4:
In literature, linguistic variable is a useful tool for handling situations that are too complex or poorly-defined to be reasonably described in traditional quantitative expression forms (Chen Citation2000). Generally, linguistic variables can be expressed in words, sentences or artificial languages. For instance, ‘weight' is a linguistic variable, which can be represented by very low, low, medium, high, very high, and so on. These linguistic values can be represented by fuzzy numbers. In this study, the importance weights of various drivers are considered as linguistic variables, which can be expressed in positive TFNs. Following Hsieh, Lu, and Tzeng (Citation2004), linguistic variables for the relative importance weights of drivers used in this study are shown in .
Table B1. Linguistic variables for the relative importance weights.