
 ?Mathematical formulae have been encoded as MathML and are displayed in this HTML version using MathJax in order to improve their display. Uncheck the box to turn MathJax off. This feature requires Javascript. Click on a formula to zoom.
ABSTRACT
The extraction of positron emission tomography (PET) features has been regarded as a challenging task due to the metabolic interference of background issues, especially for patients with neurological disorders. In this paper, we proposed a computer-aided image subtraction technique for eliminating the metabolic interference of background issues and further highlighting lesions. To validate the feasibility of our technique, a study was conducted to review PET data before and after treatment in patients with anti-leucine-rich glioma-inactivated 1 (LGI1) encephalitis. The image subtraction procedure encompassed normalization, box out brain region, registration, and subtraction. The results demonstrated that the basal ganglia and medial temporal lobe were successfully extracted from 18F-FDG-PET images, which was also in agreement with clinical studies. This novel method was also proven to be effective for identifying changes in the metabolic rate of the brain before and after treatments for patients with anti-LGI1 encephalitis.
Introduction
Autoimmune encephalitis (AE) associated with leucine-rich glioma-inactivated 1 (LGI1) antibody is a rare but severe neurological disease [Citation1]. 18F-fluoro-2-deoxy-d-glucose positron emission tomography (18F-FDG-PET) plays a crucial role in the diagnosis of anti-LGI1 encephalitis [Citation2–4]. According to previous reports, 18F-FDG-PET mainly presents with hypermetabolism in the medial temporal lobe (MTL) and basal ganglia (BG) [Citation5]. However, the results of PET can be influenced by many factors [Citation6,Citation7], such as patient status, radioactive medicine, and scanning time, which may easily induce lower accuracy and different metabolism of background tissues. Therefore, previous hypermetabolism studies on subjects with anti-LGI1 encephalitis may be inaccurate due to the interference of the altered cortical metabolism of different individuals. For example, the cortex may exhibit different degrees of hypermetabolism, while PET showed similar degrees in the BG. In that case, the accuracy of the BG is unclear, and only limited pure visual analysis is conducted.
With the rapid development of computer-aided techniques, computer vision and image processing techniques have been widely applied in the neuroscience domain [Citation8–11]. As a classical example, the computer-aided image subtraction (CAIS) technique is usually applied to a pair of critically transformed and normalized images. With CAIS, one image can be subtracted from the other to obtain a registration image, which represents the intensity difference between the two images. The registration image can apparently improve the accuracy of lesion detection when compared with that of traditional visual interpretation [Citation12,Citation13]. Hence, the accuracy of CAIS mainly depends on the same anatomical structures between original and subsequent images [Citation14]. Currently, CAIS is usually applied to thoracic-abdominal or orthopaedic diseases rather than neurological diseases due to the interference of intensity [Citation15–18]. However, 18F-FDG-PET subtraction techniques have been gradually applied in wider areas, such as those listed in . It was also found that the specific metabolic pattern on 18F-FDG-PET in patients with anti-LGI1 encephalitis was reversible after standardized immunotherapy [Citation2]. Therefore, the PET images of the same subjects before and after processing can be used to verify the feasibility of CAIS and further evaluate and validate the results of abnormal metabolism.
Table. 1. Current clinical applications of 18F-FDG-FET subtraction techniques.
In this study, we conducted a retrospective study and reviewed 18F-FDG-PET data before and after treatments in one patient with anti-LGI1 encephalitis. The feasibility of CAIS from 18F-FDG-PET images was evaluated, and the limitation of visual interpretation was compensated. Finally, we validated the 18F-FDG-PET metabolic pattern, and the changes in the metabolic rate of the brain after treatments were also identified according to the results of CAIS for anti-LGI1 encephalitis.
Methods
Study participants
Patients with anti-LGI1 encephalitis were retrospectively reviewed at the Department of Neurology in the Beijing Tiantan Hospital of the Capital Medical University. The inclusion criteria were based on the typical clinical symptoms of LGI1 AE and the presence of positive LGI1 antibodies in the serum or cerebrospinal fluid (CSF) of the subject. The included patients had undergone two 18F-FDG-PET scans before and after the treatments. This study was approved by the Ethics Committee of Beijing Tiantan Hospital affiliated with the Capital Medical University of the People's Republic of China, and all patients provided informed consent for the use of their medical records.
18F-FDG-PET acquisition
18F-FDG PET images were acquired with a PET/CT scanner (Elite Discovery, GE HealthCare, Fairfield, Connecticut, USA). The patient fasted for at least 6 h and did not receive neuroleptic drugs for the acquisition of FDG-PET. The blood glucose levels were less than 8 mmol/L. 18F-FDG was intravenously injected at a dose of 3.7-5.0 MBq/kg, and the subsequent uptake ensured that the patient was in a quietly resting state before scanning in a dedicated room. Brain PET acquisitions were initiated 45–60 min later. First, a low-dose computed tomography (CT) scan was acquired, and the CT parameters for attenuation correction were 120 kV, pitch 0.984, automated tube current 60–180 mA, and slice thickness 3.75 mm. PET scans were subsequently performed in a typical 3D-TOF mode of 6–8 bed positions every 2 min. The brain imaging data were decomposed into transaxial slices with a matrix size of 128 × 128 and a slice thickness of 3.3 mm using an ordered subset expectation maximization (OSEM) algorithm. The PET data were quantified by a standardized uptake value (SUV) measure extracted from the scanner. The region of interest (ROI) refers to the structure in 2-dimensional space, i.e. on a slice, and the volume of interest (VOI) refers to the structure in 3-dimensional space, i.e. a summation of ROIs of adjacent slices in 2-dimensional space with 8 mm3 in every voxel was labelled as one VOI. The value for radioactivity in each structure for every participant was the maximum amount of all pixels in all ROIs assayed for the structure, which yielded a VOI for each fabric. The dynamic frame SUVmax data of the PET scans were separately obtained in the anterior cortex or posterior cortex in specified sections, BG and MTL. Then, the ratio of SUVmax based on VOI in the BG to the value in the frontal cortex was defined as the normalized SUVmax of the BG and MTL.
Analysis of 18F-FDG-PET
The image analysis consisted of normalization, region-proposal, registration, subtraction, and display parts, which are shown in .
Figure 1. Image subtraction procedures.
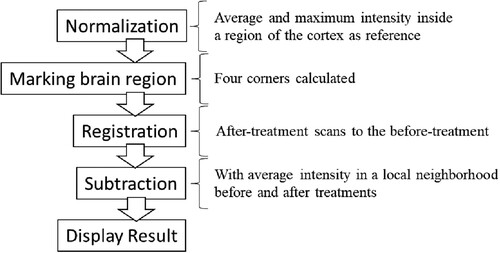
Normalization
The normalization procedure normalized the scale of the intensity of the scans before and after treatments. It used both the average and the maximum intensity inside a region of the cortex as the reference intensity to rescale the intensity of the entire brain. The reference area was defined as a part of the brain that was disease-free inside the cortex according to the suggestion from a medical professional. The normalization procedure was repeated for every set of scans.
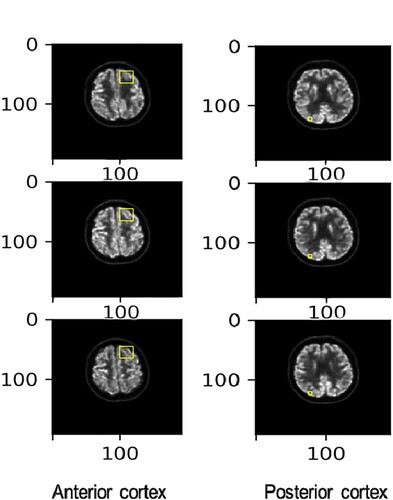
To comprehensively illustrate the method of choosing regions for normalization, six different slices from the scan are plotted in . The yellow squares on the lower left-hand side of the brain denote the region of healthy brain cortex tissue whose intensity value was used as the reference intensity. Since anti-LGI1 encephalitis can potentially affect a vast area of brain tissue, the reference square was chosen manually and was restricted to a small and specific volume to avoid the inclusion of any unhealthy tissue.
Figure 2. An example of image normalization.
Marking brain regions
Next, a box was drawn on the brain tissue on each slice to help the registration procedure focus solely on the brain rather than the entire skull. Four corners (upper left, upper right, lower left, and lower right) were calculated according to the isocontour line of the intensity. This procedure was repeated for all slices to obtain their corresponding boxes.
Registration
The registration step began by registering the after-treatment scans to the before-treatment scans on a slice-by-slice basis. Each slice from the before-treatment scans was registered to multiple images of after-treatment scans. The best match was selected based on the registration criterion of the cross-correlation score. Then, the following affine transformation algorithm was applied to fine-tune the parameters:
(1.1)
(1.1) where (xi, yi) (i = 1, 2, 3) are decided according to the anamorphic degree of three representative points (A, B, C) on the before-treatment scans.
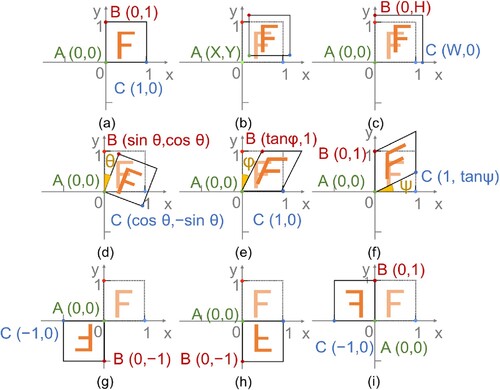
Nine potential situations were considered during the registration transformation process. As shown in , the corner in the origin of coordinate (A) and two adjacent opposite corners (B and C), marked by green, red, and blue points on every slice, were chosen as the criterion for transformation. For example, (a) exhibits the no-change situation with two opposite corners staying in the previous coordinates, and its transformation matrix is.
(1.2)
(1.2) When the corner is the origin of the coordinate translate (X, Y), the relative position between the slices from the before- and after-treatment scans can be presented as shown in (b), and its transformation matrix is
(1.3)
(1.3) Similarly, seven other situations are also exhibited in (c-i), which includes situations where the scale about the origin is W and H in the x and y directions, rotating about the origin by θ degrees, shearing in the x or y direction by φ or ψ degrees, and reflecting about the origin, x-axis or y-axis. The corresponding transformation matrices of the above seven situations are.
(1.4)
(1.4)
(1.5)
(1.5)
(1.6)
(1.6)
(1.7)
(1.7)
(1.8)
(1.8)
(1.9)
(1.9)
(1.10)
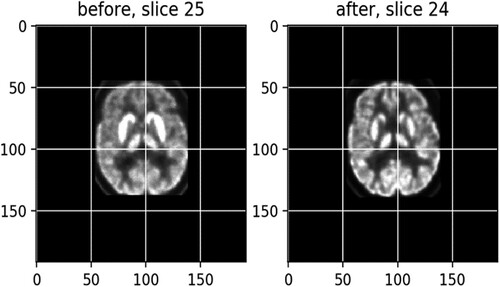
(1.10) exhibits a match after registration between slice 25, left, from the before-treatment scans and slice 24, right, from an after-treatment scan, with a score of −0.92 (the optimal score is −1), which becomes much clearer than the left one.
Figure 3. Nine potential situations of registration transformation.
Subtraction
In the last procedure, the registered after-treatment scans were first deducted from the before-treatment scans to ensure that no nonbrain regions were included in the subtraction. A brain mask was used to extract the brain-only slice from the before-treatment scans. Considering that the noise would be unexpectedly high if the before-treatment intensity was subtracted from that of the after-treatment pixel by pixel, the average intensity values in a local neighbourhood for both before and after treatment were calculated instead, and then the local averages were used in the subtraction.
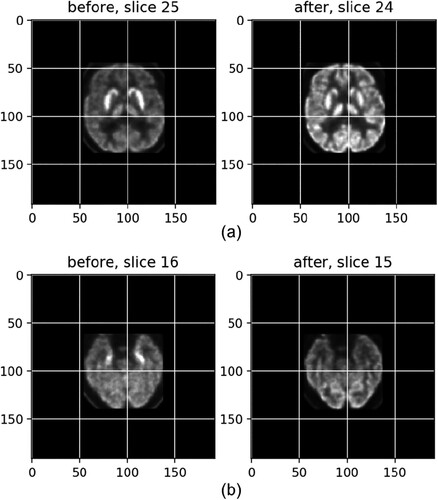
Figure 4. The scan image after registration.
Results
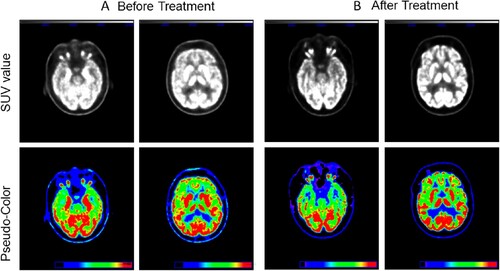
The 18F-FDG-PET data from one study participant with anti-LGI1 encephalitis before treatment are shown in A. The SUVmax of MTL was 14.94, and BG exhibited an SUVmax of 15.24. Accordingly, the 18F-FDG-PET image from the same patient after treatment is shown in B. The SUVmax of MTL and BG were 8.67 and 16.47, respectively.
Figure 5. The 18F-FDG-PET data before and after treatment.
The SUVmax value, as shown in the anterior cortex, was 3.79 before treatment; however, the SUVmax after treatment increased to 7.88. Similarly, the SUVmax values of the posterior cortex before and after treatment were 4.12 and 7.78, respectively.
Thus, if the anterior cortex was chosen as the reference point, the normalized SUVmax of the patient subject should be 3.94 (in MTL) and 4.02 (in BG). In contrast, the normalized SUVmax in the MTL and BG of the image from the same patient after treatment decreased from 3.94–1.10 and from 4.02–2.09, respectively. The same results were also obtained when the posterior cortex was used as the reference point.
The normalization and registration images before and after treatment, with the anterior cortex and posterior cortex used as the reference, are shown in and , respectively.
Figure 6. The normalization (a) and registration (b) images before and after treatment, with the anterior cortex used as the reference.
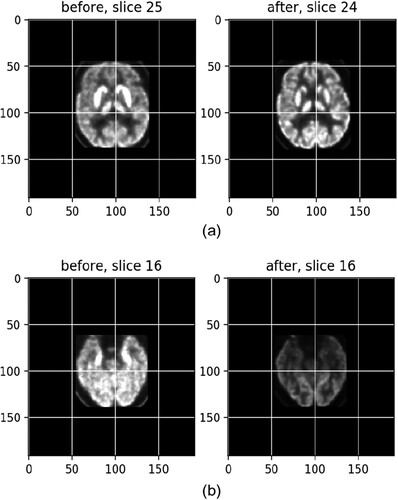
Figure 7. The normalization (a) and registration (b) images before and after treatment, with the posterior cortex used as the reference.
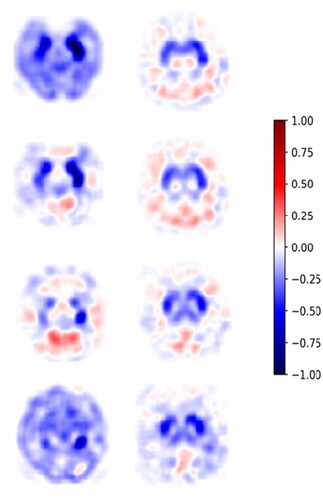
The normalized magnitude of the difference should be clipped at a series of cut-off values ranging from a negative value to a positive value in the colour bar, and the most appropriate cut-off values can be chosen by a medical professional for the disease of interest. A subtraction result rendered at a cut-off of 0.1 is shown in , and the slices are ordered from distal to proximal in the axial plane. The blue areas in represent decreased glucose uptake. Conversely, the red regions in indicate increased glucose uptake. In addition, the metabolism of the white regions in remained the same. In particular, some perturbation areas around zero, such as the light red and light blue ones, were still interpreted as no change in glucose uptake. Then, the subtracted image illustrating BG and MTL lesions can be extracted from 18F-FDG-PET images with the background noise eliminated.
Figure 8. The subtraction result rendered at a cut-off of 0.1 (blue colour indicates the previous abnormal metabolic state).
Discussion
Although most of the 18F-FDG-PET images can be analysed by traditional visual interpretation as in previous clinical practice, the traditional method is still considered to be less reliable due to the differences in the background metabolism of different patients. In our study, the results demonstrated that the subtracted images of the BG and MTL were true hypermetabolism regardless of whether the background metabolism was high or low, which was also in agreement with other clinical studies [Citation5]. According to the above findings, we validated the feasibility of the computer-aided subtraction technique for 18F-FDG-PET images, and this novel method can also accurately identify changes in the metabolic rate of the brain after treatments in patients with anti-LGI1 encephalitis.
Computer-aided techniques are becoming a major constituent of medical research, including imaging analysis [Citation29,Citation30], medical diagnosis [Citation31–33], and hospital care [Citation34]. However, whether computer-aided techniques can process independently remains controversial in clinical practice. Doctors are dealing with more than just the diseases, and more emphasis is placed on communication with patients. Therefore, the perceptual thinking method of computer-aided techniques for assisting clinical decision-making needs to be trained, rather than the logical one. In addition, patient information may include demographic characteristics, medical symptoms, signs, laboratory tests, and imaging data; however, the present computer-aided diagnostic techniques are usually equipped with only simple image recognition and clear image feature extraction tools. Therefore, one possible developing direction of computer-aided diagnostic techniques in the medical area may be the ability to integrate all clinical information and its application in medical practice. Only then can computer-aided techniques make more accurate and reproducible radiology evaluations, especially when they are integrated into clinical data as a tool for assisting physicians.
For the CAIS method, its reliability mainly depends on extremely precise normalization and registration of sequential images. In the current study, only the region of the cortex was separately selected as the reference intensity for normalization due to its relatively minor metabolic interference. Although our results are consistent with clinical practice, other normalized reference points still vitally need to be validated, which will further improve the reliability of the CAIS method. For instance, every artificial difference between an original and a subsequent image of the same anatomical location can cause errors during registration, and all slight displacements of regions may be misjudged as lesions [Citation14]. To avoid the potential risk of causing errors, normal brain atlases should be built with a deep learning algorithm that can realize registration in similar images from different patients. In addition, it is still necessary to reduce artefacts based on computer-aided techniques in further studies.
Conclusions
Because of the variable background metabolism of different patients, the traditional visual interpretation method for analysing 18F-FDG-PET images is currently considered insufficiently reliable. To efficiently extract PET features, a novel CAIS method was developed in this paper, which aimed to eliminate background noise and extract specific lesions from 18F-FDG-PET images in subjects with anti-LGI1 encephalitis. A series of tests were conducted on the patient before and after treatment to validate the reliability of our technique. According to the experimental results, the CAIS method can successfully extract the basal ganglia and medial temporal lobe from 18F-FDG-PET images. In addition, it was able to identify metabolic rate changes in the brain after treatment, which also improves diagnostic accuracy, especially when compared with the traditional visual interpretation technique.
Since the normalized reference points have exhibited significant influences on the accuracy of the analysis results, normal brain atlases will be further built with a deep learning algorithm in future studies to realize registration in similar images from different patients.
Author contributions
All authors contributed to the study conception and design, and material preparation, data collection, and analysis were performed by Xuewei Mao and Wei Shan. The first draft of the manuscript was written by Xuewei Mao and Wei Shan, and all authors commented on previous versions of the manuscript. All authors read and approved the final manuscript.
Compliance with ethical standards
Ethical approval and informed consent
This study was approved by the Ethics Committee of the Beijing Tiantan Hospital, which is affiliated with the Capital Medical University of the People's Republic of China, and all patients provided informed consent for the use of their medical records.
Disclosure statement
No potential conflict of interest was reported by the author(s).
Additional information
Funding
Notes on contributors
Xuewei Mao
Xuewei Mao received a B.E. degree in measuring and controlling technologies and instruments and an M. E. degree in measuring technology and instrument from Tianjin University, Tianjin, China, in 2010 and 2013, respectively, and Ph.D. degrees in mechanical science and engineering from the Nagoya University, Nagoya, Japan, in 2017. She is currently an Assistant Professor at the Qingdao University of Automation. Her current research interests include artificial intelligence and the safety of human-wearable robot interaction.
Wei Shan
Wei Shan received his Ph.D. and M.D degrees at Nagoya University Japan in 2017. He is a physician in Beijing tian tan Hosptial. His current research interests include artificial intelligence and autoimmune encephalitis.
Wilson Fox
Wilson Fox got his Ph.D. degree at the National University of singpoo, and he currently is an engineer at Beijing Tiantan hospital and a co-work with Dr. Wei Shan.
Jinpeng Yu
Jinpeng Yu received a B.Sc. degree in automation from Qingdao University, Qingdao, China, in 2002, an M.Sc. degree in system engineering from Shandong University, Jinan, China, in 2006, and the Ph.D. degree from the Institute of Complexity Science, Qingdao University, in 2011. He is currently a Distinguished Professor at the School of Automation and Electrical Engineering, at Qingdao University. He is a recipient of the Shandong Province Taishan Scholar Special Project Fund and the Shandong Province Fund for Outstanding Young Scholars. His research interests include electrical energy conversion and motor control, applied nonlinear control, and intelligent systems.
References
- Li X, Yuan J, Liu L, et al. Antibody-LGI 1 autoimmune encephalitis manifesting as rapidly progressive dementia and hyponatremia: a case report and literature review. BMC Neurol. 2019;19(1):1–5. doi:10.1186/s12883-019-1251-4.
- Park S, Choi H, Cheon GJ, et al. 18F-FDG PET/CT in anti-LGI1 encephalitis: initial and follow-up findings. Clin Nucl Med. 2015;40(2):156–158. doi:10.1097/rlu.0000000000000546.
- Bordonne M, Chawki MB, Doyen M, et al. Brain 18F-FDG PET for the diagnosis of autoimmune encephalitis: a systematic review and a meta-analysis. Eur J Nucl Med Mol Imaging. 2021;48:3847–3858. doi:10.1007/s00259-021-05299-y.
- Morbelli S, Zoccarato M, Bauckneht M, et al. 18F-FDG-PET and MRI in autoimmune encephalitis: a systematic review of brain findings. Clin Transl Imaging. 2018;6:151–168. doi:10.1007/s40336-018-0275-x.
- Wegner F, Wilke F, Raab P, et al. Anti-leucine rich glioma inactivated 1 protein and anti-N-methyl-D-aspartate receptor encephalitis show distinct patterns of brain glucose metabolism in 18F-fluoro-2-deoxy-d-glucose positron emission tomography. BMC Neurol. 2014;14:136, doi:10.1186/1471-2377-14-136.
- Schmidt ME, Chiao P, Klein G, et al. The influence of biological and technical factors on quantitative analysis of amyloid PET: points to consider and recommendations for controlling variability in longitudinal data. Alzheimers Dement. 2015;11(9):1050–1068. doi:10.1016/j.jalz.2014.09.004.
- Claudia K, David S. Quantitative preclinical PET imaging: opportunities and challenges. Front Phys. 2014;2:12, doi:10.3389/fphy.2014.00012.
- Huang Z, Xu H, Su S, et al. A computer-aided diagnosis system for brain magnetic resonance imaging images using a novel differential feature neural network. Comput Biol Med. 2020;121:103818, doi:10.1016/j.compbiomed.2020.103818.
- Kellmeyer P. Artificial intelligence in basic and clinical neuroscience: opportunities and ethical challenges. Neuroforum. 2019;25(4):241–250. doi:10.1515/nf-2019-0018.
- Mandong H, Yi Z, Shuxuan X, et al. Fuzzy system based medical image processing for brain disease prediction. Front Neurosci. 2021;15:714318, doi:10.3389/fnins.2021.714318.
- Radüntz T, Scouten J, Hochmuth O, et al. EEG artifact elimination by extraction of ICA-component features using image processing algorithms. J Neurosci Methods. 2015;243:84–93. doi:10.1016/j.jneumeth.2015.01.030.
- Navarro F, Escudero-Viñolo M, Bescós J. Accurate segmentation and registration of skin lesion images to evaluate lesion change. IEEE J Biomed Health Inform. 2019;23(2):501–508. doi:10.1109/JBHI.2018.2825251.
- Delongchamps NB, Peyromaure M, Schull A, et al. Prebiopsy magnetic resonance imaging and prostate cancer detection: comparison of random and targeted biopsies. J Urol. 2013;189(2):493–499.
- Chakrapani S, Sirisha K, Srilalitha A, et al. Choice of diagnostic and therapeutic imaging in periodontics and implantology. J Indian Soc Periodontol. 2013;17(6):711, doi:10.4103/0972-124X.124474.
- Miyake N, Lu H, Kamiya T, et al. Optimizing early cancer diagnosis and detection using a temporal subtraction technique. Technol Forecast Soc Change. 2021;167:120745, doi:10.1016/j.techfore.2021.120745.
- Nakamura H, Morishita J, Shimizu Y, et al. Improving image quality around subtle lung nodules by reducing artifacts in similar subtraction imaging. Radiol Phys Technol. 2018;11(4):460–466. doi:10.1007/s12194-018-0474-1.
- Sundarakumar DK, Wilson GJ, Osman SF, et al. Evaluation of image registration in subtracted 3D dynamic contrast-enhanced MRI of treated hepatocellular carcinoma. AJR Am J Roentgenol. 2015;204(2):287–296. doi:10.2214/AJR.13.12417.
- Fukuda T, Matsuda H, Doi S, et al. Evaluation of automated 2D-3D image overlay system utilizing subtraction of bone marrow image for EVAR: feasibility study. Eur J Vasc Endovasc Surg. 2013;46(1):75–81. doi:10.1016/j.ejvs.2013.04.011.
- Jena A, Sangeeta T, Aashish G, et al. Single-session multiparametric approach using simultaneous O-(2-18F-fluoroethyl)-L-tyrosine PET/MRI. Clin Nucl Med. 2016;41(5):e228–e236. doi:10.1097/RLU.0000000000001152.
- Jonah P, Sina H, Thomas J. W, et al. Applications of global quantitative 18F-FDG-PET analysis in temporal lobe epilepsy. Nucl Med Commun. 2016;37(3):223–230. doi:10.1097/MNM.0000000000000440.
- Forte B, Martin S, Hill C, et al. Use of subtraction PET to identify the source of recurrent sepsis after bomb blast injury. Case Rep SN Compr Clin Med. 2020;2(5):644–647. doi:10.1007/s42399-020-00295-z.
- Shimizu Y, Hara T, Fukuoka D, et al. Temporal subtraction system on torso FDG-PET scans based on statistical image analysis. medical imaging 2013: computer-aided diagnosis. Int Soc Opt Photonics. 2013;8670:86703F, doi:10.1117/12.2007886.
- Yeon YS, Je-Kyung K, Young-sil A, et al. Effect of donepezil on Wernicke aphasia after bilateral middle cerebral artery infarction: subtraction analysis of brain F-18 fluorodeoxyglucose positron emission tomographic images. Clin Neuropharmacol. 2015;38(4):147–150. doi:10.1097/WNF.0000000000000089.
- Chiaravalloti A, Pagani M, Cantonetti M, et al. Brain metabolic changes in Hodgkin disease patients following diagnosis and during the disease course: an 18F-FDG PET/CT study. Oncol Lett. 2015;9:685–690. doi:10.3892/ol.2014.2765.
- Kito S, Koga H, Kodama M, et al. Reflection of 18F-FDG accumulation in the evaluation of the extent of periapical or periodontal inflammation. Oral Surg Oral Med Oral Pathol Oral Radiol. 2012;114(6):e62–e69. doi:10.1016/j.oooo.2012.05.027.
- Chang C-C, Cho S-F, Chuang Y-W, et al. Prognostic significance of retention index of bone marrow on dual-phase 18F-fluorodeoxyglucose positron emission tomography/computed tomography in patients with diffuse large B-cell lymphoma. Medicine (Baltimore). 2018;97(2):e9513, doi:10.1097/MD.0000000000009513.
- Johnsrud K, Skagen K, Seierstad T, et al. 18F-FDG PET/CT for the quantification of inflammation in large carotid artery plaques. J Nucl Cardiol. 2019;26(3):883–893. doi:10.1007/s12350-017-1121-7.
- Wang H, Tang G, Hu K, et al. Comparison of three 18F-labeled carboxylic acids with 18F-FDG of the differentiation tumor from inflammation in model mice. BMC Med Imaging. 2016;16(1):1–8. doi:10.1186/s12880-016-0110-7.
- Gao J, Jiang Q, Zhou B, et al. Convolutional neural networks for computer-aided detection or diagnosis in medical image analysis: an overview. Math Biosci Eng. 2019;16(6):6536–6561. doi:10.3934/mbe.2019326.
- Jain S, Jagtap V, Pise N. Computer aided melanoma skin cancer detection using image processing. Procedia Computer Scienc. 2015;48:735–740. doi:10.1016/j.procs.2015.04.209.
- Chen C-M, Chou Y-H, Tagawa N, et al. Computer-aided detection and diagnosis in medical imaging. Comput Math Methods Med. 2013;2013:790608, doi:10.1155/2013/790608.
- Roy M, Mali K, Chatterjee S, et al. (2019, February). A study on the applications of the biomedical image encryption methods for secured computer aided diagnostics. In 2019 Amity International Conference on Artificial Intelligence (AICAI) (pp. 881-886). IEEE.
- Lee H, Chen Y-PP. Image based computer aided diagnosis system for cancer detection. Expert Syst Appl. 2015;42(12):5356–5365. doi:10.1016/j.eswa.2015.02.005.
- Lynch CJ, Liston C. New machine-learning technologies for computer-aided diagnosis. Nat Med. 2018;24(9):1304–1305. doi:10.1038/s41591-018-0178-4.