
ABSTRACT
The emergence of social media and Web 2.0 has a notable impact upon the tasks of destination managers as these platforms have developed into influential mechanisms affecting tourist behaviour. This paper shows how Destination Management Organizations (DMOs) can reap the benefits of the Web 2.0 revolution as it serves as an important source of user-generated information, bringing novel opportunities for data-driven destination management. To test the applicability of user-generated content for destination management, this paper analyses restaurant reviews from five Flemish art cities which were retrieved from the Web 2.0 platform TripAdvisor. Getis-Ord hot spot analysis revealed spatial clusters of frequently (‘hot spots’) and rarely (‘cold spots’) reviewed restaurants in four out of the five art cities. By comparing these spatial patterns, the digital footprints of tourists were uncovered and discussed with DMO directors. Found patterns appeared to reflect local policies aimed either at concentrating tourism, as in Bruges, the city with the most prominent hot spot, or spreading tourism over time and space as seen in Antwerp and Ghent where less prominent hot spots were present. The visualization proved to be a valuable input when discussing tourism management and fuelled the sharing of knowledge between the destinations.
Introduction
In order to increase a destination’s competitive position, Destination Management Organizations (DMOs) often spend much effort and resources on better positioning their destination through differentiation and highlighting its uniqueness. In the literature, however, these types of marketing-based approaches are criticized for merely focussing on providing top-down information to prospective and actual tourists in a manner which is according to those critics ‘guided by little more than conventional wisdom’ (Ashworth & Page, Citation2011, p. 7). In this process, tourists themselves are not acknowledged as part of the image-formation process and in most cases ignored as an important source of information. The strategy of differentiating and positioning destinations through marketing is now believed to produce a marginal competitive advantage at best (Go & Govers, Citation2000). Contemporary approaches towards destination management, therefore, suggest the competitive advantage can be reached through incorporating strategies which make use of information on tourist behaviour and experiences to increase business intelligence (Fuchs, Höpken, & Lexhagen, Citation2014) and facilitate knowledge-based destination management (Cooper, Citation2006; Del Chiappa & Baggio, Citation2015).
Moreover, issues concerning overcrowding, decreasing quality of services and degrading of the living environments for local inhabitants are now surfacing in the more mature urban heritage destinations (Colomb & Novy, Citation2016; Ganzaroli, De Noni, & van Baalen, Citation2017; Russo, Citation2002; Van der Borg, Costa, & Gotti, Citation1996). With the showcase example of tourism development in Venice, various authors have highlighted the destructive effects tourism can have on urban heritage destinations (Ganzaroli et al., Citation2017; Russo, Citation2002; Van der Borg et al., Citation1996). This means that DMOs’ traditional aim to attract as many visitors as possible is not valid anymore. New aims arise, such as the distribution of visitors over the city in order to find a balance between the carrying capacity and bearing load of certain areas, and to reach a fair distribution of the costs and benefits of enhanced tourist influx. DMOs are confronted with new tasks and new competencies in order to keep the growing influx of tourists on the right track.
DMOs can’t solve these current issues by themselves (Haugland, Ness, Grønseth, & Aarstad, Citation2011). A possible strategy, widely discussed in the literature, is to engage local stakeholders in destination management via public-private collaboration and networking (Novelli, Schmitz, & Spencer, Citation2006). However, although new ideas and initiatives are often generated in these networks, thus contributing to their popularity, a remarkable lack of positive effects is still to be found in the empirical literature (Van der Zee & Vanneste, Citation2015). Two possible reasons for these disappointing results might be that first, these networks often lack a knowledge-driven approach capitalizing on information on tourist behaviour and experiences (Del Chiappa & Baggio, Citation2015) and second, networks surrounding DMOs tend to be rather inward-looking with low levels of inter-organizational or inter-destination learning (Cooper, Citation2006; Denicolai, Cioccarelli, & Zucchella, Citation2010; Haugland et al., Citation2011).
Recently, some authors started looking into the role ICTs can play in directing and changing tourist behaviour and maybe even in breaking vicious patterns of overcrowding and ‘tourismification’ (Ganzaroli et al., Citation2017; Van der Zee, van der Borg, & Vanneste, Citation2017). The ICT revolution allows tourists to use Web 2.0 platforms, such as TripAdvisor, to share their experiences and to provide their peers directly with information without any interference of DMOs. The information tourists leave on the various internet, social media or Web 2.0 platforms they use, the so-called user-generated content (UGC), however, also offers opportunities for DMOs to analyse these data in order to get relevant information about tourists, their behaviour and experiences via these new channels (Ganzaroli et al., Citation2017; Kádár, Citation2014; Litvin, Goldsmith, & Pan, Citation2008). This results in an increasing number of tools which have the potential to turn information about tourist behaviour into knowledge about the use and performance of tourist destinations (Litvin et al., Citation2008). This may support DMOs and other stakeholders to engage in more knowledge-based policy making and planning, adapted to the local needs and opportunities.
The application of UGC-analysis has opened a whole new area of academic interest on the role of Web 2.0 platforms as agents affecting tourist behaviour (Ganzaroli et al., Citation2017; Scott & Orlikowski, Citation2012). Web 2.0 platforms provide peer-to-peer information which could assist tourists in finding authentic and high-quality experiences (Ganzaroli et al., Citation2017). In this way, it changes the position of the tourist from a relatively passive consumer to a producer, or co-creator, of information, images and tourist experiences (Binkhorst & Den Dekker, Citation2009; Camprubí, Guia, & Comas, Citation2013). This democratization of the production and provision of tourist information not only assists tourists in making more informed and accurate decisions, it could also inspire tourists and help them better understand the destination they are visiting (Sigala, Citation2017), thus enhancing the tourist experience.
Ganzaroli et al. (Citation2017) suggest that the growing availability of UGC could also have the potential to alter tourist behaviour and assist in breaching the vicious developments described by Russo (Citation2002), if analysed and used correctly by DMOs. Contemporary tourism policy should, therefore, take the tourist into account as an active agent and important stakeholder in the policy making process. Getting more and deeper knowledge of online and offline tourist behaviour might be paramount for reaching competitive advantage in contemporary tourism management (Del Chiappa & Baggio, Citation2015; Fuchs et al., Citation2014; Toerisme Vlaanderen, Citation2011).
In line with this reasoning, the aim of this paper is twofold. The first goal of this paper is a scientific goal, and attempts to acquire a better understanding of tourists’ behavioural patterns within urban heritage destinations by applying a methodology of spatial analysis of the digital footprints tourists leave behind on UGC platforms. The spatial distribution of TripAdvisor reviews over a destination can indicate the presence of clusters of often-reviewed places (‘hot spots’) and rarely reviewed places (‘cold spots’). These geographic patterns inform us on the degree of clustering within different parts of the destination, which might be seen as an indicator for the level of ‘tourismification’ of (parts of) the destination. The second goal of this paper is an implementation goal and attempts to find out if and how this type of spatial analyses of UGC patterns can contribute to destination management as well as to stimulating inter-destination learning and collaboration. The chosen methodology of this part of the study is: feeding back the results of the spatial analyses to the DMO-directors of various tourist destinations within a focus group setting, and facilitating reflection and discussion on the potential impact of the results on policy making and planning. By combining these two goals, this paper aims to answer the empirical question to what extent the spatial analysis of UGC can provide more insight into the dynamics of tourist behaviour in urban heritage destinations as well as the practical question how this knowledge can be used to support local destination management and to stimulate sharing of knowledge and learning between destinations.
The structure of this paper is as follows: First, a discussion of the literature is presented on the dynamics of tourist behaviour, focused on the process of tourismification of urban destinations. This is followed by an overview of the recent upcoming field of studies into tourist UGC. In the methodology section, the two-step research design is introduced which combines (a) geographical hot spot and cold spot analysis as a means to analyse UGC with (b) qualitative focus groups consisting of DMO’s whom are invited to discuss and reflect on the results. The paper’s results section first presents the outcomes of the hot spot and cold spot analysis and secondly discusses the reflections by DMO directors on the patterns found and shows how UGC can be used to inform policy-makers, and to stimulate inter-destination learning and collaboration. The paper is concluded by a discussion which reflects the double aim of the study. In the first place, it shows how the empirical results contribute to both the scientific literature on the role of digital information generated by tourists (UGC) as an influential factor in the process of tourismification, and as a valuable source of information for destination management. Secondly, it reflects on the value of this type of applied research for everyday practice, by presenting it as an exemplary study, which – if successful – may be replicated with different measures, different social media and in different contexts in order to address a wide variety of research questions. Recommendations for further research are presented in the concluding paragraph.
Theoretical framework: tourist behaviour in historic cities in the digital age
Historic city centres, rich in tangible and intangible heritage, cultural landscapes, monuments and other objects to gaze at, in combination with an extensive collection of secondary tourist products and a lively atmosphere have become primary destinations for postmodern tourists (Ashworth & Page, Citation2011; Urry, Citation1990). The historic city centre’s morphology, characterized by the presence of historical and cultural sites and landmarks, can be considered the core of the attractiveness of urban destinations (Jansen-Verbeke, Citation1998). Service providers, such as hotels, restaurants and tour guides, locate in the surroundings of these attractions shaping a functional environment to cater for the needs of tourists visiting the primary tourism product (Ashworth & Page, Citation2011). This co-location of many different services and attractions can create a lively and attractive historic district, increasing its popularity for tourists and locals alike (Russo, Citation2002).
In this sense, Brouder and Eriksson (Citation2013, p. 580) note that successful clusters of tourism businesses tend ‘to be unevenly distributed in space and greatly influenced by past and local conditions’. Following this rationale, co-location is according to various authors not the only key to success. Next to forming a clustered critical mass catering for the needs of different users, the proximity and shared needs of the different businesses and service providers in historic city centres can stimulate collaboration and innovation (Novelli et al., Citation2006; Van der Zee et al., Citation2017). In other words, successful tourism businesses and service providers tend to be surrounded by, and connected to, other successful businesses and service providers, which is for an important part determined by the morphology of the historic city.
Visitors and tourists play an important role in this clustering mechanism. They do not only determine the success of tourist destinations and the businesses and service providers active in these destinations, they are also active agents shaping urban space (Russo, Citation2002). However, this process is not only positive; it also has a downside. Early contributions to the literature already warn for a process of tourismification, being ‘the way tourism activities are marking a city or an urban district in form and function; and the extent to which tourism is gradually taking over and changing the original forms and modifying the traditional functional mix in the city’ (Jansen-Verbeke, Citation1998, p. 741). Van der Borg et al. (Citation1996) have shown the effect of overshooting the carrying capacity of a destination on both the quality of the tourism experience as well as the living conditions for local inhabitants. This illustrates the previously introduced vicious model of tourism development in heritage destinations by Russo (Citation2002). In this model, tourists are claimed to conglomerate around a limited number of highlights, often clustered in the historic city centre of mature destinations. A decreasing share of the (day)visitors tends to inform themselves about local culture, local gastronomy and attractions outside this tourism cluster, causing a pattern of predictable and limited spatial behaviour. This in turn changes the tourism product offering within these clusters into a standardized, high volume, low quality type of service provision (Russo, Citation2002). This process caused by unrestrained growth of the tourism economy and changing patterns of visitor behaviour leads to tourismifcation (Jansen-Verbeke, Citation1998) and the formation of tourism zones or tourist bubbles in historic districts (Cohen, Citation1972; Colomb & Novy, Citation2016; Judd, Citation1999; Van der Zee & Go, Citation2013).
According to this model, mature heritage destinations may eventually suffer from reduced length of stays, higher clustering of tourists’ spatial behaviour and reduction of the quality of services and authenticity in touristic zones in the core of historic city centres. When not managed carefully, clustering of tourist activities and tourist flows can cause a vicious pattern, characterized as ‘tourismification’. Unfortunately, till now, contemporary tourism policy approaches have seldom been successful in dealing with current issues related to overcrowding and tourismification.
Various scholars highlight the importance of empirical investigations on this process of tourismification through spatial analyses of tourist activities in cities (Ashworth & Page, Citation2011; Ganzaroli et al., Citation2017; Jansen-Verbeke, Citation1998), although in early publications authors were rather pessimistic on the possibilities spatial analysis would bring for urban tourism research:
Urban tourism and its economic measurement and analysis, particularly where benefits and impacts can be spatially attributed and evaluated within the city remains an almost elusive goal, despite advances in GIS and the blending of economic and geographical analyses of tourism. (Ashworth & Page, Citation2011, p. 11)
Recently, urban planners and policymakers started embracing the opportunities brought by developments in the fields of (big) data analysis and GIS to assist decision making (Batty, Citation2013; Fuchs et al., Citation2014). More and more types of data on spatial behaviour, collected by all sorts of sensors, surveys and tracking methodologies have become available and applicable for academics and practitioners. Data retrieved from online sources, such as platforms of UGC, form an important part of this data revolution, but currently tourism management pays only limited attention to this application of UGC (Zeng & Gerritsen, Citation2014). The following section, therefore, explores the development of spatial data analysis and GIS in an urban tourism context.
Transferring user-generated information into user-generated knowledge
Until recently, the information about tourist behaviour available for tourism policymakers and planners was characterized by a limited collection of descriptive statistics and infrequent and costly tourist surveys. These data did not cover the necessary information to make knowledge-based policy decisions, which is nowadays seen as vital for increasing the competitive position of destinations (Cooper, Citation2006; Del Chiappa & Baggio, Citation2015; Fuchs et al., Citation2014; Kádár, Citation2014).
The widespread availability of UGC, as well as technological advancements in the storage, analysis and presentation of big data, have enabled new approaches to studying and understanding various aspects of tourism, and opened doors for knowledge-based destination management (Batty, Citation2013; Buhalis, Citation2000; Cooper, Citation2006; Del Chiappa & Baggio, Citation2015). Using UGC for activities like monitoring the destinations’ brand value or transforming UGC into other forms of strategic knowledge is however still fairly uncommon (Fuchs et al., Citation2014). DMOs currently use the internet and social media not to generate knowledge, but mainly to provide information or promote their destination (Zeng & Gerritsen, Citation2014). In other words: the internet is used for sending messages about the attractiveness of the tourist destination, rather than for retrieving information and deepening the knowledge about tourist behaviour. In this respect, one could say that internet is currently underused by most DMO’s.
Recent contributions to the literature indicate that UGC does provide opportunities for getting more and deeper knowledge on tourist behaviour. Since the ICT and social media revolution, tourists leave more and more digital footprints on different UGC platforms (Litvin et al., Citation2008; Munar & Jacobsen, Citation2014). Next to the fast-growing field of studies analysing topics and trends in UGC (O’Connor, Citation2008; Wang, Kirillova, & Lehto, Citation2017), analysing the digital footprint geographically can also give an indication on how tourists perceive, experience and use the destination (Ganzaroli et al., Citation2017; García-Palomares, Gutiérrez, & Mínguez, Citation2015; Girardin, Calabrese, Dal Fiore, Ratti, & Blat, Citation2008; Kádár, Citation2014; Koerbitz, Önder, & Hubmann-Haidvogel, Citation2013) and which experiences they communicate to their peers (Leung, Vu, Rong, & Miao, Citation2016).
Although still in its infancy, a number of studies show how DMOs apply analysis of UGC to inform policy making and planning. Marine-Roig and Clavé (Citation2015), for example, show how tourism managers in Barcelona use UGC to improve tourism marketing, better position the city as a tourist destination and enhance its business intelligence. Fuchs et al. (Citation2014) provide a model that helps a destination to use big data mining to learn more about real-time tourist behaviour, which assists both destination management as well as the business intelligence of the tourism sector. UGC proves to be a valuable source of information to gain knowledge about tourist behaviour and experiences, the next paragraph will discuss how UGC is and can be used to study spatial tourist behaviour.
Studying tourists’ spatial behaviour through UGC
UGC has become an increasingly important factor in assisting and affecting consumer choices and consumer behaviour (Ayeh, Au, & Law, Citation2013). Where previously online diaries and photo-sharing websites (Kádár, Citation2014) were the most common platforms, now review platforms are most widely used to both upload experiences and retrieve information by other travellers (Gursoy, Del Chiappa, & Zhang, Citation2017). At the moment TripAdvisor is the most influential of these ‘Travel 2.0’ platforms and provides a rich dataset for tourism research (Ayeh et al., Citation2013; Ganzaroli et al., Citation2017; Gursoy et al., Citation2017; O’Connor, Citation2008). Estimates suggest that between 70% and 80% of consumers are using product reviews and ratings to inform their decision making (Gretzel & Yoo, Citation2008). The majority of this group, however, uses UGC in a passive way. These passive users merely use UGC for information queries and never contribute, for example, through writing reviews (Munar & Jacobsen, Citation2014).
The high presence of passive users might be seen as creating a potential bias problem when studying data derived from UGC, since little is known about the characteristics of active versus passive users. However, there is at least some indication that UGC provides reliable data for tourism research. For instance, Koerbitz et al. (Citation2013) found that by analysing UGC, in this case photos uploaded on the platform Flickr, the length of stay of tourists could be extracted correctly. Tilly, Fuschbach, and Schoder (Citation2015) showed that tourist reviews on an undisclosed virtual tourism community correlated strongly with United Nations World Tourism Organization statistics on tourism per country, with the strongest relationship being found between overall tourism, both domestic and international, and the number of reviews on the UGC platform. The latter suggests, UGC can also capture the behaviour of tourists who are underrepresented in traditional tourism statistics, for example, day visitors, tourists staying with friends and relatives or tourists using Airbnb or other semi-formal and informal accommodation types.
Active users of UGC, being the providers of peer-to-peer information, are important when studying tourist behaviour through UGC (Kádár, Citation2014; Koerbitz et al., Citation2013). These tourists can be tracked through the information they leave behind deliberately, forming their explicit digital footprints (Fuchs et al., Citation2014; Girardin et al., Citation2008). However, the role of passive users is at least equally important. Since passive users base their behavioural choices on the information and reviews left by their active peers, a self-enforcing pattern of spatial behaviour can occur (Scott & Orlikowski, Citation2012). The presence of these self-enforcing patterns is highlighted by the finding by Ganzaroli et al. (Citation2017) that mainly the number of reviews a certain restaurant received in the past determines its future success. A circular process seems to develop, where present choices are nudged by choices of tourists in the past. This cascading of information can cause a repetitive, self-propelling effect leading to popular areas, hotels, attractions and restaurants becoming even more popular while niche and off-the-beaten-track alternatives struggle for the tourists’ attention (Ganzaroli et al., Citation2017).
Thus, there are two important reasons to study review patterns. Firstly, these reviews reflect the tourist behaviour of the active UGC users. But, secondly, and maybe even more important, these reviews in turn influence the behaviour of a far bigger group of passive UGC users who make use of UGC to plan and make travel choices (Ayeh et al., Citation2013; Ganzaroli et al., Citation2017; Gretzel & Yoo, Citation2008; Gursoy et al., Citation2017). In this manner, UGC might follow a comparable vicious pattern as described by Russo (Citation2002), in which a more mature destination boasts a more clustered review pattern, with a relatively low number of frequently reviewed facilities in the tourist bubble and a long tail of sparsely reviewed facilities outside the main touristic areas (Ganzaroli et al., Citation2017). This spatial clustering of UGC within destinations could be a warning sign for increasing levels tourismification and can inform policymakers and planners about the current state of their destinations. This paper will focus, therefore, on how spatial analysis of the digital footprint tourists leave behind on a popular UGC platform, TripAdvisor, can give an insight into the spatial patterns of tourist behaviour in historic cities, and how these findings can assist destination management and policy making.
Methodology
Study design
The study can be characterized as a multi-methods study with a sequential design, consisting of two consecutive phases. Phase 1 consists of spatial analysis of UGC collected from the TripAdvisor platform in order to map hot spots and cold spots in popular urban heritage destinations in Belgium. More specific, we compare review patterns in the five Flemish art cities (Antwerp, Bruges, Ghent, Leuven and Mechelen), which are comparable in their tourist product, history and morphology of the urban landscape but have different levels of maturity as tourist destinations and attract different amounts and types of tourists. The aim of this phase is to transform UGC-derived information from Tripadvisor into knowledge which is useful for tourism decision makers in the involved art cities. In Phase 2, we reflect on the found patterns with the directors of the local DMOs in order to both check the validity of the results and explore how this type of analysis may contribute to policy making and destination management, as well as to sharing of knowledge and learning between destinations.
Phase 1: spatial analysis of review patterns
Central measure: restaurant reviews
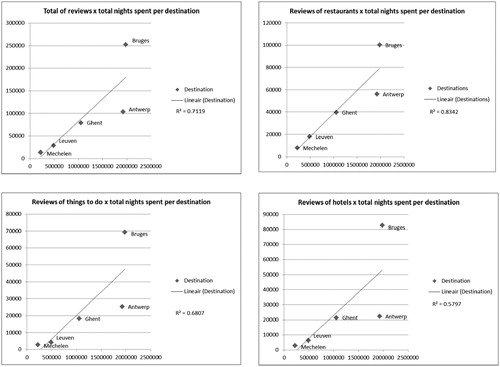
For this study, several choices had to be made, the most important one being which indicator to use as the central measure. Users of TripAdvisor can leave behind reviews and recommendations concerning their tourist experiences. On the TripAdvisor website, these are categorized into three main groups: hotels, things to do and restaurants. The first step taken was to see which of these categories could serve as a good indicator for measuring tourist behaviour in a destination. First, we checked the correlation between the number of nights spent in a destination, and the total number of reviews as well as the number of reviews in the three separate categories. This was carried out for Antwerp, Bruges, Ghent, Leuven and Mechelen (). While the total amount of reviews already shows a fairly strong relationship with the amount of nights spent (R2 of 0.71), the relationship between restaurants reviews and nights spent proved to be the strongest (R2 of 0.83). These findings are in line with previous studies showing high correlations between the number of reviews on UGC platforms and tourism statistics (Tilly et al., Citation2015). This makes restaurants a plausible candidate for the hot spot/cold spot analysis.
Figure 1. Correlation between nights spent per destination (2015) and number of TripAdvisor reviews per July, 2016.
Note: Number of reviews (TripAdvisor.com, retrieved July 2016) are featured on the Y-axes, number of nights spent in the destination (Toerisme Vlaanderen, Citation2017) on the X-axes.
A second reason to choose restaurants for this hot spot/cold spot analysis is that restaurants, specifically, are reviewed by overnight visitors, excursionists as well as locals. This offers a good representation of all the different groups active on TripAdvisor and their digital footprint. An in-depth study of TripAdvisor reviewers in Antwerp showed that half of the reviewers listed a non-Belgian location on their profile, while a quarter indicated they were Belgian and the last quarter did not list a location. The traffic on TripAdvisor in Antwerp is thus created by international as well as domestic tourists. Important to note here is that not only the behaviour of the reviewers themselves is important, but also the effect the reviewing behaviour has on future visitors and their choices (Ganzaroli et al., Citation2017; Scott & Orlikowski, Citation2012). A last reason to choose restaurant reviews as the central measure was that, of the three categories, restaurants are closest to what in economics is termed ‘substitute goods’. This is because tourists can decide in situ to choose a place to eat or drink, and often have a wide array of choice opportunities which are relatively interchangeable. The sheer extent and diversity of restaurants in urban tourism destinations, as well as the geographic distribution of restaurants over the destination, allows tourists to experience greater choice. Which choices tourists make, subsequently, is of interest for this study and their review behaviour reflects a part of the outcome of this choice process.
Focal point: hot spots and cold spots
Geographic clustering of digital footprints left behind by tourists on UGC is finding its way into tourism studies (Leung et al., Citation2016). In this study, we look whether there is a relationship between geographic locations of features, restaurants, and a quantitative attribute, ie number of reviews. Specifically, we look for hot spots and cold spots of review behaviour in urban heritage destinations. A hot spot, in this sense, is a geographic cluster of restaurants which are reviewed more often than would be expected if review behaviour was randomly distributed over the destination. The presence of a hot spot indicates an area where restaurants are reviewed more often, and therefore likely to attract more tourists. On the other side of the spectrum we are looking for ‘cold spots’: geographical clusters of restaurants which are less often reviewed than expected. The main hypothesis posed, following the work of Russo (Citation2002), is that more mature and heavily tourismificated destinations host intense hotspots within their historic centre surrounding their main attractions, indicating a functional clustering of secondary tourist products enhanced by tourist behaviour. In these destinations, cold spots are expected to be found along the borders of the hot spots, indicating tourists are less likely to venture out of the main tourist bubbles. In non-mature destinations, weak spatial patterns are expected to be found, indicating a more explorative tourist behaviour and limited presence of ‘beaten tracks’ and tourist bubbles.
Data acquisition and processing
For each restaurant, the number of reviews, average score, sub-category and address were manually collected between January and August 2016. All restaurants were given geographical coordinates based on the address listed on TripAdvisor, and were manually checked for (typing) errors. Two further selection criteria were applied before the data were analysed. According to the first criterion, only restaurants which were reviewed more than once were included in the final analysis. This threshold was chosen since manual checks showed high rates of error existed for restaurants with only one review. Since TripAdvisor relies on information provided by users for detecting errors in the information the website provides, restaurants with more reviews are more likely to be correctly listed. According to the second criterion, only restaurants located within the municipal boundaries of the different art cities were selected. In all the cities a small number of restaurants was mentioned which were, in fact, located quite a distance outside the city limits, and these were mostly subject to reporting errors.
Data analysis
We have posed the question of whether there is a relationship between the spatial location of a restaurant and a specific attribute, that is the number of reviews received. The spatial relationship between features based on a certain attribute can be determined by calculating the level of spatial auto-correlation. Spatial auto-correlation tests the hypothesis that a feature and associated attribute are randomly distributed in space. If this is not the case, a certain level of clustering of popular features in the destination, based on the number of reviews, is present. Analysing spatial auto-correlation of features and associated attributes, through identifying clusters, can uncover underlying spatial patterns that could inform decisions (Peeters et al., Citation2015).
An approach to spatial auto-correlation and cluster mapping is Getis-Ord hot spot analysis (Getis & Ord, Citation1992). A hot spot is a cluster of features with a high attribute value surrounded by features with a lower attribute value. The feature is considered a statistically significant hot spot when the sum of the attributed values of neighbouring features is different from the expected sum when the feature would be divided randomly over space. A significant difference from the expected pattern is found in two steps: First, when the sum of attribute values of a cluster of features, in this case restaurant reviews, is much higher than the average value for all features a very high z-score is present indicating a cluster of often-reviewed restaurants. Second, when the found difference is too large to be the result of random chance, a very low p-value is present, indicating the statistical significance of the cluster (Getis & Ord, Citation1992). Clusters of significant high values are considered hot spots while clusters of low values are considered cold spots. The presence of hot spots or cold spots indicates a relationship between the location of the feature, in this case restaurant and the attribute value, in this case the number of reviews (García-Palomares et al., Citation2015). Tourist behaviour in the destination can be mapped by showing tourist hot spots, being areas where restaurants tend to be more intensely reviewed by tourists compared to other areas in the city, and cold spots, being areas where clusters of restaurants are located which are relatively seldom reviewed. In this way, hot spots can represent areas where tourismification could take place, while cold spot indicates areas outside the main tourist scope. The extent and location of these hot spots and cold spots within destinations can be visualized through mapping, making the results accessible and interpretable for a wider audience.
By lack of previous research data in this area, we applied an optimized hotspot analysis, calculating the Getis-Ord Gi* statistic by deriving three parameters from the input data. Firstly, the locational outliers are identified and excluded from the further analysis. In this step, restaurants located far away from other restaurants are excluded, because – since the cluster analysis is based on the distance between features – features located too far away will have an out of proportion effect on the analysis. Secondly, features’ attributes, in this case the number of reviews restaurants received, are aggregated using fishnet polygons. By doing so, reviews of nearby restaurants are taken together, and ascribed to a cell in the polygon grid, which is used for the further analysis. Finally, the scale of analysis used to determine the neighbourhood of the feature is calculated using Moran’s I statistic for Incremental Spatial Auto-correlation until a peak of the z-score is found. Polygon cells within this scale of analysis are considered as neighbours and the attribute scores within the neighbourhood are compared to all other polygon cells. Every polygon cell is given a z-score indicating the similarity to its neighbourhood and dissimilarity to the other polygon cells. A high positive z-score indicates large numbers of reviews in both the polygon cell and its neighbourhood. But, it indicates lower numbers of reviews in the cells outside the neighbourhood. When the polygon’s p-value is low, an area where restaurants receive significantly more reviews compared to elsewhere, referred to as a hot spot, is present. A low negative z-score and low p-value indicate the presence of a cold spot, or a cluster of restaurants with low numbers of reviews.
After the analysis, the z-score and p-value of the polygon cells are attributed to the features, being the restaurants, within the cells. The output of the hot spot analysis can be explored and interpreted visually.
Phase 2: feedback focus group
A feedback session was planned with the directors of the DMOs of the different Flemish art cities and the managers of the Flemish art cities network. The goal of this meeting was twofold. First, in order to check the validity of the study and, second, to reflect on the results and to stimulate discussion on the study results between representatives of the five art cities. The ultimate goal was to explore how spatial analysis and visualizations of UGC can facilitate learning between the different DMOs and whether it could be translated into concrete policy recommendations driven by data. After a short presentation of the results, the floor was opened for discussion based on suggested topics as well as issues that emerged from the discussion.
Results
Phase 1: spatial clustering of digital footprints
The Flemish art cities (Antwerp, Bruges, Ghent, Leuven and Mechelen) differ strongly in the amount of tourists they receive ().
By analysing the digital footprint tourists left behind through TripAdvisor reviews in the different cities, we are able to show, that not only the volume differs between the cities, but also how the spatial spread of restaurant reviews varies between destinations.
Bruges, in population comparable to Leuven and Mechelen but much smaller than Ghent and Antwerp, stands out in multiple ways (). This is due to its high total number of restaurant reviews, as well as its high average number of reviews per restaurant. While having the same number of nights spent by overnight tourists compared to Antwerp, Bruges only has about half of the number of restaurants listed on TripAdvisor but more than double the number of reviews. These descriptive statistics show reviews are not randomly distributed over the destinations. The destinations, however, not only differ in the amount of reviews they receive. Spatial patterns of reviews within the destinations also differ. A spatial analysis of the relationship between the location and the number of reviews for restaurants in the Flemish art cities shows there are different patterns of hot spots and cold spots (–). Mechelen, the smallest city both in the number of nights spent by tourists as well as in restaurants reviewed and the total number of reviews, is the only destination that does not show any hot spot or cold spot (). There are no spatial clusters in the city with restaurants characterized by high or low numbers of reviews. This suggests that, in Mechelen, the relative location of a restaurant does not influence the number of reviews it receives. A closer inspection of the data shows that the restaurants with high numbers of reviews are indeed distributed quite randomly over the destination.
Figure 2. Hot spot analysis based on restaurant reviews on TripAdvisor in Mechelen. Source: TripAdvisor.com (data retrieved June 2016) and OpenStreetMap Contributors (Citation2017).
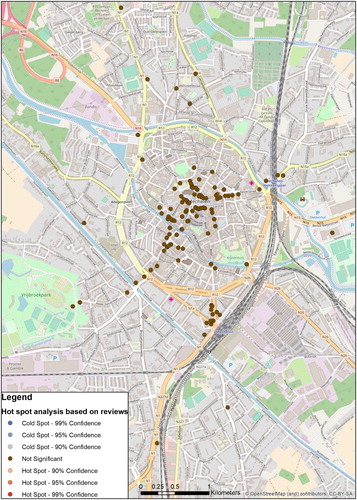
Table 1. Descriptive statistics of hot spots and cold spots in the different destinations.
In contrast to the absence of spatial clustering of review behaviour in Mechelen, the other cities do show spatial patterns of review behaviour. In Leuven (), the largest part of the city located within the ring road which was previously the city walls, is a review hot spot. The hot spot is surrounded by a neutral zone and a cold spot can be found in the north east of the city. Interestingly, this cold spot surrounds the main train station, a main point for entering the city which attracts high volumes of visitors and commuters. The spatial distribution of restaurants over the destination shows a clustering of high-reviewed restaurants around the central squares in the historic city and streets connecting these squares. However, the hot spot also exceeds this area in a southern and south-eastern direction along the main streets in the city centre and on the axis connecting the historic city centre with popular tourist attractions such as the UNESCO world heritage site ‘Grand Beguinage’ in the south. While the tourist centre of the city appears to be rather small, as indicated by the dense cluster of high-reviewed restaurants in the heart of the city, the extent of the hot spot indicates that restaurants outside this core also attract a higher number of reviews. The cold spot in the neighbourhood of the railway station indicates visitors and commuters pass through rather than enjoy this neighbourhood, or use the facilities out of convenience and don’t bother to review them.
Figure 3. Hot spot analysis based on restaurant reviews on TripAdvisor in Leuven. Source: TripAdvisor.com (data retrieved June 2016) and OpenStreetMap Contributors (Citation2017).
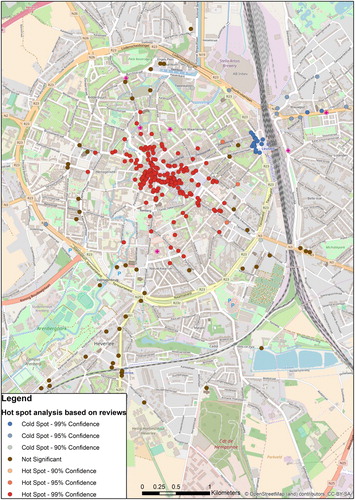
Both Bruges () and Ghent () have strong hot spots but different intensities of cold spots. These destinations have a strong and quite large hotspot taking up the biggest part of the historic city centre, surrounding the central squares and main historic sites. In Ghent, this hot spot is surrounded by neutral zones and smaller, moderately strong cold spots. The neighbourhoods surrounding the historic heart of the city have a considerable presence of restaurants listed on TripAdvisor, without any spatial patterns shown by the distribution of reviews. However, one neighbourhood features a cold spot. It is located to the south of the city centre, between the city’s main museums and the historic city, and crossing the university’s humanities campus. This cold spot corresponds to the so-called Arts Quarter which, for years, has been the subject of a rather weak tourism development despite many initiatives. In general, the cold spots in Ghent are less prominent, compared to Leuven or Bruges, suggesting a more random distribution of restaurants with high and low levels of reviews outside of the historic city centre.
Figure 4. Hot spot analysis based on restaurant reviews on TripAdvisor in Bruges. Source: TripAdvisor.com (data retrieved June 2016) and OpenStreetMap Contributors (Citation2017).
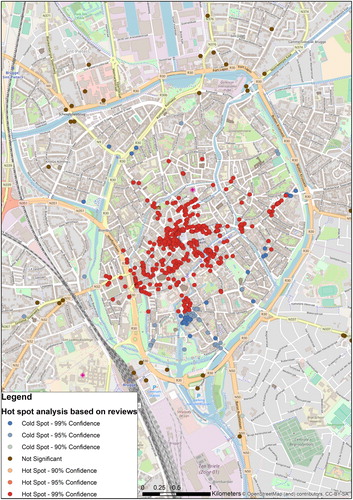
Figure 5. Hot spot analysis based on restaurant reviews on TripAdvisor in Ghent. Source: TripAdvisor.com (data retrieved June 2016) and OpenStreetMap Contributors (Citation2017).
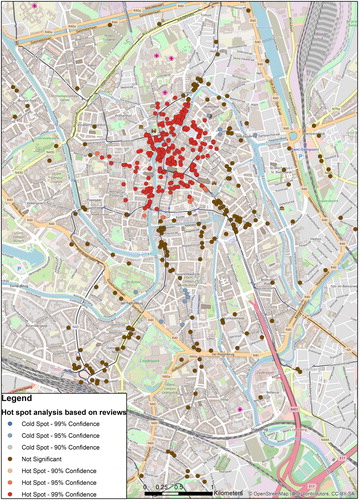
In Bruges, the cold spot starts immediately where the hot spot ends, and spreads out in all directions. The cold spots are located beyond the historic centre, but within the old town. Bruges is the only one of the Flemish art cities featuring a strong cold spot within the limits of the historic town, with a notable presence of a strong cold spot in the south of the city. This sudden shift from a cluster of restaurants with high numbers of reviews to clusters of restaurants with low numbers of reviews without a physical barrier present suggests very strong patterns of spatial review behaviour.
The spatial pattern of reviews in Antwerp () follows a different distribution. Just as with Ghent and Bruges, it has a strong hot spot taking up the historic city centre, the main market square and its surrounding streets. The hot spot expands to the north into an historic district where a church with famous paintings by Rubens and other Flemish masters is located and to the south east in the direction of the Rubens house museum and the main theatre square. The area bordering the historic heart to the west, along the bank of the river Scheldt features a less significant hot spot. While the hot spot in Antwerp is of the same absolute size as the hot spot in Bruges, Ghent and even Leuven, in relative terms, the city has the smallest hot spot compared to the size of the historic city. This indicates that the bulk of tourism behaviour takes place in a relatively small part of the destination.
Figure 6. Hot spot analysis based on restaurant reviews on TripAdvisor in Antwerp. Source: TripAdvisor.com (data retrieved January 2016) and OpenStreetMap Contributors (Citation2017).
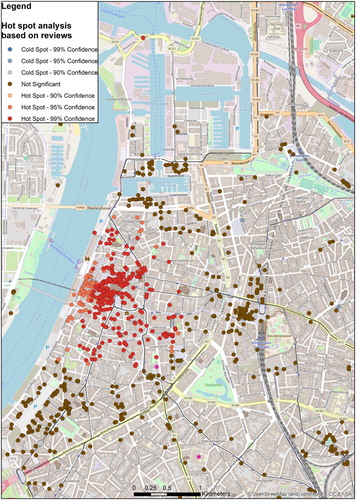
Even though a large share of Antwerps’ restaurants are located outside of the hot spots (), only a very small cold spot was found in an area north of the city centre. Here, recently, some gentrification has taken place, and many of the restaurants have only recently been opened. The absence of strong cold spots suggests that outside of the historic city centre, the rest of the city is reviewed randomly, without clusters of restaurants with high or low numbers of reviews. The areas surrounding the main museums in the north and south of the city centre, both former docklands, as well as the train station to the east of the historic city centre, are all areas with a high presence of restaurants but with no clustering based on the numbers of reviews. The finding that the area surrounding the main railway station is not a cold spot, such as in Leuven, can be explained by the fact that the station is both a Thalys stop on the Paris-Brussels-Amsterdam route and is adjacent to main tourist attractions such as the zoo and the diamond district, stressing the tourist function of this railway station, apart from its commuter function.
Phase 2: reflection on the outcomes by DMO directors
Even though the art cities offer a similar tourism product based on a medieval, baroque and classical heritage, culture, gastronomy and craftsmanship, the cities do, however, differ in the scale and scope of their tourism. Statistics such as the number of nights spent, show differences when comparing the cities. The spatial analysis partly confirms the perceived difference between the destinations, but also shows some new insights. This difference in the scale of tourism is confirmed by the position taken by the different DMOs during the feedback session. During the discussion, for example, the destinations Mechelen and Leuven were mainly interested in increasing the attractiveness of the destination for visitors in a sustainable way, while Bruges was mainly focussing on topics like carrying capacity and influencing spatial behaviour of tourists.
Bruges stood out both in the number of reviews restaurants received, as well in the spatial concentration of often and seldom reviewed restaurants. Bruges receives relatively many reviews compared to the number of nights spent by tourists, indicating higher tourist pressure by day visitors. The spatial clustering of reviews in a small part of the historic city was suggested to indicate high levels of tourismification in the historic city centre. As a response, the DMO director explained how this finding matches local tourism policy aimed at concentrating tourism in a zone known as the ‘golden triangle’. This area covers the largest part of the historic heart and southern part of the old town. According to the DMO director, spatially clustered primary tourist products in the historic city centre aimed at heritage and secondary tourist products offering accommodation and gastronomic experiences are still able to offer valuable experiences. These central areas are promoted while at the same time negative impacts of tourism are concentrated within a limited zone within the city. DMO studies indicate the majority of the inhabitants of the historic city centre are still rather positive towards tourism developments, contrasting claims of tourismification.
The hot spot found in Bruges, however, covered a bigger part of the city than the director of the DMO had expected and the cold spot in the south of the historic city was unexpected. This area is adjacent to where the tourist coaches with day visitors terminate, it is near to the city’s train station and close to some historic sites such as the UNESCO world heritage Beguinage. A possible explanation for the presence of this cold spot was the high popularity of the area with day visitors, a group which uses fewer of the city’s secondary tourist products and might be less likely to leave feedback on UGC platforms about their visit. This type of visitors might also prefer to first venture into the heart of the city centre before using secondary tourist products, such as restaurants, or use pre-booked restaurants as part of their daytrip.
The destinations Antwerp and, to a lesser extent, Ghent, apply a different tourism management policy compared to Bruges. Both DMOs actively try to spread tourists over the wider extent of the destination by informing them about different districts and neighbourhoods away from the historic heart of the city. Our presentation of the spatial analysis caused a discussion about the success of this policy, as the destinations show a similar review hot spot in the historic centre compared to Bruges and Leuven. On the one hand, in both Ghent and Antwerp, restaurants close to museum sites beyond the historical city centre are not part of the hot spots and in the case of Ghent are even part of a cold spot. Ample time was spent on a discussion about the apparent lack of success of policy aimed at spreading tourists within the destinations The DMO directors concluded that the main focus of tourists is still the historic heart of the city. On the other hand, the absence of strong cold spots indicates that, in both Antwerp and Ghent, a large number of the restaurants are situated outside the city centre hotspot and these not necessarily receive less reviews than their city centre counterparts, restaurants with high numbers of reviews and low numbers of reviews are more randomly distributed over the city outside the main review hot spot (). This indicates tourists do venture out of the hotspot and share their experiences on UGC platforms, but outside the historic city centre choose places to eat and drink specifically, and not only because they are conveniently located near attractions or transportation hubs.
In general, the participants of the feedback session believed that the main strength of the study was the richness of the information it provides when visualized in a comprehensible way in relation to the relative ease of collecting and analysing the data. Analysing spatial patterns from UGC originating from Travel 2.0 platforms was regarded as a promising, affordable and innovative approach to learning more about the spatial distribution of tourists over the included cities, thus supporting reflection and policy making. It was agreed that the presented material provides input for discussing the topic of tourismification and the clustering of tourist activitities while it facilitates discussing different policy approaches to destination management and in this way can be a catalyst for knowledge sharing and inter-destination learning.
While the results were seen as valuable by the DMO directors and led to a discussion and sharing of ideas towards tourism management, two main issues in particular were raised during the discussion. Firstly, the analysis made use of the current status of restaurants on TripAdvisor, which is a sum of all reviews and ratings collected over the past years. Recent policy, such as the promotion of districts and neighbourhoods outside the historic city centre, might take some time to have an effect. Secondly, the collection of data does not allow us to distinguish between different types of reviewers. For example, local reviewers could have other spatial review patterns compared to international tourists, or young reviewers compared to older reviewers.
Discussion
The current body of literature on UGC is mainly focussed on how a destination is represented on UGC through topic, discourse or sentiment analysis of comments and/or photos mined from UGC platforms (Fuchs et al., Citation2014; Leung, Law, Van Hoof, & Lau, Citation2013; Litvin et al., Citation2008). However, there is still limited knowledge of how tourists actually use and experience urban tourism destinations (Ashworth & Page, Citation2011). This proved to be also the case in the Flemish art cities. DMO directors were not fully aware of the opportunities UGC can bring for a better understanding of actual tourist behaviour. Yet, the type of learning presented in this study, driven by data acquired from the actual users of the destination, is an important topic both in current destination management and also in the scientific literature on tourism and in other fields (Batty, Citation2013; Del Chiappa & Baggio, Citation2015; Fuchs et al., Citation2014; Haugland et al., Citation2011; Marine-Roig & Clavé, Citation2015). This study proved that analysing the digital footprint of tourists could enrich existing tourism statistics with geospatial information on tourist behaviour and could serve as a useful tool for streamlining policy discussions, fuelling decision making, and monitoring policy outcomes, such as the distribution of tourists within the destination.
The spatial analysis of TripAdvisor reviews showed that clustering of review behaviour is present in all destinations except for the least mature one, Mechelen. Bruges, the most established and mature tourist destination, showed the highest spatial clustering compared to the size of the historic town. The finding that tourists tend to cluster in the historic heart of the city centres in the Flemish art cities corresponds to previous findings on tourist behaviour in the Flemish art cities (see eg Versichele et al., Citation2014 on Ghent, Van der Zee et al., Citation2017 on Antwerp or Neuts & Nijkamp, Citation2012 on Bruges). According to Russo (Citation2002) heavy clustering of tourist behaviour is associated with tourist destinations becoming more mature. This can, when not managed well, result in a vicious circle where overcrowding leads to a decline in the quality of services in tourist areas and, eventually, in shorter stays within the destination (Russo, Citation2002).
As this study looked at restaurant reviewing behaviour, it is notable that tourists, even for secondary tourism products, focus mainly on facilities in the direct vicinity of the main historical tourist attractions in the heart of the old city. Even though UGC platforms such as TripAdvisor allow us to explore the entire destination for hotels, activities or dining options, the main focus of tourists is, as suggested in previous research (Lew & McKercher, Citation2006), still spatially dependent and restricted. This is partly caused by the morphology of the urban landscape in the Flemish art cities and their functional make-up. An increasing presence of secondary tourist products, such as restaurants, local guides, galleries, etc., attracts visitors even more to the historic city centres, causing clustering of tourists in relatively small areas (Jansen-Verbeke, Citation1998; Judd, Citation1999). Next to this, an explanation of the effect of UGC on restricting tourist behaviour rather than stimulating exploration is given by Scott and Orlikowski (Citation2012). UGC platforms tend to reduce the rich information that visitors experience when visiting a restaurant into a simplified and rather arbitrary rating system, which yet acts as a power mechanism influencing future tourist behaviour. The prevalence of hotspots of frequently reviewed restaurants in Flemish art cities shows that the online success of a restaurant is partly caused by its location. As the literature suggests that tourists more and more use UGC for making their decisions (Ganzaroli et al., Citation2017; Gretzel & Yoo, Citation2008; Gursoy et al., Citation2017; Litvin et al., Citation2008), having a high number of reviews becomes the norm for restaurants in order to attract tourists. The spatial nature of review patterns enforces this norm, and marginalizes restaurants outside the hotspots (Ganzaroli et al., Citation2017). They need to do more to stand out and compete with the cluster of frequently reviewed restaurants. In this matter, this study demonstrates that review behaviour shows a self-propelling effect, since more established destinations show stronger spatial review patterns. Location seems to matter more in more mature destination since reviewers tend to be more normative by proportionally reviewing more restaurants in central locations within these destinations.
UGC may empower tourism businesses, but it also appears to prevent visitors from wandering off the beaten track and perhaps even limits tourist behaviour. The work of Scott and Orlikowski (Citation2012), empirically tested by Ganzaroli et al. (Citation2017) and combined with findings from this paper indicates that reviews create subsequent reviews, and we have shown this circular system has a specific spatial bias. This circular information cascade results in spatial clusters of often-reviewed restaurants in historic city centres which could be an indication of standardization and a warning for a possible decline in the quality of provided services, as is often witnessed in areas dealing with tourismifcation (Go & Govers, Citation2000; Jansen-Verbeke, Citation1998; Judd, Citation1999; Russo, Citation2002; Van der Zee & Go, Citation2013). A destination’s digital success can therefore become a serious problem in the end.
Previous qualitative research in one of the Flemish art cities indicated that, especially within the review hot spot, collaboration and networking were not common, while in more peripheral areas outside the historic city centre more informal collaboration and bottom-up networks were found to be present (Van der Zee et al., Citation2017). These findings correspond with recent work on tourism clusters. Successful, but inward-looking clusters run a high risk of relying too heavily on knowledge, products and modus operandi which have been successful in the past, but which lack the ability to innovate and adapt to changing contexts (Brouder & Eriksson, Citation2013; Bujosa, Riera, & Pons, Citation2015; Ma & Hassink, Citation2013). The found pattern of cascading, clustering review behaviour could enforce this stalemate position within successful tourist clusters, while making it more difficult to stimulate niche tourism development outside the main clusters. For destinations, this means that stimulating the development of an alternative path to tourism development outside of the main clusters could be difficult, and it needs huge effort to attract a critical mass of initial clients who will create new UGC which in turn attracts future tourists. Both tourism entrepreneurs as well as policymakers need to learn how to deal with the self-enforcing and clustering effect of review behaviour. Dealing with dominant tourism clusters is, therefore, more than ever, an important topic for policymakers in tourism.
Conclusions and recommendations for further research
This study tested the applicability of the spatial analysis of UGC as a tool to gain knowledge on tourist behaviour as well as to serve as an input for inter-DMO discussions on destination management. The combination of geospatial analyses of the distribution of tourists within urban tourist destinations with focus group discussions by policymakers from the involved destinations, proved to be a fruitful example of applied research by contributing both to the scientific aim and the implementation aim of the study. Firstly, this study shows that applying spatial clustering and hot spot analysis is able to show the digital footprint of tourists and provides new knowledge about the actual use and online representation of the destination. At the start of the study, two different outcomes of the impact of web reviews on tourist behaviour were plausible: (1) tourists might be seduced by certain web reviews to venture into new, unknown niche locations, that they did not know beforehand, promoting the distribution of tourists over the city, or (2) tourists might show herd behaviour by going where the masses go, promoting clustering of tourists within the popular areas. Although the first expectation may be incidentally valid, this study clearly shows that most tourists choose to follow their peers: tourism attract tourism.
Secondly, this study shows that analysing UGC from travel platforms can give an impetus to knowledge-based policy making and planning. The provided data may be used for making decisions about actual and relevant issues in tourism management. The methodology we presented proved to have benefits, as it not only provided policymakers with additional information but also fuelled discussion between DMO directors from different destinations and, through this, encouraged different destinations to learn from one another. Interestingly, prominent issues in the scientific literature, eg about spreading versus concentration of tourists within heritage destinations, were also widely discussed by the involved DMO-directors. It has taught us that some DMOs choose to concentrate tourism within a relatively small part of the historic city centre, but face the risk of getting into a vicious circle, while others prefer to develop niche tourism in more peripheral areas, but face a long way to go. This should be an impetus for more research, because these opposing DMO-strategies are both not self-evident at the operational level, and need scientific support for enhancing their chance of success, while at the same time reducing their inherent risks.
A number of improvements might increase the value of this type of analysis further. First, as this study analyses the sum of reviews collected over the years of the existence of TripAdvisor, it still gives a static image of the digital footprint. However, monitoring TripAdvisor on a regular basis increases the dynamic character of the analysis and makes it possible to visualize the effects of events, or the opening of new attractions and sights on the spatial behaviour of visitors. Secondly, in this study, only the analysis was based on data obtained from only one UGC platform. Triangulating the results with other UGC platforms, such as photo-sharing platforms or Twitter could improve the quality and representativeness of the data. Thirdly, the approach to data collection applied for this study did not distinguish between different types of UGC users such as local residents as opposed to tourists, different age or gender groups, or visitors from different geographical background (eg. national tourists versus international tourists). A more refined data mining technique could assist in collecting more detailed information which may allow a more thorough analysis of the digital footprint of various kinds of visitors.
Last but not least, the study did not take into account whether or not the restaurants had an active engagement with Travel 2.0 platforms like TripAdvisor, nor what they did to improve the number of reviews they receive, for instance by offering a cup of coffee to visitors who were willing to write a review on their experiences with the restaurant. This might have influenced review behaviour and has an unknown impact on the results of this study. To conclude: We hope that this study inspires other researchers to choose a similar multimethod approach within the tourism domain, addressing these and other relevant research questions, using various data sources, and applying other types of statistical analyses. The possibilities are manifold. We believe that this would contribute to more knowledge-based policy making and planning within the tourism domain.
Acknowledgements
We would like to thank the network of Flemish art cities for supporting this study. We also thank the DMO directors of the cities for participating in the study.
Disclosure statement
No potential conflict of interest was reported by the authors.
Additional information
Funding
References
- Ashworth, G., & Page, S. J. (2011). Urban tourism research: Recent progress and current paradoxes. Tourism Management, 32(1), 1–15. doi: 10.1016/j.tourman.2010.02.002
- Ayeh, J. K., Au, N., & Law, R. (2013). ‘Do we believe in TripAdvisor?’ Examining credibility perceptions and online travelers’ attitude toward using user-generated content. Journal of Travel Research, 52(4), 437–452. doi: 10.1177/0047287512475217
- Batty, M. (2013). Big data, smart cities and city planning. Dialogues in Human Geography, 3(3), 274–279. doi: 10.1177/2043820613513390
- Binkhorst, E., & Den Dekker, T. (2009). Agenda for co-creation tourism experience research. Journal of Hospitality Marketing & Management, 18(2–3), 311–327. doi: 10.1080/19368620802594193
- Brouder, P., & Eriksson, R. H. (2013). Staying power: What influences micro-firm survival in tourism? Tourism Geographies, 15(1), 125–144. doi: 10.1080/14616688.2011.647326
- Buhalis, D. (2000). Marketing the competitive destination of the future. Tourism Management, 21(1), 97–116. doi: 10.1016/S0261-5177(99)00095-3
- Bujosa, A., Riera, A., & Pons, P. J. (2015). Sun-and-beach tourism and the importance of intra-destination movements in mature destinations. Tourism Geographies, 17(5), 780–794. doi: 10.1080/14616688.2015.1093538
- Camprubí, R., Guia, J., & Comas, J. (2013). The new role of tourists in destination image formation. Current Issues in Tourism, 16(2), 203–209. doi: 10.1080/13683500.2012.733358
- Cohen, E. (1972). Toward a sociology of international tourism. Social Research, 39(1), 164–182.
- Colomb, C., & Novy, J. (2016). Protest and resistance in the tourist city. London: Routledge. ISBN: 978-1-138-85671-4.
- Cooper, C. (2006). Knowledge management and tourism. Annals of Tourism Research, 33(1), 47–64. doi: 10.1016/j.annals.2005.04.005
- Del Chiappa, G., & Baggio, R. (2015). Knowledge transfer in smart tourism destinations: Analyzing the effects of a network structure. Journal of Destination Marketing & Management, 4(3), 145–150. doi: 10.1016/j.jdmm.2015.02.001
- Denicolai, S., Cioccarelli, G., & Zucchella, A. (2010). Resource-based local development and networked core-competencies for tourism excellence. Tourism Management, 31(2), 260–266.
- Fuchs, M., Höpken, W., & Lexhagen, M. (2014). Big data analytics for knowledge generation in tourism destinations – a case from Sweden. Journal of Destination Marketing & Management, 3(4), 198–209. doi: 10.1016/j.jdmm.2014.08.002
- Ganzaroli, A., De Noni, I., & van Baalen, P. (2017). Vicious advice: Analyzing the impact of TripAdvisor on the quality of restaurants as part of the cultural heritage of Venice. Tourism Management, 61, 501–510. doi: 10.1016/j.tourman.2017.03.019
- García-Palomares, J. C., Gutiérrez, J., & Mínguez, C. (2015). Identification of tourist hot spots based on social networks: A comparative analysis of European metropolises using photo-sharing services and GIS. Applied Geography, 63, 408–417. doi: 10.1016/j.apgeog.2015.08.002
- Getis, A., & Ord, J. K. (1992). The analysis of spatial association by use of distance statistics. Geographical Analysis, 24(3), 189–206. doi: 10.1111/j.1538-4632.1992.tb00261
- Girardin, F., Calabrese, F., Dal Fiore, F., Ratti, C., & Blat, J. (2008). Digital footprinting: Uncovering tourists with user-generated content. IEEE Pervasive Computing, 7(4), 36–43. doi: 10.1109/MPRV.2008.71
- Go, F. M., & Govers, R. (2000). Integrated quality management for tourist destinations: A European perspective on achieving competitiveness. Tourism Management, 21(1), 79–88. doi: 10.1016/S0261-5177(99)00098-9
- Gretzel, U., & Yoo, K. H. (2008). Use and impact of online travel reviews. Information and Communication Technologies in Tourism; Proceedings of the International Conference in Innsbruck, Austria, 2008 (pp. 35–46). Vienna: Springer. doi:10.1007/978-3-211-77280-5_4.
- Gursoy, D., Del Chiappa, G., & Zhang, Y. (2017). Preferences regarding external information sources: A conjoint analysis of visitors to Sardinia, Italy. Journal of Travel & Tourism Marketing, 34, 806–820. doi: 10.1080/10548408.2016.1237405
- Haugland, S. A., Ness, H., Grønseth, B. O., & Aarstad, J. (2011). Development of tourism destinations. Annals of Tourism Research, 38(1), 268–290. doi: 10.1016/j.annals.2010.08.008
- Jansen-Verbeke, M. (1998). Tourismification of historical cities. Annals of Tourism Research, 25(3), 739–742. doi: 10.1016/S0160-7383(98)00015-2
- Judd, D. R. (1999). Constructing the tourist bubble. In D. R. Judd & S. S. Fainstein (Eds.), The tourist city (pp. 35–53). New Haven, CT: Yale University Press.
- Kádár, B. (2014). Measuring tourist activities in cities using geotagged photography. Tourism Geographies, 16(1), 88–104. doi: 10.1080/14616688.2013.868029
- Koerbitz, W., Önder, I., & Hubmann-Haidvogel, A. C. (2013). Identifying tourist dispersion in Austria by digital footprints. In L. Caponi & Z. Xiang (Eds.), Information and communication technologies in tourism: Proceedings of the international conference in Innsbruck, Austria, January 22–25, 2013 (pp. 495–506). Berlin: Springer. doi: 10.1007/978-3-642-36309-2_42
- Leung, D., Law, R., Van Hoof, H., & Lau, D. (2013). Social media in tourism and hospitality: A literature review. Journal of Travel & Tourism Marketing, 30(1–2), 3–22. doi: 10.1080/10548408.2013.750919
- Leung, R., Vu, H. Q., Rong, J., & Miao, Y. (2016). Tourists visit and photo sharing behavior analysis: A case study of Hong Kong temples. In Information and communication technologies in tourism 2016 (pp. 197–209). Vienna: Springer.
- Lew, A., & McKercher, B. (2006). Modeling tourist movements. Annals of Tourism Research, 33(2), 403–423. doi: 10.1016/j.annals.2005.12.002
- Litvin, S. W., Goldsmith, R. E., & Pan, B. (2008). Electronic word-of-mouth in hospitality and tourism management. Tourism Management, 29(3), 458–468. doi: 10.1016/j.tourman.2007.05.011
- Ma, M., & Hassink, R. (2013). An evolutionary perspective on tourism area development. Annals of Tourism Research, 41, 89–109. doi: 10.1016/j.annals.2012.12.004
- Marine-Roig, E., & Clavé, S. A. (2015). Tourism analytics with massive user-generated content: A case study of Barcelona. Journal of Destination Marketing & Management, 4(3), 162–172. doi: 10.1016/j.jdmm.2015.06.004
- Munar, A. M., & Jacobsen, J. K. S. (2014). Motivations for sharing tourism experiences through social media. Tourism Management, 43, 46–54. doi: 10.1016/j.tourman.2014.01.012
- Neuts, B., & Nijkamp, P. (2012). Tourist crowding perception and acceptability in cities. Annals of Tourism Research, 39(4), 2133–2153. doi: 10.1016/j.annals.2012.07.016
- Novelli, M., Schmitz, B., & Spencer, T. (2006). Networks, clusters and innovation in tourism: A UK experience. Tourism Management, 27(6), 1141–1152. doi: 10.1016/j.tourman.2005.11.011
- O’Connor, P. (2008). User-generated content and travel: A case study on TripAdvisor.com. In P. O’Connor, W. Hopken, & U. Gretzel (Eds.), Information and communication technologies in tourism: Proceedings of the international conference in Innsbruck, Austria, 2008 (pp. 47–58). Vienna: Springer.
- OpenStreetMap Contributors. (2017). Flanders [Map]. Retrieved from https://www.openstreetmap.org/search?query=flanders#map=9/51.0971/4.1658
- Peeters, A., Zude, M., Käthner, J., Ünlü, M., Kanber, R., Hetzroni, A., … Ben-Gal, A. (2015). Getis–ord’s hot- and cold-spot statistics as a basis for multivariate spatial clustering of orchard tree data. Computers and Electronics in Agriculture, 111, 140–150. doi: 10.1016/j.compag.2014.12.011
- Russo, A. P. (2002). The ‘vicious circle’ of tourism development in heritage cities. Annals of Tourism Research, 29(1), 165–182. doi: 10.1016/S0160-7383(01)00029-9
- Scott, S. V., & Orlikowski, W. J. (2012). Reconfiguring relations of accountability: Materialization of social media in the travel sector. Accounting, Organizations and Society, 37(1), 26–40. doi: 10.1016/j.aos.2011.11.005
- Sigala, M. (2017). Collaborative commerce in tourism: Implications for research and industry. Current Issues in Tourism, 20(4), 346–355. doi: 10.1080/13683500.2014.982522
- Tilly, R., Fischbach, K., & Schoder, D. (2015). Mineable or messy? Assessing the quality of macro-level tourism information derived from social media. Electronic Markets, 25(3), 227–241. doi: 10.1007/s12525-015-0181-2
- Toerisme Vlaanderen. (2011). #toeristvanmorgen, Eindrapport ViA-rondetafel. Retrieved from http://www.toerismevlaanderen.be/sites/toerismevlaanderen.be/files/assets/eindrapport%20%23toeristvanmorgen.pdf
- Toerisme Vlaanderen. (2017). Toerisme in cijfers XL, evolutie in het aantal overnachtingen, 2012–2016. Retrieved from http://www.toerismevlaanderen.be/sites/toerismevlaanderen.be/files/assets/documents_KENNIS/cijfers/XL2016/OV-evolutie-12-16.pdf
- Urry, J. (1990). The tourist gaze. London: Sage.
- Van der Borg, J., Costa, P., & Gotti, G. (1996). Tourism in European heritage cities. Annals of Tourism Research, 23(2), 306–321. doi: 10.1016/0160-7383(95)00065-8
- Van der Zee, E., & Go, F. M. (2013). Analysing beyond the environmental bubble dichotomy: How the 2010 World Cup case helped to bridge the host–guest gap. Journal of Sport & Tourism, 18(3), 161–183. doi: 10.1080/14775085.2014.888674
- Van der Zee, E., van der Borg, J., & Vanneste, D. (2017). The destination triangle: Toward relational management. In N. Scott, M. Van Niekerk, & J. Jafari (Eds.), Bridging tourism theory and practice (Vol. 8, pp. 167–188). London: Emerald. eISBN: 978-1-78714-405-7
- Van der Zee, E., & Vanneste, D. (2015). Tourism networks unravelled: A review of the literature on networks in tourism management studies. Tourism Management Perspectives, 15, 45–56.
- Versichele, M., De Groote, L., Bouuaert, M. C., Neutens, T., Moerman, I., & Van de Weghe, N. (2014). Pattern mining in tourist attraction visits through association rule learning on Bluetooth tracking data: A case study of Ghent, Belgium. Tourism Management, 44, 67–81. doi: 10.1016/j.tourman.2014.02.009
- Wang, S., Kirillova, K., & Lehto, X. (2017). Travelers’ food experience sharing on social network sites. Journal of Travel & Tourism Marketing, 34, 680–693. doi: 10.1080/10548408.2016.1224751
- Zeng, B., & Gerritsen, R. (2014). What do we know about social media in tourism? A review. Tourism Management Perspectives, 10, 27–36. doi: 10.1016/j.tmp.2014.01.001