
 ?Mathematical formulae have been encoded as MathML and are displayed in this HTML version using MathJax in order to improve their display. Uncheck the box to turn MathJax off. This feature requires Javascript. Click on a formula to zoom.
ABSTRACT
Visiting tourists and residents of a city interact at various locations at various times. Previous studies paid little attention to comparing the spatio-temporal behaviours of tourists and residents from a long-term perspective. The aim of the present study was to identify and compare the spatio-temporal behaviours of mainland Chinese tourists and residents in Hong Kong over a period of five years. Their behaviours were compared by means of kernel density analysis and temporal statistical analysis, using Weibo geotagged check-in data and geographic information systems (GIS). The results show that the spatial behaviours of mainland Chinese tourists (MCT) are more concentrated than those of residents, especially in central urban areas, whereas residents also visit suburban and exurban areas. Simultaneously, MCTs’ temporal behaviours varied significantly, whereas those of residents were relatively stable. From a long-term perspective, we found that in the central urban area, MCTs’ preferences for locations tended to be relatively fixed, but their activity in local neighbourhoods and residential quarters decreased. However, residents’ interest in typical tourism highlights decreased reflecting potential strategies of avoidance in those areas whereas their activities in other tourism hotspots were more stable. These findings can be applied in urban planning, destination management and sustainable development.
Introduction
Urban tourism is associated with activating the local economy and urban vitality, as well as renewing the urban morphology and cultural development (Ashworth & Page, Citation2011; Łapko, Citation2014). However, it may lead to several challenges, such as in terms of the sustainability of social interaction between residents and tourists (Edwards, Griffin, & Hayllar, Citation2008). Excessive tourist activities can also diminish the attractiveness of urban areas for both residents and tourists (Kotus, Rzeszewski, & Ewertowski, Citation2015). When the presence and behaviours of tourists exceed the level of tolerance of residents, several problems may ensue (O’Reilly, Citation1986). The residents of several cities tend to blame tourists for such annoyances as noise, dirt and crowded bars, cafes or public transport (Füller & Michel, Citation2014). The implications of large and increasing numbers of tourists and their activities on urban everyday life stress the necessity to map tourist space usage at various times in the city in order to explore where and when encounters happen.
The analysis of tourist spatio-temporal behaviour in urban destinations involves paying particular attention to their interactions with, trajectories and movements through as well as practices performed in urban spaces within the urban destination – with particular attention for which spaces are being visited at what times (Lew, Hall, & Williams, Citation2004; Md Khairi, Ismail, & Syed Jaafar, Citation2019). Growing academic attention has been paid to this topic, but most studies have focused on tourists’ spatial distributions, movement patterns and the factors influencing their spatio-temporal behaviours within the urban destination (e.g. Bujosa, Riera, & Pons, Citation2015; Lau & McKercher, Citation2006; Zoltan & McKercher, Citation2014). Comparing and combining the patterns of spatio-temporal behaviours of both tourists and residents in one study can actually identify the areas of potential encounters between both groups – i.e. by finding overlaps between where and when both tourists and residents concentrate and generate hotspots in the city. In this context, Paldino, Bojic, Sobolevsky, Ratti, and González (Citation2015) indicated that knowing the behavioural characteristics in various parts of a city may lead to a greater understanding of spatial activity patterns of tourists’ and residents’ in cities. Better understanding the spatio-temporal behaviours of tourists, and residents alike, provides important insights to make services and attractions, the transport system and the marketing strategy of cities more in line with their actual needs and wants (Shoval & Isaacson, Citation2007).
Moreover, studies comparing the spatio-temporal behaviour patterns between tourists and residents have focused on their spatio-temporal behaviours in relatively short periods (García-Palomares, Gutiérrez, & Mínguez, Citation2015; Kádár & Gede, Citation2013; Kotus et al., Citation2015; Li, Zhou, & Wang, Citation2018; Paldino et al., Citation2015). Little attention has been paid to spatio-temporal behaviours from a long-term perspective. Short-term tourist flow studies may already pinpoint several problems related to crowding, congestion and conflicts at particular urban places within specific and limited time periods. However, taking a long-term perspective on spatio-temporal behaviour patterns of tourists as well as residents can reveal on-going trends – and can even be used to predict future scenarios – in terms of tourism-related in a city. The reason for this is that these long-term trends provide indications for where and when tourist and residents have encounters, potentially changing competition for urban space between both groups of users and evolving processes of crowding out and avoidance. Looking at and relating trends in the spatio-temporal behaviour patterns of tourists and residents may indicate the extent in which problems in terms of crowding, congestion and conflict are increasing or decreasing at places on the ‘beaten track’ over time and potentially rising and developing at other places across the city. This will provide us with potential insights that are important for achieving a more sustainable development of cities – and the tourism planners, marketeers and managers involved. This is all the more pertinent these days with increasing numbers of tourists flocking into cities, Hong Kong included.
The aims of the present research were: (1) to explore the temporal behaviour patterns of MCTs and Hong Kong residents in different time periods; (2) to test and compare whether there is a spatial concentration of MCTs’ and residents’ activities in Hong Kong; and (3) to identify the long-term trend in MCTs’ and Hong Kong residents’ spatio-temporal behaviour patterns, and which parts of the city are affected by their activities.
The research was carried out in Hong Kong, which is a typical city within the context of urban tourism in China. Mainland arrivals are Hong Kong’s largest tourist source market. However, the related behavioural data of this largest group of tourists in Hong Kong are still limited and lacking, as also noticed by other authors (e.g. McKercher, Shoval, Ng, & Birenboim, Citation2012). While several studies (e.g. Wang et al., Citation2016; Zhen, Cao, Qin, & Wang, Citation2017) have used the Weibo platform – i.e. one of the most popular online social microblogging and networking platforms in China – to analyse Chinese tourists’ spatio-temporal behaviours in mainland Chinese cities, this study attempted to use Weibo check-in data to differentiate mainland Chinese tourists (MCTs) and residents in Hong Kong and analyse their spatio-temporal behaviour patterns in this city.
This paper is structured as follows. The following section presents a literature review of studies on tourists’ and residents’ spatio-temporal behaviour patterns. The third section clarifies the research design for this analysis, including data collection and methodology. The results are discussed in the fourth section. The final two sections present the conclusions and a discussion, which includes the limitations of this study, implications for tourism planning, marketing and managment as well as possible future research directions.
Literature review
Distinction between tourists and residents
Today, tourism takes place in and across a large variety of spaces within cities, such as historic urban cores, theme parks and museums as well as local neighbourhoods, shopping malls and markets (Gospodini, Citation2001). While being mobile at the intra-destination and intra-attraction but also inter-destination scales (e.g. Lau & McKercher, Citation2006; Vu, Li, Law, & Ye, Citation2015; Zheng, Huang, & Li, Citation2017), tourists make use of various city facilities and services, including transport and accommodation, that are not provided for tourists exclusively (Ashworth, Citation2012). The city is multifunctional in nature and a large variety of users – including residents and tourists – are making use of its resources – including shops, restaurants, museums and monuments – for diverse reasons and purposes in often the same urban spaces (Ashworth & Page, Citation2011; Burtenshaw, Bateman, & Ashworth, Citation1991). Based on how the city is being used, it is highly complicated, and increasingly so, to make a distinction between tourists and residents as separate dichotomous categories (Ashworth, Citation1989; Hultman & Hall, Citation2012) and the same can be argued for making a distinction between the activity spaces of tourists and residents in contemporary cities (Judd, Citation2003). For example, tourists increasingly prefer to experience foreign cities ‘off the beaten track’ and seek for participating in daily activities in local neighbourhoods beyond the city centre, also facilitated by Airbnb. At the same time, residents aim to find and experience the unfamiliar and extraordinary when shopping for recreational motives in the city centre of their hometown.
Looking at the origin of users of the city, already hinted at in the examples above, is often used to still make a distinction between residents – i.e. living inside the city – and tourists – i.e. coming from outside the daily urban system (Ashworth & Tunbridge, Citation2000). Growing numbers of these ‘outsiders’ are considered to give rise to a variety of social tensions and conflicts in many urban contact zones in tourist destinations. Tourists even seems to push out residents in some urban areas with the latter applying strategies of avoidance in both time and space (Popp, Citation2012). Tourist and residents are not set apart (Ashworth, Citation2012) but increasingly share and compete for the use of the same spaces and facilities within cities (Pearce, Citation2001), which can be witnessed from analysing and comparing their spatio-temporal behaviour patterns in cities.
However, little empirical evidence has captured the differences between tourists’ and residents’ behaviour patterns in time and space from a long-term perspective. This is all the more pertinent in times of increasing mobility, when a large number of tourists flock into cities and create many opportunities for encounters between tourists and residents, as well as challenges in terms of congestion, crowding and potential conflicts in urban contact zones. Analyzing and comparing the spatio-temporal behaviour patterns and the long-term dynamics of tourists and residents is the foundation to explore when and where encounters between the two parties potentially occur in cities, and possible influences that would follow.
Spatio-temporal behaviour patterns
For comparison of spatio-temporal behaviour patterns of tourists and residents, we will discuss both the spatial and temporal dimensions of their activities as performed in the city (Zhao, Forer, & Harvey, Citation2008) – while paying particular attention to which place tourists and residents may interact with at which time (Lew et al., Citation2004).
According to Lew and McKercher (Citation2004), urban tourists are distributed unevenly in time and space. More specifically, Ashworth and Page (Citation2011) indicated that activity areas of tourists are limited because their individual space–time budgets are more severely restricted than those of residents, resulting in a distinctive, more concentrated usage of cities. A study by García-Palomares et al. (Citation2015) confirmed the higher spatial concentration of tourists’ activities as compared with residents’ activities by analyzing tourist hotspots in eight European cities. Vu et al. (Citation2015) added a Hong Kong perspective to this by identifying seven key areas of interest for inbound tourists, which were mostly concentrated in the downtown zone of the city. As such, popular attractions and access routes were frequently overcrowded and overexploited, whereas the others were mostly ignored (Shoval, Citation2008). Examining how tourists move around when in Hong Kong, Lau and McKercher (Citation2006) revealed that the spatial activity pattern of repeated tourists was more dispersed than that of first-time tourists although still concentrated in the central urban areas.
While comparing the behaviour patterns of tourists and residents, Paldino et al. (Citation2015) confirmed that tourists are more active in the central urban areas that have a city’s landmarks (e.g. Times Square in New York), while residents are more active in spaces for socializing, such as parks, squares or sport facilities. In this context, Kotus et al. (Citation2015) proposed a model under tourist influence to describe the urban areas where tourists and residents concentrate. According to the model, tourists mainly concentrate in central areas, while residents have taken control of such areas outside central parts as recreation areas and historic neighbourhoods. So, while both tourists and residents visit a city’s most representative sites, residents have a more extensive activity radius and spend time at sites rarely visited by tourists, outside the central area and on the periphery of the city (García-Palomares et al., Citation2015; Kádár & Gede, Citation2013), reflecting the relatively more dispersed spatial behaviour of residents compared to tourists.
In addition to the spatial dimension, the temporal dimension is also strongly embedded in tourists’ and residents’ behaviour patterns. The ‘temporal behaviour’ of tourists and residents is reflected in their temporal variation and length of stay at specific places in a city. To start with, urban tourists and their activities are not only distributed unevenly in space but also in time, according to Lew and McKercher (Citation2004). Looking daily, weekly and holiday-related variations in particular, Li et al. (Citation2011) confirmed the uneven distribution in time for activities of Chinese tourists in the town of Lijiang. These tourists appeared to be more active in specific time periods during the day – i.e. in the late morning and afternoon – as well as at night. In addition, they found that there were more tourists around on Sunday than on weekday and that the town was also a highly popular tourist destination during holidays in August. Liu and Shi (Citation2019) confirmed the higher activity levels of tourists on weekends and holidays compared with working days for the city of Hangzhou. According to Liu, Kang, Gong, and Liu (Citation2016), the temporal activity pattern of residents in the city was strongly regular at the collective level but may still differ substantially at the individual level due to different rountines and schedules. For weekdays they found common activity peaks, including in the morning for travelling from a residential area towards a business area and back again in the evening as well as around noon in commercial areas for lunch. Moreover, Jia and Jiang (Citation2012) found an important difference between weekdays and weekends with a high activity peak during the nights in the latter as opposed to the former. Interestingly, Birenboim, Anton-Clavé, Russo, and Shoval (Citation2013) added – by studying tourists in a theme park setting – that the uneven temporal activity pattern of tourists was similar during low and high season and therefore rather stable and repeatable – regardless of factors including queues and weather. Considering the length of stay, Li et al. (Citation2011) additionally indicated that most tourists stayed in the town of Lijiang for no more than two days. While tourists may often stay longer in larger towns or cities with more and more diverse tourist attractions and facilities, some may as well visit the same destination only for a couple of hours when on a day trip in a relatively close-by destination (Stetic, Simicevic, & Stanic, Citation2011). Md Khairi et al. (Citation2019) added that tourists spend most of their time during the limited stay in urban spaces where tourist highlights in terms of heritage and facilities are concentrated – areas in which residents spend much less time on a daily, weekly or yearly basis. In this context, the model proposed by Kotus et al. (Citation2015) is of interest because it indicated that residents during daily life in the city spent relatively more time outside the central areas of tourist destinations. The temporal behaviour pattern of tourists tends to be the outcome of short-term decisions related to the length of stay or purpose of the visit, whereas the temporal behaviour pattern of residents tends to stem from long-term decisions regarding, for example, career choice and selection of workplace and place of residence (Isaacson & Shoval, Citation2009).
Mapping, modelling and predicting
The methods and technologies that are often used to map, model and predict spatio-temporal behaviour patterns include trip diaries, questionnaire surveys, GPS logging mobile phone tracking, sequence alignment and Markov-based models (e.g. Grinberger, Shoval, & McKercher, Citation2014; Raun, Ahas, & Tiru, Citation2016; Shoval, McKercher, Birenboim, & Ng, Citation2015; Xia, Zeephongsekul, & Arrowsmith, Citation2009, Citation2011; Zheng et al., Citation2017). Nowadays, a growing number of studies use social media sources to analyse spatio-temporal behaviour, including geotagged photos such as on Flickr, Facebook messages, Foursquare check-ins and Weibo check-ins (e.g. Li et al., Citation2018; Liu & Shi, Citation2019; Vu, Li, Law, & Zhang, Citation2018; Wang et al., Citation2016; Yoo & Lee, Citation2015).
For the analysis of the spatio-temporal behaviour of tourists and residents, social media based studies commonly apply two methods for differentiation purposes, related with the origin of users (Girardin, Dal Fiore, Blat, & Ratti, Citation2007; Gu, Zhang, Chen, & Chang, Citation2016; Hawelka et al., Citation2014; Kádár & Gede, Citation2013). The first method is based on the place of registration linked with the user ID. For instance, Gu et al. (Citation2016) identified the origins of social media users (i.e. resident vs non-resident) based on the location selected during the process of registering a user ID. However, errors may occur when the location selected is not the real location of residence or when it changes and is not updated. The second method is to make use of how long a person remains at a location, which is then regarded as the criterion to determine whether messages or photos can be attributed to tourists or residents. Girardin et al. (Citation2007) set a threshold of 30 days to differentiate residents from tourists, a criterion that has since been adopted by most studies (e.g. García-Palomares et al., Citation2015). Social media users were considered tourists if they were active in the urban area within the 30-day bandwidth; otherwise, they were categorized as residents (García-Palomares et al., Citation2015). However, errors may occur when tourists visit the same destination on a frequent basis or when people are daily commuters. In an attempt to reduce errors related with tourist–resident differentiation as much as possible, we made a combination of both methods discussed by applying a process of ‘double filtration’ – as will be explained next.
Research design
Study area: Hong Kong as an urban destination
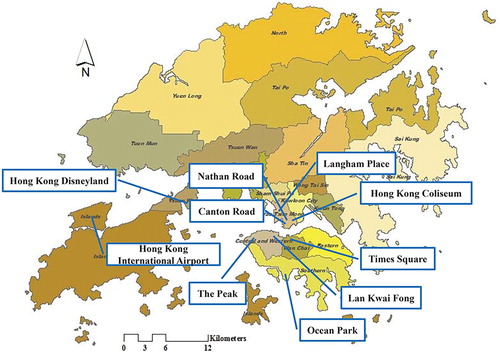
Hong Kong consists of Hong Kong Island, Kowloon, the New Territories and some 262 outlying islands. It is a spatially dispersed urban destination with lots of scattered tourist attractions. There are two central cores, one on Hong Kong Island and the other in the Tsim Sha Tsui area of Kowloon – both with a concentration of well-known tourism highlights (). However, tourists are also increasingly spreading to areas beyond outside the ‘beaten track’ to explore and experience the cultural diversity and authenticity of a variety of neighbourhoods, such as Tai Koo Shing (Prendergast, Lam, & Ki, Citation2016). With its variety of high-quality tourist attractions, Hong Kong is one of the most popular destinations in Asia (e.g. Tsui, Yuen, & Fung, Citation2018). The total number of tourist arrivals reached about 65.1 million in 2018 with a growth of more than 11% compared to 2017. Hong Kong’s top ten tourist source markets were mainland China, Taiwan, South Korea, Japan, United States, the Philippines, Singapore, Australia, United Kingdom and Thailand, which together accounted for over 92% of the total number of tourist arrivals. Tourist arrivals from mainland China, which is Hong Kong’s largest tourist source market, reached 51.0 million in 2018 – making up for about 78% of the total arrivals in that year (HKTB Research, Citation2019).
Figure 1. Hong Kong administrative map and main sites for tourists.
Weibo data collection and tourist-resident differentiation
Weibo users can share their location through the platform’s ‘check-in’ function, which is a geotagged location service. ‘Check-in’ means that users confirm or share their location on a social network website when they participate in activities at that location (Todd, Campbell, Meyer, & Horner, Citation2008; Zhen et al., Citation2017). These geo-tagged records (check-ins) of millions of Weibo users can be a source of data for the analysis of human spatio-temporal behaviours, because Weibo provides a public application programming interface (API) for app developers to search and download the check-in messages (Wang et al., Citation2016; Zhang, Derudder, Wang, Shen, & Witlox, Citation2016). Both people in mainland China and beyond, including in Hong Kong, can use Weibo whereas the former cannot officially use other social network platforms such as Facebook and Twitter. According to the Weibo Data Center (Citation2019), the number of monthly active Weibo users in China reached 462 million in December 2018 – which is about a third of the entire population. In addition, a recent survey among Chinese of internet users aged 16–64 shows that the Weibo penetration is 31% in mainland China and 18% in Hong Kong (We Are Social, Citation2018). As such, Weibo provides an interesting opportunity to compare the spatio-temporal behaviour of MCTs and residents in Hong Kong based on the same data source. We called open APIs on the Weibo open platform to obtain user attribute information (e.g. place of registration and gender) and locations of check-ins from 2012 until 2016. We pre-processed the data by removing check-ins with missing coordinates or missing user attributes, and records of check-ins at locations outside Hong Kong. This process led to a total of 1,539,558 check-ins.
For a more accurate differentiation between tourists and residents, we combined two filters related with the origin of Weibo users in Hong Kong – as also shows. When applying filter 1, we calculated the interval between the first and the last time stamp of Weibo user check-ins in Hong Kong. If the interval is no more than 30 days, we provisionally labelled the Weibo user as a tourist; otherwise, the user was provisionally labelled as a resident. After that, we additionaly applied filter 2. We further filtered the dataset by taking the place of registration linked with the user ID into account. If the time interval is more than 30 days and the user ID was registered in Hong Kong, we regarded the Weibo user as a Hong Kong resident – and the users under consideration with an ID registered outside Hong Kong were removed from the dataset. If the time interval is no more than 30 days and the user ID was registered in mainland China, we regarded the Weibo user as a MCT – and the users under consideration with an ID registered outside mainland China were removed from the dataset. This resulted in the identification of 372,786 residents’ check-ins and 643,042 MCTs’ check-ins ().
Figure 2. Process flow.
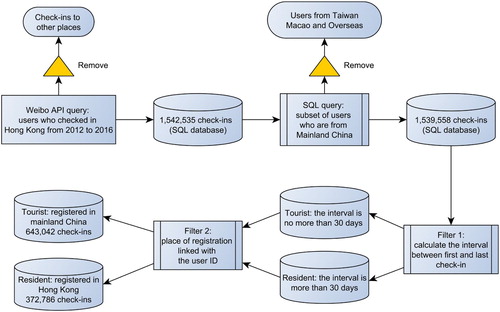
Table 1. User Segmentation based on ID registration place and check-in duration in Hong Kong.
Weibo data and spatial-temporal analysis
For the analysis of the temporal patterns of MCTs’ and residents’ activities, different time intervals were explored. We charted the averages of MCTs’ and residents’ check-in frequencies on a timeline, that is, per year, season, month and day of the week. To differentiate between the four seasons, we made use of the ‘weather divisions’ definition in China, which is based on the solar calendar. Specifically, spring refers to March–May, summer to June–August, autumn to September–November and winter to December–February. For the analysis of weekly patterns, we also included the ‘Golden Week’ holidays in our study, and in particular the Chinese Lunar New Year and the National Day.
To analyse spatial patterns in user activities, we plotted and compared the density distributions of check-ins by residents and MCTs in the Hong Kong area for all five years (i.e. 2012–16) together. Kernel density analysis was used to make heat maps examining the spatial distribution of check-ins. The kernel density estimation calculation formula is as follows:where n is the sample size, h is the search radius (or bandwidth), K is a function evaluated at (x–Xi)/h, and f(x) is the kernel density estimate, which is the weighted average of points near x. The surface value is highest at the location of the point Xi and diminishes with increasing distance from that point, reaching zero at the search radius distance from the point. Combined with the search radius setting principle, we used the default search radius (bandwidth) through ArcGIS 10.2.1 to calculate the kernel density estimation results.
We applied the incremental mean threshold approach (Chainey, Reid, & Stuart, Citation2002) to help standardize the legend threshold settings of the kernel density estimation hotspot maps. The reason is that increments of the mean can clearly reflect increases in values and their relative significance. The authors just mentioned applied incremental mean threshold approach on crime distribution and pointed at a hotspot status being reached at three multiples of the mean grid cells’ value and above. Following this approach, our calculations for the mean were applied only to grid cells that have a value greater than 0 and are within the study area boundary. The grid cell thematic thresholds were set at 0 to mean, mean to 2 mean, 2 mean to 3 mean, 3 mean to 4 mean, 4 mean to 5 mean and greater than 5 mean.
For the analysis of general spatio-temporal trends over 5 years, we applied the mean centre point – following the approach by Eck, Chainey, Cameron, & Wilson, Citation2005 – to explore differences and similarities in spatial distributions between and among tourists and residents in Hong Kong for each year from 2012 until 2016. For a more detailed analysis of the spatio-temporal trends in behaviour patterns, we plotted and compared the density distributions of check-ins by residents and MCTs in the Hong Kong area for each of the five years through the combination of kernel density analysis and incremental mean threshold approach described above.
Results: behaviour patterns of MCTs and residents in Hong Kong
Descriptive results: MCTs’ origin
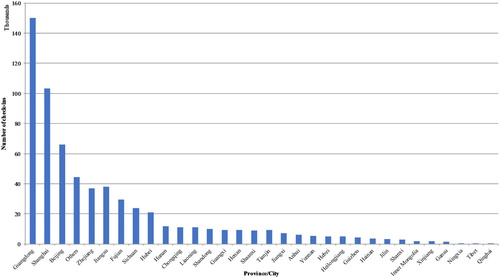
shows that most MCTs’ check-ins were made by tourists from Guangdong Province, followed by Shanghai and Beijing. A substantial proportion of MCTs’ check-ins were made by tourists from the eastern provinces (e.g. Jiangsu, Zhejiang and Fujian). Tourists from underdeveloped areas, such as the western provinces (e.g. Tibet and Qinghai), had the least number of MCTs’ check-ins. There may be various reasons for the observed differences. Zhang and Qu (Citation1996), for instance, found that people from Guangdong were more likely to make trips to Hong Kong because of the close geographic proximity of and strong family ties between the areas. The large proportion of tourists from places such as Shanghai and Beijing may be explained by the Chinese tourism policy regime, particularly the Individual Visit Scheme (Lam & Zhang, Citation1999). Moreover, differences in terms of the national distribution of Weibo users, and of internet adoption more generally, may have had some effects on the results. According to the 2017 ‘Weibo user development report’ (Weibo Data Center, Citation2017), the relative number of active Weibo users in central-southern and eastern China is much higher than the national average. This may be due to a high correlation between the internet development level and the economic growth rate in different regions, with the highest internet penetration rates mainly in the more developed eastern provinces, and the lowest rates mainly in the often less developed southwestern provinces (CNNIC, Citation2018).
Figure 3. Frequencies of tourists’ check-in activities from different provinces or provincial-level cities in mainland China.
Temporal patterns
shows that the number of MCTs’ check-ins increased from 2012 until 2013, decreased in 2014, then underwent a slight increase in 2015 and a sharper increase in 2016, returning to a situation comparable to that in 2013. Tourism in general is an industry that is extremely influenced by societal, economic, political and natural aspects, including crises and disasters (Ritchie, Citation2004). The development of the internet and social media has changed the traditional top-down spread of access to information in the event of a crisis (Lachlan, Spence, Lin, Najarian, & Del Greco, Citation2016). In this context, the decline in 2014 can be attributed to the anti-corruption campaign and the related turmoil in China. The topics that Weibo users discussed regarding ‘Occupy Central’ in Hong Kong in 2014 shifted from a political event to a tourism boycott (Luo & Zhai, Citation2017). In addition, the number of residents’ check-ins continued to fall gradually after peaking in 2013. This may be because Weibo is less popular in Hong Kong than Facebook and Twitter, with initial enthusiasm for Weibo decreasing gradually after 2013.
Figure 4. Pulse in average number of check-ins for users (tourists ‘red line’ vs residents ‘blue line’) for each year, season of the year, month of the year, day of the week, and The Golden Week (the ‘Chinese Lunar New Year Golden Week’ and the ‘National Day Golden Week’) during 5-year period (2012–2016) in Hong Kong.
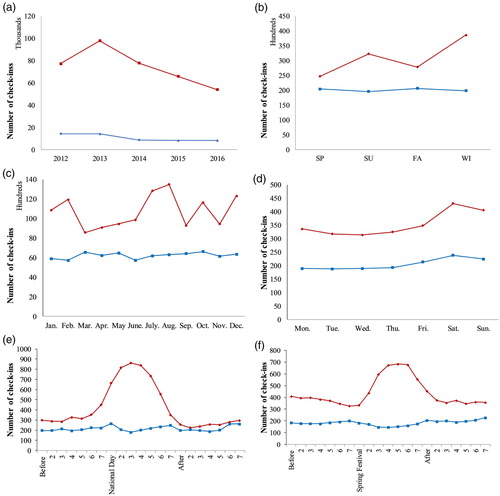
Looking at the seasonal distribution of MCTs’ and residents’ check-ins also reveals significant temporal differences. The frequency averages show two peaks in MCTs’ check-ins, namely in the summer and the winter. This might be due to summer holidays and the Spring Festival, respectively. Residents’ activities showed only a slight increase during the spring and autumn, and overall they are quite stable. The monthly pulse of MCTs’ check-ins also shows larger variations than the pulse of residents’ check-ins. The monthly distribution shows a pattern that is generally comparable to the seasonal pattern, but also provides interesting and explanatory details regarding peaks in MCTs’ check-ins. Peaks in February, July–August, October and December may be caused by the public holidays, such as the Spring Festival and the National Day.
shows that MCTs’ and residents’ check-ins during the week have a similar pattern overall, with higher levels of activity at weekends, although the differences between weekdays and weekends are much more significant for MCTs than for residents. Higher frequencies of Weibo check-ins at weekends in general may be explained by the fact that tourism and leisure activities often merit more sharing and memorizing than daily activities and routines (Liu & Shi, Citation2019). Not only weekends but also holidays are the most obvious periods that motivate intercity travel flows (Liu & Shi, Citation2019). The Chinese central government enacted the Golden Week holiday system in 1999 as a pro-tourism policy to stimulate domestic tourism and the related demand (Wu, Xue, Morrison, & Leung, Citation2012), resulting in highly divergent week patterns of MCTs’ check-ins. For both the Chinese Lunar New Year Golden Week (spring festival) and the National Day Golden Week, we found that MCTs’ checks-ins peaked halfway through the week, while residents’ check-ins were much more stable during the week despite a slight dip halfway.
Altogether, in line with evidence from previous studies, we found that the temporal pattern of MCTs’ activities in Hong Kong varies much more than that of residents’ activities – which are much less variable and often rather stable over time – for year, season, month and day of the week as time intervals.
Spatial patterns
shows the spatial distribution of MCTs’ and residents’ activities in Hong Kong based on their check-ins. It can be clearly seen that MCTs’ activities are much more concentrated than those of residents. MCTs were highly active in the Tsim Sha Tsui area and at the airport, while residents were highly active in the same areas but also in the Causeway Bay, Central, Hung Hom, Mong Kok and Kowloon Tong areas and to a much lesser extent in several areas in the New Territories. Zooming in on the central districts of Hong Kong reveals that the most popular area for both MCTs and residents is the Tsim Sha Tsui area of Kowloon, while residents also like visiting the Causeway Bay area on the Island. The reason for these hotspots probably is that most tourist highlights and most of the popular shopping, nightclub and restaurant facilities are concentrated in these central areas (Lau & McKercher, Citation2006).
Figure 5. Kernel density estimation hot spot maps for tourists’ and residents’ check-in activity in Hong Kong during 5 years (2012–2016) on Weibo, using the incremental mean approach.
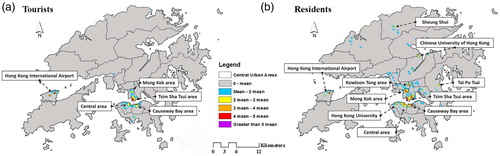
The Tsim Sha Tsui area consists of a lot of shopping malls and restaurants, which may be why it attracted large numbers of MCTs and residents. The airport is a hotspot for both MCTs and residents, because it is a national and an international transit hub (Tsui et al., Citation2018). The Causeway Bay area has lots of landmarks and facilities for MCTs and residents, such as Times Square, Sogo and Hysan Place, offering shopping malls and office buildings. Hung Hom district has the Hong Kong Coliseum and many streets lined with restaurants, hotels, schools, temples and local markets. These areas satisfy many locals’ living needs, so residents extend their activity radius to these areas. Those residents, as well as MCTs, who checked in while in the Mong Kok area were mostly concentrated in Langham Place and surrounding areas, which are mainly shopping areas, with both shopping malls and local markets. Furthermore, Kowloon Tong is a low-density residential area with universities, such as the Hong Kong Baptist University and the City University of Hong Kong.
MCTs’ spatial activities were more concentrated than those of residents, which is also consistent with previous studies (García-Palomares et al., Citation2015; Kádár & Gede, Citation2013). Specifically, we found that MCTs were concentrated in central urban areas and at the airport, while residents also moved to suburban and exurban areas. The hotspots we found in Hong Kong are similar to those previously identified by Vu et al. (Citation2015), who studied inbound tourists.
Spatial–temporal trends
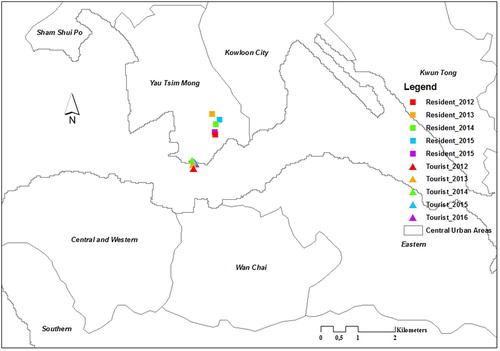
We calculated the mean centre points of tourists’ and residents’ activities for five years using check-in point data, to compare the general spatial distribution of activities and to measure trends in these spatial distributions over five years. The annual changes in the general distribution of MCTs’ and residents’ activities are presented in , with a focus on the central urban areas of Hong Kong. Overall, the mean centres of residents’ activities in 2012–16 are further north than those of MCTs’ activities, but all of them are located in the Kowloon area. Over time, the mean centre of residents’ activities had the most southerly position in 2012 and the most northerly position a year later. After that, the mean centre gradually moved back, while also moving up and down over the years, to almost the same starting position as in 2012. The mean centre of MCTs’ activities also had the most southerly position in 2012. Over the years, the MCTs’ activities had a tendency to gradually move in a northerly direction, bending back after 2014 towards the starting position of the mean centre in 2012.
Figure 6. Mean center points for tourists’ and residents’ check-in activity in the Central Urban Areas of Hong Kong from 2012 until 2016.
To get a better understanding of the general trends revealed by the mean centre point analysis, we compared the five-year hotspot maps for MCTs and residents and combined them with OpenStreetMap ( and ). It shows that MCTs’ activities were mostly concentrated in the central urban areas of Hong Kong in particular – i.e. Tsim Sha Tsui, Mong Kok, Central and Causeway Bay areas. By contrast, residents’ check-ins occurred at dispersed locations, and most locations were in adjacent areas. Nevertheless, Tsim Sha Tsui, Mong Kok, Hung Hom and Causeway Bay were the most popular areas for residents. For an analysis of long-term trend in the spatio-temporal behaviour patterns of MCTs and residents, we categorized the most popular locations and their dynamics into different patterns of hotspots, namely rising hotspots, persistent hotspots and declining hotspots. A rising hotspot is a location with a trend indicating an increase in the concentration of activities over time. A persistent hotspot is a location with no trend indicating an increase or decrease in the concentration of activities over time. Finally, a declining hotspot is a location with a trend indicating a decrease in the concentration of activities over time.
Figure 7. Kernel density estimation hot spot maps for tourists’ and residents’ check-ins in Central Urban Areas of Hong Kong from 2012 until 2016, using the incremental mean approach.
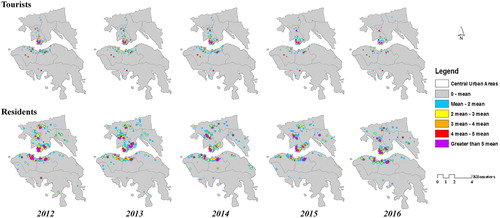
Figure 8. Taking the hot spot maps for (a) tourists’ and (b) residents’ check-ins in Central Urban Areas of Hong Kong in 2012 as examples.
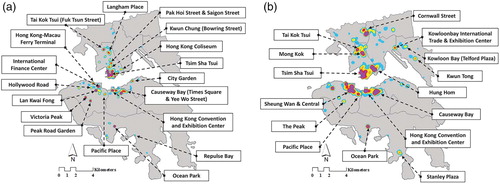
For MCTs, the persistent hotspots included Canton Road (in Tsim Sha Tsui), Langham Place (in Mong Kok), International Finance Centre (in Central), Lan Kwai Fong (in Central), Times Square (in Causeway Bay), The Peak, Hong Kong Coliseum (in Hung Hom) and Ocean Park. The rising hotspots included The University of Hong Kong and Repulse Bay. The declining hotspots included Nathan Road, Tai Kok Tsui, Hollywood Road, Kwun Chung, Pacific Place and City Garden. These different long-term patterns of hotspots might be caused by several factors related to tourism demand, travel motivation and MCT preferences. For example, the popularity of Langham Place and Ocean Park was stable, potentially because they satisfied MCTs’ demand for shopping and entertainment, respectively. Repulse Bay’s increased popularity may be caused by increasing leisure activities. Pacific Place is a complex of office buildings, hotels and a shopping mall. It became less popular among MCTs, perhaps because MCTs’ consumption pattern is changing with less interest in luxury goods offered by Pacific Place. Overall, the trends in the spatio-temporal behaviour patterns of MCTs over five years reveal that the popularity of locations in the central urban areas tended to be relatively fixed while their activities in local neighbourhoods and residential quarters (e.g. Tai Kok Tsui and Kwun Chung) decreased.
For residents, the persistent hotspots included Tsim Sha Tsui, Mong Kok, Hung Hom, Central and Causeway Bay. The rising hotspots included Kowloon Bay, Telfort plaza and Kwun Tong. The declining hotspots included The Peak, Ocean Park, Pacific place and Hong Kong-Macau Ferry Terminal. These different long-term patterns of hotspots were probably associated with several variables related to daily needs, commuting practices and leisure preferences. For example, Fuk Tsun Street and adjacent streets in Tai Kok Tsui offer a diversity of hardware shops, restaurants, temples, shopping malls and markets. These areas offer the basic living needs of residents, such as household goods, food, clothing and daily necessities. Residents’ decreased enthusiasm for such locations as Terminal, The Peak and Ocean Park was probably due to a change in daily activity patterns and strategies for avoiding MCTs. Related with this, residents were also quite active in Kowloon Bay, including Telford Plaza, possibly because Telford Plaza is a shopping centre for locals and few MCTs shop there. Overall, the trends in the spatio-temporal behaviour patterns of residents over five years reveal that the popularity of typical tourist highlights decreased. At the same time, their activities in other MCT hotspots – Tsim Sha Tsui, Mong Kok, Hung Hom, Central and Causeway Bay in particular – were more stable.
Comparing the persistent hotspots of MCTs and residents reveals a great deal of overlap between their activity areas in Hong Kong, providing many opportunities for encounters between them. Activities of both MCTs and residents were highly concentrated in particular locations of Tsim Sha Tsui, Mong Kok, Hung Hom, Central and Causeway Bay. Most interactions between both groups will probably occur in locations such as International Finance Centre (in Central), Canton Road (in Tsim Sha Tsui) and Times Square (in Causeway Bay). Additionally, several locations such as Tai Kok Tsui (in Mong Kok) and Hollywood (in Central) remained highly popular among residents over time but their popularity among MCTs declined – decreasing the potential for encounters between both groups in these locations. The same goes for some of the tourism highlighs such as The Peak and Ocean park but then due to a combination of stable and highly popularity among MCTs and declining popularity among residents.
Conclusions and discussion
In this paper, we identified and compared the spatio-temporal behaviour patterns of mainland Chinese tourists and residents in Hong Kong over a period of five years. We contributed to the current tourism literature by (a) comparing the behaviour patterns of tourists and residents in one study – while most studies focus on tourist movements (e.g. Bujosa et al., Citation2015; Zoltan & McKercher, Citation2014), (b) applying a process of ‘double filtration’ to more accurately differentiate tourists from residents – while most studies apply one filter (e.g. García-Palomares et al., Citation2015; Gu et al., Citation2016), and (c) revealing long term trends in behavioural patterns – while most studies have a more short term perspective (e.g. Li et al., Citation2018; Paldino et al., Citation2015).
Our results show that the behaviours of MCTs in Hong Kong are more spatially concentrated, especially in the central urban areas. The spatial behaviours of residents were more dispersed in the sense that they also visit suburban and exurban areas. Looking at the time dimension revealed that the behaviours of MCTs vary significantly during the week and between months and seasons. However, the temporal behaviours of residents appeared to be relatively stable. From a long-term perspective, MCTs’ preferences for locations tended to be relatively fixed. In addition, their activity in local neighbourhoods and residential quarters decreased. Typical tourism highlights in Hong Kong, such as the Peak and Ocean Park, revealed a decline in activities by its residents. Other urban areas such as Tsim Sha Tsui, Mong Kok, Hung Hom, Central and Causeway Bay were persistently popular among residents. Most interactions between tourists and residents are therefore likely to occur in locations within the latter areas while the potential for encounters appears to have decreased in local residential neighbourhoods and typical tourism highlights.
These results are important for both tourists and residents, because information about the concentration and dispersion of tourists’ and residents’ activities can help them to plan their itineraries, allocate their time budgets and select areas to visit – including places of interest they are unfamiliar with. The results can also be used by the tourism industry for destination marketing and management. Knowing which areas tourist find attractive may help in developing and fine-tuning marketing campaigns. Knowing that a particular area is decreasing in popularity over time may signal that the supply of services and facilities needs to be changed. The results also provide signs of potential overcrowding in specific urban areas, when taking indications of avoidance behaviour by residents into account in particular (in the case of declining popularity of typical tourist highlights among residents). This information can be helpful for policy makers and planners aiming to promote more socially sustainable tourism and striving for a more harmonious relationship between tourists and residents in the city. Based on our results, unfamiliar and underdeveloped tourist areas as well as new attractions outside the ‘beaten track’ – i.e. outside the main tourist hotspots – could be selected, developed and marketed to spread tourists to much less crowded spaces in the city. For spreading the flow of tourists in time, the city of Hong Kong could make use of the visa system for mainland Chinese tourists – possibly relaxing restrictions on tourist arrivals on weekdays and in autumn and winter, but tightening up at weekends and during holidays. After the implementation of policy changes, our analysis with a long-term perspective may be used to monitor changes in spatio-temporal behaviour of MCTs and residents in the city.
The data from Weibo check-in records proved highly useful for analysing spatio-temporal behaviour patterns in Hong Kong. First of all, the geo-tagged and time-stamped data extracted from the Weibo platform enables detailed measures to differentiate tourists and residents – based on their origin and length of stay. Secondly, as social media platform allows the extraction of check-in data over years or even decades, taking a long-term perspective on spatio-temporal behaviour patterns of tourists and residents is feasible. In so doing, we are able to trace trends in (overlaps between) where and when both groups concentrate and generate hotspots in the city. Thirdly, the Weibo platform enables an analysis of spatio-temporal behaviour patterns of tourists and residents based on the same data source, avoiding several technical issues and biases when trying to combine different data sources.
However, the data from Weibo check-in records also entailed limitations for our analysis of which we want to discuss two in more detail here. First, not all MCTs may make use of the Weibo platform when visiting Hong Kong and residents often make more use of other social network platforms than Weibo. Together, this implies that the results could be biased – because the data may represent specific subsets of MCTs and residents in Hong Kong – and therefore should be interpreted with care. Ground-proofing the results with other data sources will be helpful in better assessing the quality and reliability of Weibo data for analysing spatio-temporal behaviour patterns. Second, underlying factors explaining the spatio-temporal behaviours of MCTs and residents have been discussed in this study but not analysed in detail. In future work we will focus on analysing behavioural characteristics, motivations, attitudes and perceptions of different types of tourists in Hong Kong as increasingly important users of the city.
Disclosure statement
No potential conflict of interest was reported by the authors.
Additional information
Funding
References
- Ashworth, G. J. (1989). Urban tourism: An imbalance in attention. Progress in Tourism, Recreation and Hospitality Management, 1, 33–54.
- Ashworth, G. J. (2012). Do we understand urban tourism?. Journal of Tourism & Hospitality, 01(4), 1–2.
- Ashworth, G., & Page, S. J. (2011). Urban tourism research: Recent progress and current paradoxes. Tourism Management, 32(1), 1–15.
- Ashworth, G. J., & Tunbridge, J. E. (2000). The tourist-historic city. London: Routledge.
- Birenboim, A., Anton-Clavé, S., Russo, A. P., & Shoval, N. (2013). Temporal activity patterns of theme park visitors. Tourism Geographies, 15(4), 601–619.
- Bujosa, A., Riera, A., & Pons, P. J. (2015). Sun-and-beach tourism and the importance of intra-destination movements in mature destinations. Tourism Geographies, 17(5), 780–794.
- Burtenshaw, D., Bateman, M., & Ashworth, G. (1991). The European city: A western perspective. New York: Halsted Press.
- Chainey, S., Reid, S., & Stuart, N. (2002). When is a hotspot a hotspot? A procedure for creating statistically robust hotspot maps of crime. Innovations in GIS, 9, 21–36.
- CNNIC. (2018, January). Statistical report on internet development in China. Retrieved from https://cnnic.com.cn/IDR/ReportDownloads/201807/P020180711391069195909.pdf
- Eck, J., Chainey, S., Cameron, J., & Wilson, R. (2005). Mapping crime: Understanding hotspots. Washington, DC: National Institute of Justice.
- Edwards, D., Griffin, T., & Hayllar, B. (2008). Urban tourism research: Developing an agenda. Annals of Tourism Research, 35(4), 1032–1052.
- Füller, H., & Michel, B. (2014). ‘Stop being a tourist!’ New dynamics of urban tourism in Berlin-Kreuzberg. International Journal of Urban and Regional Research, 38(4), 1304–1318.
- García-Palomares, J. C., Gutiérrez, J., & Mínguez, C. (2015). Identification of tourist hot spots based on social networks: A comparative analysis of European metropolises using photo-sharing services and GIS. Applied Geography, 63, 408–417.
- Girardin, F., Dal Fiore, F., Blat, J., & Ratti, C. (2007, November). Understanding of tourist dynamics from explicitly disclosed location information. 4th International Symposium on LBS and Telecartography, Hong Kong.
- Gospodini, A. (2001). Urban design, urban space morphology, urban tourism: An emerging new paradigm concerning their relationship. European Planning Studies, 9(7), 925–934.
- Grinberger, A. Y., Shoval, N., & McKercher, B. (2014). Typologies of tourists’ time–space consumption: A new approach using GPS data and GIS tools. Tourism Geographies, 16(1), 105–123.
- Gu, Z., Zhang, Y., Chen, Y., & Chang, X. (2016). Analysis of attraction features of tourism destinations in a mega-city based on check-in data mining – A case study of Shenzhen, China. ISPRS International Journal of Geo-Information, 5(11), 210.
- Hawelka, B., Sitko, I., Beinat, E., Sobolevsky, S., Kazakopoulos, P., & Ratti, C. (2014). Geo-located Twitter as proxy for global mobility patterns. Cartography and Geographic Information Science, 41(3), 260–271.
- HKTB Research. (2019, March). Visitor arrivals to Hong Kong in January 2019. Retrieved from https://partnernet.hktb.com/filemanager/intranet/pm/VisitorArrivalStatistics/ViS_Stat_E/VisE_2018/Tourism%20Statistics%2012%202018_R1.pdf
- Hultman, J., & Hall, C. M. (2012). Tourism place-making: Governance of locality in Sweden. Annals of Tourism Research, 39(2), 547–570.
- Isaacson, M., & Shoval, N. (2009). Tourist mobility and advanced tracking technologies. New York: Routledge.
- Jia, T., & Jiang, B. (2012). Exploring human activity patterns using taxicab static points. ISPRS International Journal of Geo-Information, 1(1), 89–107.
- Judd, D. R. (2003). Visitors and the spatial ecology of the city. In M. Hoffman, S. Fainstein, & R. Judd (Eds.), Cities and visitors: Regulating people, markets, and city space (pp. 23–38). New York, NY: Blackwell.
- Kádár, B., & Gede, M. (2013). Where do tourists go? Visualizing and analysing the spatial distribution of geotagged photography. Cartographica: The International Journal for Geographic Information and Geovisualization, 48(2), 78–88.
- Kotus, J., Rzeszewski, M., & Ewertowski, W. (2015). Tourists in the spatial structures of a big Polish city: Development of an uncontrolled patchwork or concentric spheres? Tourism Management, 50, 98–110.
- Lachlan, K. A., Spence, P. R., Lin, X., Najarian, K., & Del Greco, M. (2016). Social media and crisis management: CERC, search strategies, and Twitter content. Computers in Human Behavior, 54, 647–652.
- Lam, T., & Zhang, H. Q. (1999). Service quality of travel agents: The case of travel agents in Hong Kong. Tourism Management, 20(3), 341–349.
- Łapko, A. (2014). Urban tourism in Szczecin and its impact on the functioning of the urban transport system. Procedia - Social and Behavioral Sciences, 151, 207–214.
- Lau, G., & McKercher, B. (2006). Understanding tourist movement patterns in a destination: A GIS approach. Tourism and Hospitality Research, 7, 39–49.
- Lew, A. A., Hall, C. M., & Williams, A. M. (Eds.). (2004). A companion to tourism. New York, USA: Blackwell.
- Lew, A. A., & McKercher, B. (2004, August). Travel geometry: Macro and micro scales considerations. Paper presented at the Pre-Congress Meeting of the International Geographic Union’s Commission on Tourism, Leisure and Global Change, Loch Lomond, Scotland.
- Li, C., Zhao, Y., Sun, X., Su, X., Zheng, S., Dong, R., & Shi, L. (2011). Photography-based analysis of tourists’ temporal–spatial behaviour in the old town of Lijiang. International Journal of Sustainable Development & World Ecology, 18(6), 523–529.
- Li, D., Zhou, X., & Wang, M. (2018). Analysing and visualising the spatial interactions between tourists and locals: A Flickr study in ten US cities. Cities (london, England), 74, 249–258.
- Liu, X., Kang, C., Gong, L., & Liu, Y. (2016). Incorporating spatial interaction patterns in classifying and understanding urban land use. International Journal of Geographical Information Science, 30(2), 334–350.
- Liu, Y., & Shi, J. (2019). How inter-city high-speed rail influences tourism arrivals: Evidence from social media check-in data. Current Issues in Tourism, 22(9), 1025–1042.
- Luo, Q., & Zhai, X. (2017). ‘I will never go to Hong Kong again!’ How the secondary crisis communication of ‘Occupy Central’ on Weibo shifted to a tourism boycott. Tourism Management, 62, 159–172.
- McKercher, B., Shoval, N., Ng, E., & Birenboim, A. (2012). First and repeat visitor behaviour: GPS tracking and GIS analysis in Hong Kong. Tourism Geographies, 14(1), 147–161.
- Md Khairi, N. D., Ismail, H. N., & Syed Jaafar, S. M. R. (2019). Tourist behaviour through consumption in Melaka World Heritage Site. Current Issues in Tourism, 22(5), 582–600.
- O’Reilly, A. M. (1986). Tourism carrying capacity: Concept and issues. Tourism Management, 7(4), 254–258.
- Paldino, S., Bojic, I., Sobolevsky, S., Ratti, C., & González, M. C. (2015). Urban magnetism through the lens of geo-tagged photography. EPJ Data Science, 4(1), 5.
- Pearce, D. G. (2001). An integrative framework for urban tourism research. Annals of Tourism Research, 28(4), 926–946.
- Popp, M. (2012). Positive and negative urban tourist crowding: Florence, Italy. Tourism Geographies, 14(1), 50–72.
- Prendergast, G. P., Lam, H. S., & Ki, Y. P. (2016). Local residents’ perceptions of an influx of tourists: A Hong Kong case study. Journal of International Consumer Marketing, 28(4), 283–293.
- Raun, J., Ahas, R., & Tiru, M. (2016). Measuring tourism destinations using mobile tracking data. Tourism Management, 57, 202–212.
- Ritchie, B. W. (2004). Chaos, crises and disasters: A strategic approach to crisis management in the tourism industry. Tourism Management, 25(6), 669–683.
- Shoval, N. (2008). Tracking technologies and urban analysis. Cities (london, England), 25(1), 21–28.
- Shoval, N., & Isaacson, M. (2007). Tracking tourists in the digital age. Annals of Tourism Research, 34(1), 141–159.
- Shoval, N., McKercher, B., Birenboim, A., & Ng, E. (2015). The application of a sequence alignment method to the creation of typologies of tourist activity in time and space. Environment and Planning B: Planning and Design, 42(1), 76–94.
- Stetic, S., Simicevic, D., & Stanic, S. (2011). Same-day trips: A chance of urban destination development. UTMS Journal of Economics, 2(2), 113–124.
- Todd, A. W., Campbell, A. L., Meyer, G. G., & Horner, R. H. (2008). The effects of a targeted intervention to reduce problem behaviors: Elementary school implementation of check in – check out. Journal of Positive Behavior Interventions, 10(1), 46–55.
- Tsui, K. W. H., Yuen, A. C. L., & Fung, M. K. Y. (2018). Maintaining competitiveness of aviation hub: Empirical evidence of visitors to China via Hong Kong by air transport. Current Issues in Tourism, 21(11), 1260–1284.
- Vu, H. Q., Li, G., Law, R., & Ye, B. H. (2015). Exploring the travel behaviors of inbound tourists to Hong Kong using geotagged photos. Tourism Management, 46, 222–232.
- Vu, H. Q., Li, G., Law, R., & Zhang, Y. (2018). Tourist activity analysis by leveraging mobile social media data. Journal of Travel Research, 57(7), 883–898.
- Wang, Y., Wang, T., Tsou, M.-H., Li, H., Jiang, W., & Guo, F. (2016). Mapping dynamic urban land use patterns with crowdsourced geo-tagged social media (Sina-Weibo) and commercial points of interest collections in Beijing, China. Sustainability, 8(11), 1202.
- We Are Social. (2018, January 29). Digital in 2018 in Eastern Asia. Retrieved from https://www.slideshare.net/wearesocial/digital-in-2018-in-eastern-asia-86866557
- Weibo Data Center. (2017, December 25). Weibo Report. Retrieved from https://data.weibo.com/report/reportDetail?id=404
- Weibo Data Center. (2019, March 15). Weibo report. Retrieved from http://data.weibo.com/report/reportDetail?id=433
- Wu, B., Xue, L., Morrison, A. M., & Leung, X. Y. (2012). Frame analysis on golden week policy reform in China. Annals of Tourism Research, 39(2), 842–862.
- Xia, J. C., Zeephongsekul, P., & Arrowsmith, C. (2009). Modelling spatio-temporal movement of tourists using finite Markov chains. Mathematics and Computers in Simulation, 79(5), 1544–1553.
- Xia, J., Zeephongsekul, P., & Packer, D. (2011). Spatial and temporal modelling of tourist movements using Semi-Markov processes. Tourism Management, 32(4), 844–851.
- Yoo, K. H., & Lee, W. (2015). Use of Facebook in the US heritage accommodations sector: An exploratory study. Journal of Heritage Tourism, 10(2), 191–201.
- Zhang, H. Q., & Qu, H. (1996). The trends of China’s outbound travel to Hong Kong and their implications. Journal of Vacation Marketing, 2(4), 373–381.
- Zhang, W., Derudder, B., Wang, J., Shen, W., & Witlox, F. (2016). Using location-based social media to chart the patterns of people moving between cities: The case of Weibo-users in the Yangtze River Delta. Journal of Urban Technology, 23(3), 91–111.
- Zhao, J., Forer, P., & Harvey, A. S. (2008). Activities, ringmaps and geovisualization of large human movement fields. Information Visualization, 7(3–4), 198–209.
- Zhen, F., Cao, Y., Qin, X., & Wang, B. (2017). Delineation of an urban agglomeration boundary based on Sina Weibo microblog ‘check-in’ data: A case study of the Yangtze River Delta. Cities (london, England), 60, 180–191.
- Zheng, W., Huang, X., & Li, Y. (2017). Understanding the tourist mobility using GPS: Where is the next place? Tourism Management, 59, 267–280.
- Zoltan, J., & McKercher, B. (2014). Analysing intra-destination movements and activity participation of tourists through destination card consumption. Tourism Geographies, 17(1), 19–35.