
ABSTRACT
The paper examines the size, structure, distribution, dynamics, and use of Airbnb accommodation offer in 167 countries. Web-scrapping Airbnb website in fall 2018 and 2019 resulted in a datasets on 5.7 million listings, including 3.6 million active listings which have been rented out (reviewed) during the last year. Listings are divided into four groups based on types of properties and numbers of offers hosted by one platform user. The results show that the platform is most commonly used to rent out entire apartments by multi-hosts. The numbers of Airbnb listings in countries depend on the level of economic development and size of inbound tourism. One third of Airbnb supply is located in big cities, another one third near seacoasts. Airbnb offer grows most quickly in its relatively new markets, while in primary urban destinations of some European countries it is stable or decreases. The offer of professional hosts is growing more quickly than of peer-to-peer hosts. Differences in the frequency of use and prices of listings exaggerate the geographical unevenness in benefits and impacts of Airbnb activity. Airbnb supply is not a uniform segment of tourist accommodation and its effects on destinations should be considered in relation to territorial context.
Introduction
Since its establishment in 2008, Airbnb became one of the largest online accommodation providers and an epitome of platform economy. It offers for rent more than 7 million homes, apartments and rooms in almost all countries (Airbnb, Citation2019). The platform has gained public and scholarly attention due to its disruptive effects on hospitality industry, impacts on housing markets, and legal conflicts over housing, taxation and consumer regulations (Guttentag, Citation2015; Dann, Teubner, & Weinhardt, Citation2019; Hassanli, Small, & Darcy, Citation2019).
The studies on Airbnb have often underrated the diversity of Airbnb activity in terms of both the types of offers, and their geographic locations. Researchers tend to identify Airbnb as a qualitatively new form of accommodation, associating it with peer-to-peer rental of flats or rooms by non-commercial providers through direct interaction (Dolnicar, Citation2019). Activity of professional hosts and accommodation businesses, including these that provided their services before joining Airbnb, is unrecognized or treated as an anomaly. Also, studies on the platform that offers accommodation in ‘more than 100,000 cities and 191 countries’ (Airbnb, Citation2019) usually concentrate on a limited number of big cities in the developed countries (Guttentag, Citation2019). Acknowledging the typological and geographical diversity of Airbnb accommodation offer is necessary to gauge the impacts of the current and future development of platforms on tourism economy.
International studies on the use and impacts of Airbnb are hampered by lack of publicly accessible data. Press and academic publications cite figures on the number, use and distribution of Airbnb offers provided in platform’s press releases and reports. Such data sources are subordinated to the marketing strategy of Airbnb, poor in information and lacking methodological details. As an alternative to such statistics, researchers widely use web-scrapped data on platform offers including datasets from Inside Airbnb or AirDNA (Guttentag, Citation2019). This, however, usually limits the geographic scope of analysis to individual cities. There is therefore a need for more international scale studies, both descriptive (e.g. international comparisons) and explanatory (e.g. reasons for differences between countries) which would set a broader context for future local studies, and help to evaluate impacts of Airbnb activity on destinations.
This article challenges some deficiencies of previous literature by presenting a global picture of geographic patterns of Airbnb activity. Specific purposes of the study are the following:
To map the current state and changes in global distribution and structure of Airbnb offer across and within countries. Comparison of countries in terms of numbers of Airbnb offers and their structure (e.g. share of professional rentals) will enable to assess the importance of Airbnb for individual tourism destinations. It may also help to judge about the generalizability of the results of local-scale studies.
To explain which socio-economic characteristics determine the scope of Airbnb activity in countries. Finding the factors which contribute to the popularity of Airbnb in individual countries will make it possible to further conclude about the socio-economic determinants of the speed of adaptation of platforms economy.
To identify the differences in the capacity, frequency of use, prices and satisfaction with Airbnb accommodation between countries. General overview of global variability of such characteristics of listings may enrich the interpretation of the results of numerous local studies on related topics.
These goals are approached with the use of web-scrapped data on 3,580,044 active (reviewed at least once during the last year) Airbnb listings in 167 countries – the largest web-scrapped dataset used in studies on Airbnb to date. Based on listing type and number of offers of a single host, the listings are divided into: single-rooms, single-homes, multi-rooms and multi-homes. In the empirical part of the paper, the countries are compared in terms of numbers of listings of different types, their distribution in relation to tourist resources, growth of Airbnb rental stock in the recent year, its capacity, frequency of use, prices and guests’ satisfaction. Before the presentation of the empirical results, the following sections discuss the existing literature on the diversity in types and locations of Airbnb rental offers.
Types of accommodation sold by Airbnb
Airbnb’s market success is based on the creative development of a few recent ideas of tourism accommodation distribution. First, like online travel agencies (e.g. Booking.com), Airbnb exploits a two-sided market model, where platform attracts both providers of accommodation and tourists (Oskam, Citation2019). Advantages of flexibility, efficient mechanisms of risk mitigation, transaction handling and micro-segmentation enabled Airbnb to quickly increase the base of customers on both sides and leverage positive network effect (Dolnicar, Citation2018). Second, Airbnb entered the growing market of holiday rental of homes and apartments, previously concentrated in coastal and mountain resorts, and since the 1990s utilizing online rental platforms (e.g. Vrbo). Airbnb’s innovation was the introduction of internet-mediated short-term rentals to the cities. Finally, Airbnb’s development coincided with the spread of the idea of the sharing economy, implemented by non-profit online hospitality networks such as HomeExchange or Counchsurfing (Hajibaba & Dolnicar, Citation2018). By emphasizing personal character of transactions and the use of underutilized assets, Airbnb marketed itself as providing more authentic, diverse, inclusive and sustainable tourist services than hotels. The platform used the same sharing narrative to present its use as a new form of economic activity, which should not be subject to existing regulations on hospitality industry and housing market (Oskam, Citation2019).
The discussion on Airbnb impacts and regulations usually takes into account the diverse nature of platform offers and the need to distinguish between non-professional and professional hosts. Non-professional ‘mom-and-pop’ hosts (Wegmann & Jiao, Citation2017) or peer-to-peer users (Dolnicar, Citation2019) are those for whom rental is a supplementary use of a house. They rent out one room in their permanent place of residence, rent out the entire home when they are on vacations, or host guests in their second home, which they are not visiting now. Professional (commercial, for-profit) hosts, in turn, are private persons or firms who use one or more apartments or homes only for rent. They do not need to own these homes, but may be concierge companies renting properties on behalf of the owners (Larpin, Mabillard, Scaglione, Favre, & Schegg, Citation2019; Oskam, Citation2019). Professional hosts also comprise guesthouses, hostels, and bed and breakfasts, including illegal ‘ghost hotels’ (Mermet, Citation2019; Oskam, Citation2019; Pawlicz, Citation2019; Roelofsen, Citation2018). Municipal regulations and researchers distinguish professional from non-professional listings based on the host’s presence in the apartment, maximum number of rental days per year, type of listing (room or entire home/apartment) or number of listings hosted by a single host (Adamiak, Citation2018; Dolnicar, Citation2019; Gyódi, Citation2019; Oskam, Citation2019; Wegmann & Jiao, Citation2017).
Dualistic distinction between professional and non-professional hosting is often oversimplified and difficult to delimit based only on listing data. For example, an apartment listed for rent for few months per year may be an investment property, but also a second home used regularly by the owners. Multi-hosts may not be professional hosts, but contact the guests on behalf of their family members (Ruiz-Correa et al., Citation2018). In some areas for-profit users avoid local regulations e.g. by listing properties under multiple accounts, listing apartments as rooms, or listing properties on multiple platforms simultaneously (Coles, Egesdal, Ellen, Li, & Sundararajan, Citation2018; Oskam, Citation2019). Some professional users are new investors who started their business with Airbnb, but others are vacation rental companies or guesthouses who operated before and started to use the platform as a new distribution channel.
Just as the accommodation offers and hosts, so the guests to Airbnb homes and rooms differ in their motivations and backgrounds. Low cost, property qualities (large apartments suitable for families, household amenities, pet friendliness), novelty seeking, authenticity and social interaction were identified as important motives for staying with Airbnb (Gunter & Önder, Citation2018; Guttentag, Smith, Potwarka, & Havitz, Citation2018; Farmaki, Citation2019; Zhang, Cui, Cheng, Zhang, & Li, Citation2019). However, Tussyadiah (Citation2016) noticed that social contacts are only important for those who rent rooms, not entire apartments. Lutz and Newlands (Citation2018) came to similar conclusion, also identifying different socio-economic drivers of the use of entire homes (e.g. high income and education) and rooms. Correspondingly, Guttentag et al. (Citation2018) distinguished five segments of Airbnb users: only ‘collaborative consumers’ are highly motivated by interaction, authenticity, and sharing economy ethos, and they most often book rooms. For members of the remaining four segments other motives are important, including home benefits and novelty, but mostly low price of accommodation.
The predominance of pragmatic motives of Airbnb accommodation users may be the reason why platform managers now focus on the development of professional more than peer-to-peer offer. Airbnb has acquired other platforms (e.g. Luxury Retreats, HotelTonight), created new brands of customized accommodation offers (Airbnb for Work, Airbnb Plus), and is changing the mechanisms of the platform (fee system, additional property management features for hosts). All this aims at the expansion of the platform in the segments of business and luxury travels where hotels used to have advantage (Dogru, Mody, & Suess, Citation2019). The emphasis on ‘boutique’ hotel offers also indicates that Airbnb is increasingly competing against online travel agents on their field (Schaal, Citation2019; Ting, Citation2018). The company is trying to broaden its presence on all types and price segments of accommodation, which is a part of the strategy to build ‘an end-to-end travel platform’, which is also realized through adding new services for tourists: ‘Experiences’ (Pung, Del Chiappa, & Sini, Citation2019), ‘Restaurants’, and possibly transportation in the future (Ting, Citation2019).
Geographic differences in Airbnb offer
To date, studies on Airbnb focused on urban areas. They found spatial variations in the amount and structure of accommodation offers within cities. Listings usually concentrate in central urban areas, and historic or recently gentrified districts (Gutiérrez, García-Palomares, Romanillos, & Salas-Olmedo, Citation2017; Quattrone, Proserpio, Quercia, Capra, & Musolesi, Citation2016; Roelofsen, Citation2018). In New York, central areas have a higher proportion of entire apartments, while in peripheral and less well-off districts hosts rent out rooms (Coles et al., Citation2018). In London, there are more entire property offers in areas with higher housing prices, while room rental is common in districts populated by young, highly educated residents (Quattrone et al., Citation2016).
Airbnb activity is not limited to big cities, but researchers give less attention to the platform offers in smaller towns, resorts and rural areas (Adamiak, Citation2018; DiNatale, Lewis, & Parker, Citation2018). Rare countrywide studies show that Airbnb supply distribution generally mirrors the distribution of tourism demand and traditional accommodation capacity (Adamiak, Szyda, Dubownik, & García-Álvarez, Citation2019; Domènech, Larpin, Schegg, & Scaglione, Citation2019; Strommen-Bakhtiar & Vinogradov, Citation2019), even though on the finer spatial scale there can be differences between the two (Eugenio-Martin, Cazorla-Artiles, & González-Martel, Citation2019). In Switzerland, Larpin et al. (Citation2019) notice that Airbnb activity started in the cities and later spread towards mountain tourism areas, where other rental platforms were active already before. In Spain, listings of entire properties and rooms follow different location patterns: while room rental is common in cities, in coastal destinations the Airbnb stock consists almost exclusively of entire properties (Adamiak et al., Citation2019).
International comparisons of platform offers between cities in various countries point at the differences in sizes and structures of rental stock. Adamiak (Citation2018) compared the absolute numbers, numbers per capita, and types of Airbnb listings in 432 European cities. He concluded that Airbnb is most popular in large cities and leisure tourism destinations, particularly in Southern Europe. In major tourism destinations entire homes prevail in the structure of listings, while in secondary cities there are relatively more rooms. The level of professionalization of Airbnb offer (shares of multi-hosted listings, entire properties and highly available offers) differs between countries. That study based on secondary data obtained from AirDNA, so it was limited to cities. Compared to that, the current study uses primary web-scrapped data, so it also includes non-urban areas.
Heo and Blengini (Citation2019) looked for the factors affecting the numbers of listings in almost 100 capital cities of the world. They concluded that the presence of Airbnb correlates with high level of technological development of the country and high share of tourism in country economy. However, the use of simple regression might have obscured impact of collinear predictors, particularly the level of economic development which is correlated to the level of information and communication development. In the current study, the limitations of that study are addressed by using country-wide Airbnb data and principal component regression.
Few existing publications based on global Airbnb listings databases mostly come from computer sciences and are little known in tourism literature (Abdar & Yen, Citation2017; Ke, Citation2017; Zervas, Proserpio, & Byers, Citation2015). Abdar and Yen (Citation2017) and Ke (Citation2017) described the largest markets of Airbnb (United States, France and other large European cities), global predominance of entire properties over private rooms, prevalence of multi-hosts’ listings (Ke, Citation2017), and differences in structures of listings between countries (Abdar & Yen, Citation2017). They identified entire apartments and houses, rooms in houses and apartments, as well as rooms in bed and breakfasts as the most common offers on the platform (Abdar & Yen, Citation2017). However, they provide only descriptive presentation of numbers, prices, multi-hosting activity and reviews, without linking that data with countries socio-economic characteristics, or with location characteristics within individual countries.
Small-scale studies on Airbnb published in international literature most often use cases from North America and Western Europe, as the earliest and largest markets of the platform (Ginindza & Tichaawa, Citation2019; Guttentag, Citation2019). However, activity and impacts of the platform differ between regions of the world following differences in housing market and tourism economy characteristics. For example, in Southern European countries, Airbnb is sometimes considered a tool to intensify the use of second homes and vacant housing in rural areas (Adamiak et al., Citation2019; Belotti, Citation2019). In Central and Eastern Europe high concentration and professionalization of vacation rental through Airbnb and other platforms is related to the unregulated housing market (Ključnikov, Krajčík, & Vincúrová, Citation2018; Roelofsen, Citation2018). In developing countries of Central America, Africa and South Asia, Airbnb rental fits in the local traditions of homestays and informal tourism accommodation services, and the platform provides marketing tool enabling to reach international tourists (Bandara, Citation2019; Kagermeier, Amzil, & Elfasskoui, Citation2017; Ruiz-Correa et al., Citation2018).
Platform activity is dependent on country legal systems, as well as the presence of local competition. In Europe and North America short-term rental regulations, including those most efficient – implemented directly in the platform – are usually set up at the local level (Nieuwland & van Melik, Citation2018; Oskam, Citation2019). Japan is an example of the country that introduced nation-wide law on the accommodation in private homes, obliging the platform to control the official registration of offers, which resulted in the reduction of the number of listings by 80% in summer 2018 (Matsui, Citation2019; Nikkei Asian Review, Citation2018). Airbnb has several competitors on the global market (Hajibaba & Dolnicar, Citation2018), but particularly important is the competition with Chinese platforms due to the size of the largest tourism market, and the partial separation of Chinese internet economy from global firms. Even though Airbnb has adhered to Chinese internet regulations and considers China as the principal market for future expansion (Jing & Soo, Citation2019), it faces strong native competition of Tuija and Xiaozhu platforms (Xiang & Dolnicar, Citation2017).
Recent years have seen a slowdown in previously exponential growth of Airbnb use in Europe and America (Ting, Citation2017). Market saturation and regulations lead the supply of Airbnb in many principal cities to stall or even shrink. According to AirDNA (Citation2019), between third quarters of 2017 and 2019 the number of active listings of Airbnb and HomeAway decreased by 7% in New York and by 19% in Paris. On the other hand, Airbnb offer is still expanding in other parts of the world: in the same period, the numbers of active listings increased by 150% in Beijing, 135% in Nairobi, and 71% in Bogotá. Hence, it is particularly important to investigative the dynamics and impacts of the platform in its developing markets outside of Europe and North America.
Data
The data on Airbnb listings was obtained from the platform using web-scrapping script (Slee, Citation2018). The scrapping was performed twice in yearly interval: in September and October 2018 (4.7 million listings), and in September 2019 (5.7 million listings). Only listings available in the following months were saved in the dataset, which results in an underestimation of the total number of offers by up to 20% (see Adamiak et al., Citation2019 for more details on the credibility of web-scrapping results). The datasets included the geographic coordinates of listings, information on property types (entire home/property, private room, shared room or hotel room), baseline prices per night, numbers of reviews and average ratings. Based on identification numbers of hosts, the offers were divided into single-hosted listings, where one platform user offers only one property, and multi-hosted listings where the same user offers more than one rental place.
One of the drawbacks of web-scrapped data is that it includes information on offers, not reservations, while some of the listings may be accidentally created or not used at all (Coles et al., Citation2018). To filter out inactive listings, the dataset was limited to listings which had received at least one review between the two scrappings or only appeared in the newer dataset, and had at least one review (assuming they were new listings in 2019 and had already been rented out). About 62.4% of the total listings from the 2019 dataset fulfil one of these criteria and were used in the analysis. Not all guests to Airbnb places leave their reviews, so the number of active listings may be underestimated.
Subsequently, active offers were assigned to 167 countries and dependent territories based on text address in the description of each listing. There are several countries with no Airbnb listings: some African and small island countries, and countries where American companies cannot operate due to the sanctions of US government, e.g. Iran and North Korea (the same applies to Crimea region). Most of dependent territories, which do have Airbnb listings, were also excluded from the study because of the lack of comparative statistical data (e.g. overseas departments of France: Guadelupe, Marinique and Réunion with 3000–5000 active listings each).
Other sources of comparative data, as well as analytical techniques used in the study will be presented in the following sections. The analysis and presentation of the results was performed with the use of ArcGIS Pro and RStudio with packages: ggplot2, gridExtra, ggalluvial, rgdal, and sf (Auguie, Citation2017; Bivand, Keitt, & Rowlingson, Citation2018; Brunson, Citation2018; Pebesma, Citation2018; Wickham, Citation2016). In the presentation of national data, the countries were grouped into regions based on UNWTO’s regionalization (UNWTO, Citation2019).
Results
Types of listings
In total 3,580,044 active listings were identified in 167 countries and territories included in the analysis. Based on listing type and number of listings hosted by a single host, the listings were divided into four groups ():
Single-rooms – single-hosted private rooms, shared rooms or hotel rooms. They are usually rooms or bed-places within hosts’ permanent residences.
Single-homes – single-hosted entire homes/apartments. Part of such listings are permanent residences rented out when the hosts are absent. Another part are second homes rented out when the owners do not use them. They can also be single investment properties used exclusively for rental. Distinguishing between these three would only be possible based on the information on the availability of the listing throughout the year.
Multi-rooms – multi-hosted private rooms, shared rooms or hotel rooms. This category includes rooms in multi-room apartments rented out separately, rooms in guesthouses, bed and breakfasts, hostels or hotels which sell their services through Airbnb, often as one of several distribution channels. They are either registered or informal businesses. Even though there is a separate category for hotel rooms, it was introduced only in 2019, so many actual hotel rooms are registered on the platform as private rooms. Note that the number of listings is the number of rooms, not establishments.
Multi-homes – multi-hosted entire homes/apartments. Similarly as in case of multi-rooms, multi-hosting implies profit-oriented activity. The hosts may be private owners of multiple apartments, corporate owners, or concierge companies managing rentals on behalf of the owners.
Table 1. Structure of active Airbnb listings in 167 countries.
Two most common categories of listings are multi-homes and single-homes, together grouping 3/4 of all active listings in 167 countries. Multi-rooms account for 17.5% of all offers. The share of single-rooms is surprisingly low (7.9%) considering that they represent the original idea of Airbnb founders. 41.1% of all listings are single-hosted and can be included in the peer-to-peer accommodation sector, while the remaining 58.9% are rather professional accommodation offers.
Distribution of listings in 167 countries
Active Airbnb listings are most numerous in regions where the platform started its global expansion: North America and Europe (). United States with 624 thousand active listings accounts for 17.4% of the global offer (, upper graph), followed by France and China. Europe concentrates nearly half of Airbnb supply. Other large Airbnb markets are countries of East Asia, Oceania, South and Central America. The platform is relatively little active in Africa (apart from South Africa and Morocco) and Middle East.
Figure 1. Distribution of active listings in 167 countries.
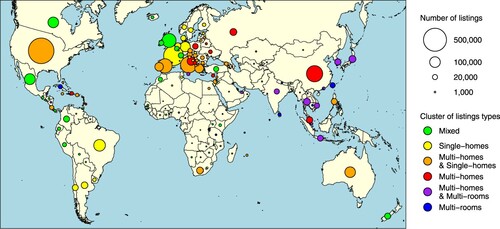
Figure 2. Number and structure of active listings in 63 countries with more than 5000 active listings.
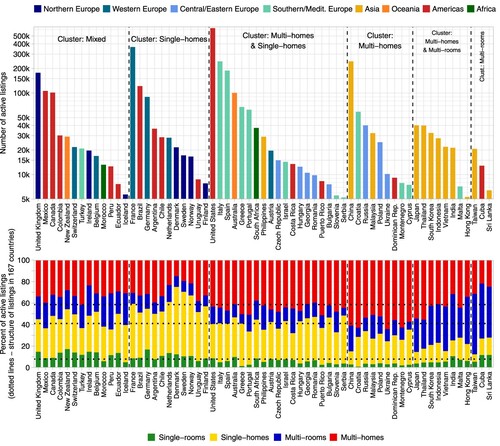
The structure of listings varies significantly between countries. Single-homes are the majority of Airbnb offer in France and Scandinavian countries, multi-homes predominate in China and Russia, and multi-rooms account for over half of Airbnb listings in Taiwan. Among large markets, the share of single-rooms exceeds 15% only in Germany and New Zealand (, lower graph). Groups of countries with similar structure of Airbnb rentals are distinguished using K-means clustering, with six-cluster solution chosen based on the elbow graph (Aldenderfer & Blashfield, Citation1984). Mean structures in each cluster are described in . and present the assignment of countries into clusters.
Table 2. K-means clusters of countries based on structures of active listings.
The first group of countries (‘Mixed’) includes e.g. United Kingdom and several American countries. They are characterized by relatively high share of single-rooms and balance between the three remaining groups of listings. The second cluster (‘Single-homes’) comprises countries with high numbers of single-homes and higher than average numbers of single-rooms: most countries of Western and Northern Europe. The forth group (‘Multi-homes’) includes countries where multi-homes predominate, e.g. China and several Eastern and South-Eastern European states. The most common cluster ‘Multi-homes & Single-homes’ indicates intermediate structure between the second and the forth cluster, and is represented by United States and most of Southern and Eastern European countries. Two last clusters (‘Multi-homes & Multi-rooms’ and ‘Multi-rooms’) group mostly Asian countries with high proportions of multi-rooms.
Determinants of the numbers of listings in countries
The number of Airbnb offers in relation to country population is highest in several small, touristic countries in Europe (Iceland – 16.1 listings per one thousand inhabitants, followed by Malta, Croatia, and Montenegro). Numbers of offers per capita are also relatively high in most countries of Americas and Oceania, while they are the lowest in African countries (some of them have only few listings per million inhabitants), Middle East, and Southern and Central Asia.
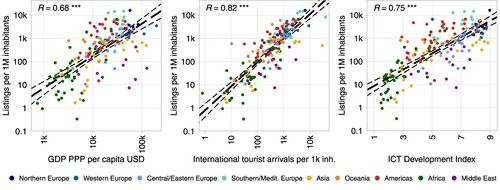
In order to examine the factors that affect the level of adaptation of Airbnb platform, the numbers of listings per capita are compared with the indicators of the economic development, international tourist arrivals and the development of information and communication technology:
Gross domestic product per capita in purchasing power parity in 2018 (World Bank, Citation2019).
Number of international tourist arrivals in 2018 per capita (UNWTO, Citation2019). If data for 2018 was unavailable, last available data corrected proportionally to the global change of international tourism volume was used.
Information and Communication Technology Development Index (ITU, Citation2017). The value for Taiwan was estimated based on domestic sources (Shan, Citation2018), and for Puerto Rico based on its position in Information and Communication Technology Opportunity Index in 2007 (ITU, Citation2007).
The differences in the numbers of Airbnb listings per capita in 167 countries correlate with all three explaining variables (). Apart from these correlations, there are other systematic differences between countries. Assuming similar levels of each of the explaining factors, countries located in Americas, Oceania and Southern Europe have more listings, while countries of the Middle East, Africa and Asia have usually less listings than countries in other parts of the world.
Figure 3. Correlation between the number of active listings and socio-economic indicators in 167 countries.
Five regression models were developed to explore the relative importance of three factors: gross domestic product, number of tourist arrivals and the level of information and communication technology development on the number and structure of Airbnb listings (). The dependent variables were the total number of active Airbnb listings and numbers of listings in each of the four groups, in relation to population. To overcome the multicollinearity problem, principal component regression was used. It means that first, three dimensions of the variation of explaining variables were extracted, and these three auxiliary variables were subsequently used as predictors in the regression models. The first principal component represents the overall level of economic development of the country. It correlates with all three explaining variables and contains the majority of their variation. The second principal component shows the relative importance of tourism in the economy, and the third principal component represents the level of information and communication technology development relative to gross domestic product per capita. All three principal components positively and significantly affect the total number of Airbnb listings. They also positively influence the numbers of listings of each group. The exception is the component 3, whose coefficient for single-rooms and multi-rooms does not significantly differ from zero.
Table 3. Determinants of the number of active Airbnb listings in countries: principal component regression.
The regression results confirm that affluence, demand from international tourists, and information and communication technology development all independently increase the number of listings on the platform. There are however differences between factors affecting the numbers of listings in each of the four categories. The offer of entire properties is more dependent on the overall level of the economic development than the supply of rooms. It may be explained by the higher availability of homes and apartments in more affluent countries. The importance of tourism for the country economy affects the numbers of multi-hosted listings more than the numbers of single-hosted listings. It shows that the commercial use of the platform follows the demand for accommodation from international tourists.
Location of Airbnb listings in relation to tourist resources
Even though most studies to date focus on urban destinations as the areas of Airbnb activity, a large proportion of listings is located in coastal and mountain resorts, as well as in smaller towns and rural areas. The location of Airbnb listings was examined by assigning them to one of four location types ():
Cities – areas within 10 km from the centres of capital cities and other cities larger than 500 thousand inhabitants. To determine the location of city centres, Simplemaps (Citation2019) World Cities Database was used.
Seacoast – areas within 10 km from the seacoast, but outside of the 10 km limit from the cities. Coastal locations were determined based on coastline data in intermediate resolution from the Global Self-consistent Hierarchical High-resolution Geography Database (NOAA, Citation2019).
Ski areas – areas within 10 km from the nearest aerial lift (gondola or chairlift), but outside of the 10 km limit from the cities. The location of ski lifts is determined based on OpenStreetMap database via OpenSnowMap (Citation2019). Most, but not all lifts are located in downhill ski areas. The name is a simplification for the sake of brevity, but this category includes usually mountain areas where skiing facilities are not the only tourist attractions.
Other areas, including minor cities and rural areas.
Figure 4. Structure of active listings by location in 63 countries with more than 5000 active listings.
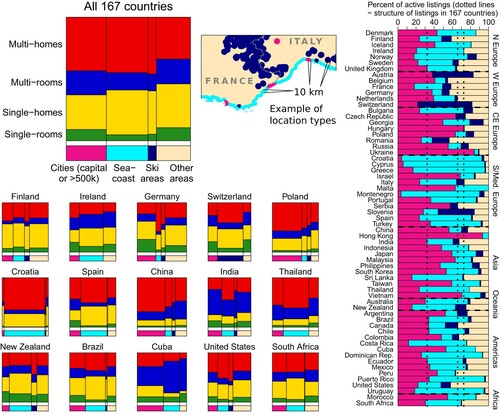
Almost one third of Airbnb listings is located in large cities. Another one third is close to seacoasts, but outside of the major cities. 6.8% listings are in ski areas, and all other cities and rural areas comprise the remaining 27.4% of Airbnb supply. The share of urban listings is particularly high in Asian countries with high population density or concentration of international tourism in the capital and other major cities (e.g. China), as well as in Central and Eastern European Countries (Poland). Low shares of large cities, in turn, are characteristic for countries where most of tourism activity is concentrated in coastal areas (Croatia, Spain, Thailand) or ski areas (Switzerland). Relatively high shares of listings in other areas are typical for countries where both population and tourism activity reach smaller inland cities and rural areas (Germany, Untied States).
Structures of listing types differ across locations. In general, the proportion of rooms is relatively higher in big cities and other areas (including minor cities) than in principal leisure tourism destinations (coastal and ski areas). It can be explained by differences in housing availability, and the difference in the needs of short-stay urban tourists and longer-stay coastal or mountain tourists, respectively. Globally, the prevalence of multi-hosted listings is higher in big cities, coastal and ski areas than in other areas. The reason for that may be the difference in tourism demand: professional users concentrate mostly on high-demand destinations where they expect higher return from the property. These general characteristics are not universal for all countries, e.g. in China there are relatively less rooms in major cities than outside of them, and in German cities single-hosted listings prevail over multi-hosted listings more than in other areas. The comparison between the countries shows that multi-hosted listings of both kinds are often more than single-hosted listings concentrated in principal international tourism destinations of each country: e.g. coastal areas in Croatia, ski areas in Switzerland and Finland, or big cities in China and Poland.
Recent changes in Airbnb supply
Web-scrapping Airbnb webpage in two time points in 2018 and 2019 enabled to notice the recent changes in platform offer size, distribution and structure. Due to the lack of earlier data, it is impossible to apply for the 2018 data the same definition of active listing as for the 2019 data. In the newer dataset one could filter out ‘dormant’ listings which have at least one review, but the most recent review was added more than a year ago. In the older dataset this number was estimated instead, assuming that the proportion of such ‘dormant’ listings was the same in 2018 as in 2019.
Based on this assumption, the number of active listings is estimated to have grown by 656 thousands (22.6%) during the last year. The geographical centre of gravity of Airbnb activity is moving from Europe (growth by 17.9%) towards other continents: America (growth by 26.5%), and mostly Asia (growth by 46.5%). This Asian growth is mostly concentrated in China, where the number of listings increased by 106 thousands, so by 76.7%. Still, in absolute numbers Airbnb stock size increased even more in the United States (108 thousands, 21.1%). There are some countries where the number of active listings slightly decreased, e.g. Cuba, Russia and Croatia ().
Figure 5. Change in the number of active listings 2018–19 in 63 countries with more than 5000 active listings.
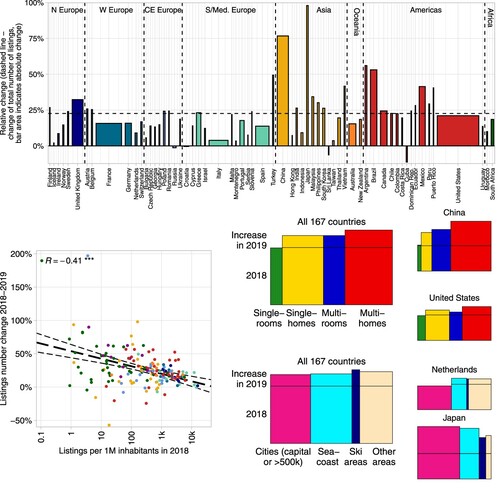
Negative correlation between the number of active Airbnb listings per capita in 2018 and the growth of rental stock shows a gradual saturation of mature platform markets. Similar trend can be noticed when comparing the geographic locations within individual countries. In many European countries the numbers of listings in the largest cities grow slowly or even decrease (e.g. in the Netherlands), while in leisure and secondary destinations the platform offer it still expanding. Besides market saturation it may be an effect of increasingly strict and efficient regulations of platform activity in many cities, while similar measures are not applied in other areas. In terms of the structure of listings, the number of multi-homes grows most quickly (overall increase by 30.5%), while the number of single-rooms minimally decreased over the last year. A distinctive situation of Japan – highest rate of increase among all large Airbnb markets (97.9%) and growth mostly concentrated in the largest cities – results from the introduction of new regulations and consequent deactivation of numerous listings just before the first scrapping, and following return of part of these offers after they fulfilled the licence requirements.
Capacity, use and satisfaction with Airbnb listings
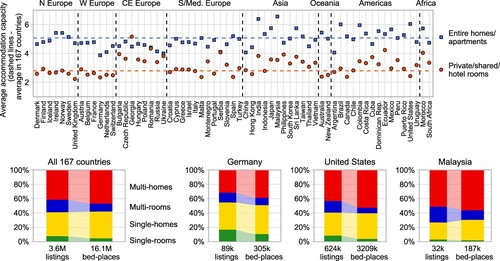
The average entire home/apartment listed on Airbnb has 2.0 bedrooms, 1.5 bathrooms, and can accommodate 5.1 persons (). The average room (or place in a shared room) accommodates 2.8 persons. The number of guests acceptable in rooms is low in most European countries (apart from Central and Eastern Europe), Oceania and North America, while it is relatively high in some Asian, South American, and African countries. The housing capacity of entire properties is low in Western, Central and Eastern Europe, while high in America, Oceania, and most of Asian countries. These differences seem to result from the average living space in homes, but also from different perception of living comfort. The difference in capacity between rooms and homes further exaggerates the predominance of the latter in the accommodation capacity. The two types of entire properties account for 74.7% listings, but their share in the bed-places amounts to 84.3%.
Figure 6. Structure of accommodation capacity of active listings in 63 countries with more than 5000 active listings.
The numbers of reviews per offer is often used as an indicator of the frequency of use of Airbnb listings (Ke, Citation2017; Quattrone et al., Citation2016; Benítez-Aurioles, Citation2019). The results of two web-scrapping rounds were used to calculate the numbers of reviews that each listing received during the year between the scrappings. For this only the listings that appeared in both datasets were used (57.8% of the total number). The number of reviews per year was then multiplied by average base rental price per night (in 2018) to estimate hosts’ revenues from rentals. One should however interpret such estimation with caution for two reasons. First, the number of reviews is always lower than the actual number of rentals, because not every visitor writes a review. Second, total prices paid by the guests depends on not only the base price per night, but also the length of stay and additional charges (service fee, cleaning fee). Having these limitations in mind, the two indicators can serve to make an estimation of the structure of bookings and revenue across different countries and types of listings.
At the time of scrapping, the average number of reviews each active listing had per year was 15.8 (). There are only slight differences between listings types: relatively most frequently booked were single-rooms (18.6 reviews on average), and least frequently booked were multi-rooms (14.8). There is a significant variation between countries: higher than average number of reviews characterize listings in United States, Oceania, Japan, and several European countries (e.g. Iceland), while low numbers are typical for Russia, several South European, Asian, and South American countries. The average price per room is 56.06 USD, while per entire property it is 119.76 USD. The prices differ across countries: they are highest in Northern and Western Europe, Oceania, and United States. Low prices are characteristic for South-East Asia, South America as well as Central and Eastern Europe.
Figure 7. Number of reviews per year, average prices and structure of estimated revenue from active listings in 63 countries with more than 5000 active listings.
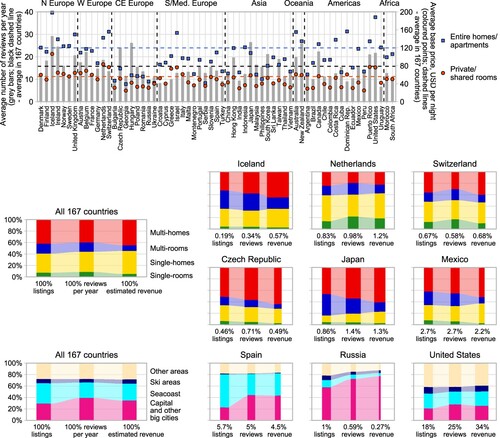
The differences in the frequency of use and prices mean that the numbers of listings do not reflect the numbers of tourists, and the revenue from Airbnb rental in individual countries (lower charts of ). For example, less than 1/5 of the total number of listings is located in United States. Yet, they are on average more often used and more expensive than the global average, so they gather 1/4 of visits and over 1/3 of earnings. Iceland is the country with both highest average number of rentals per year, and highest prices of listings. As an effect, the estimated revenue of one listing is 3 times higher than the average in 167 countries. On the other extreme is Russia, with one of the lowest numbers of reviews per year and prices, hence the estimated revenue from one listing is almost 4 times lower than the average.
Type and location structures of the numbers of listings (left columns) may differ from the structures of reviews and hence uses (middle columns), and the structures of revenue (right columns). On a global scale, little differences between rental frequencies of various types of listings and lower prices of rooms than apartments lead to smaller revenues from the two categories of rooms than the two types of entire properties. However, there are differences between individual countries again. For example, rooms are relatively more often used than apartments in most North and Western European countries (e.g. Netherlands, Switzerland), while the opposite is true in Asia (Japan) and Central and Eastern Europe (Czech Republic). Single-hosted listings are more often used than multi-hosted listings, e.g. in Japan, while in Iceland multi-hosted listings are more frequently rented. In both these countries, single-hosted listings are more expensive than multi-hosted listings, differently than in Czech Republic and Switzerland. Urban listings are usually more frequently rented than those in other areas. In global terms, they are also slightly cheaper than listings located outside of the big cities. In Spain, coastal listings are more numerous than offers in big cities, but the relation is opposite when we look at the numbers of reviews per year. In United States, offers in coastal and ski areas are more expensive than others, while different trend can be noticed in Russia.
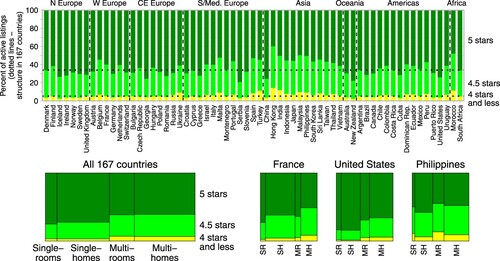
The last element of the analysis portrays guests’ satisfactions with rentals. Every Airbnb guest may review the listing writing a text opinion and giving a quantitative scores of various elements of stay, which are later recalculated into a composite 1–5 star scale. The platform presents the average rating of each active listing rounded to half star. Only after a listing gathers 3 reviews the average rate is presented on the website – this precondition was fulfilled by 78.9% offers in the analysis. Previous studies noticed a strong skew towards high values in Airbnb ratings (Zervas et al., Citation2015; Bridges & Vásquez, Citation2018). The mean rating for all active listings in 167 countries is 4.80. The majority (66.1%) of listings have five stars, 28.7% have 4.5 stars, and only 1.1% have less than 4 stars. The ratings differ slightly between countries and types of listings (). In general, highest values are typical for Northern, Central and Eastern Europe, United States, Oceania and China. Relatively low ratings are characteristic for South-Western Europe, and the rest of Asia. These differences may result both from the differences in the actual quality of services, and from cultural differences between countries. There are also systematic differences between types of properties, with multi-hosted listings having generally lower ratings than single-hosted listings in all countries. It may be a result of more professional host–guest relations in case of multi-hosted listings. There are no systematic differences in the rating of rooms and homes, e.g. in France, rooms are rated higher, while in the Philippines they are rated lower than homes.
Figure 8. Satisfaction with active listings (1–5 stars scale) in 63 countries with more than 5000 active listings.
Discussion
The paper attempted to provide a global picture of the geographical variation in the supply and use of Airbnb accommodation. It has shown that Airbnb offers are mostly rental homes and flats, and multi-hosts offer over half of the platform supply. Airbnb operates in most of countries of the world, yet half of its supply is located in Europe. The use of the platform as a peer-to-peer marketplace is relatively more popular in Americas, Western and Northern Europe and Oceania, while in the rest of the world Airbnb is primarily a platform for professional rental of homes and serviced accommodation. The total numbers of Airbnb listings in countries are dependent on the level of economic development and size of inbound tourism flow. The latter factor affects more the number of professional offers. One third of global Airbnb supply is located in big cities, another one third in coastal areas. The location of offers within each country, particularly those professionally oriented, is dependent on the distribution of its primary tourist attractions. There are also differences in the frequency of use and prices of listings between and within countries.
This is the most recent research on the global Airbnb supply. Comparison with previous publications gives some insights into the development of the platform. Sizes of web-scrapped datasets are indicators of the total number of Airbnb listings at the time of data collection. Zervas et al. (Citation2015) identified 600 thousand offers (probably) in 2014, Ke (Citation2017) obtained data on 2.0 million listings in 2016, and the datasets used for this paper include 4.7 million (2018) and 5.7 million listings (2019). With the growth of the number of listings, the proportion of offers that are actually used has been increasing too: 37.8% listings had at least 3 reviews according to Zervas et al. (Citation2015), two years later the share grew to 44.6% (Ke’s, Citation2017), and after other two years it reached 52.2% (in total number of listings, for active listings only it is 78.9%). Airbnb supply is also increasingly professional. In Ke’s (Citation2017) data 68.5% offers were entire properties, now it is 71.9% (74.7% of active listings). Back then, multi-hosts offered 49.0% of all listings, and now it is 62.0% (58.9% of active listings). The proportion of listings hosted by hosts with at least three listings grew from 33.2% to 47.6% (43.2% of active listings). The results of comparison between 2018 and 2019 data confirm that the offer of professional hosts is still growing more quickly than of peer-to-peer hosts.
The territorial structure of listings has not changed dramatically since 2016 (Ke, Citation2017). The share of United States in the total number of listings remains stable (then 15.3% of all listings, now 14.6% of all listings and 17.4% of active listings). The shares of European countries have slightly decreased, and most of Asian countries have increased their relative presence in the Airbnb market. The largest change occurred in case of China (from 13rd to 3th place in terms of the number of active listings). There is also a clear tendency of geographic dispersion within countries. Even though previous studies on the global scale did not consider geographic variations within countries, a spread from the cities towards resorts and smaller localities was noticed on country scale (Larpin et al., Citation2019). Current data for two previous years confirm that in mature Airbnb markets the number of platform offers outside of major cities grow more quickly than in these cities.
Web-scrapped data on accommodation offers has been often used in studies on various topics related to peer-to-peer accommodation platforms (Guttentag, Citation2019). The current study is unique among them in its global scope, yet it shares with them some limitations of the interpretation of the results. The lack of information on time availability of offers makes the distinction between types of Airbnb listings somewhat simplistic. Web-scrapping technique does not provide the full database of all listings. It also only provides information on currently active listings, so the possibilities of longitudinal studies are limited. Future studies could overcome part of these limitations by employing other web-scrapping techniques or using mixed methods linking such data with survey or qualitative methods. Web-scrapped datasets of Airbnb offers and reviews can also be used more widely in tourism studies as a source of user-generated big data for investigation of spatial and temporal patterns of tourism mobility, preferences and satisfaction (Li, Xu, Tang, Wang, & Li, Citation2018).
Considering the results of current study, future research on Airbnb should not only concentrate on urban areas, but also look at smaller towns and resorts. Broader generalization of the results may be possible by comparing locations in countries with different socio-economic situation, importance of tourism economy, characteristics of housing markets, regulations and competition. Tourism studies should not consider platforms as a completely new and distinct form of tourism accommodation and a competitor to traditional hospitality industry. Airbnb markets a diverse range of peer-to-peer and commercial services: homes, second homes, investments properties and catered accommodation services who use the platform as a distribution channel. Future studies should therefore consider implications of platform activity for the commodification of tourism-related resources such as second homes and for tourism businesses, particularly small ones operating in informal sector.
Acknowledgements
The author thanks Dieter Müller and C. Michael Hall for valuable comments and suggestions on the earlier versions of the text.
Disclosure statement
No potential conflict of interest was reported by the author.
Correction Statement
This article has been republished with minor changes. These changes do not impact the academic content of the article.
Related Research Data
References
- Abdar, M., & Yen, N. Y. (2017). Understanding regional characteristics through crowd preference and confidence mining in P2P accommodation rental service. Library Hi Tech, 35(4), 521–541.
- Adamiak, C. (2018). Mapping Airbnb supply in European cities. Annals of Tourism Research, 71, 67–71.
- Adamiak, C., Szyda, B., Dubownik, A., & García-Álvarez, D. (2019). Airbnb offer in Spain – Spatial analysis of the pattern and determinants of its distribution. ISPRS International Journal of Geo-Information, 8(3), 155.
- Airbnb. (2019). About us. Retrieved from https://press.airbnb.com/about-us/
- AirDNA. (2019). MarketMinder. Retrieved from https://www.airdna.co/vacation-rental-data
- Aldenderfer, M. S., & Blashfield, R. K. (1984). Cluster analysis. Beverly Hills, CA: Sage.
- Auguie, B. (2017). gridExtra: Miscellaneous functions for ‘grid’ graphics. R package version 2.3. Retrieved from https://CRAN.R-project.org/package=gridExtra
- Bandara, J. S. (2019). Tourism in post-conflict development: Making use of new opportunities in Sri Lanka. In D. Weerakoon & S. Jayasuriya (Eds.), Managing domestic and international challenges and opportunities in post-conflict development (pp. 173–194). Singapore: Springer.
- Belotti, S. (2019). ‘Sharing’ tourism as an opportunity for territorial regeneration: The case of Iseo Lake, Italy. Hungarian Geographical Bulletin, 68(1), 79–91.
- Benítez-Aurioles, B. (2019). Is Airbnb bad for hotels?. Current Issues in Tourism. Advance online publication. doi: 10.1080/13683500.2019.1646226
- Bivand, R., Keitt, T., & Rowlingson, B. (2018). rgdal: Bindings for the ‘geospatial’ data abstraction library. R package version 1.3-6. Retrieved from https://CRAN.R-project.org/package=rgdal
- Bridges, J., & Vásquez, C. (2018). If nearly all Airbnb reviews are positive, does that make them meaningless? Current Issues in Tourism, 21(18), 2065–2083.
- Brunson, J. C. (2018). ggalluvial: Alluvial diagrams in ‘ggplot2’. R package version 0.9.1. Retrieved from https://CRAN.R-project.org/package=ggalluvial
- Coles, P. A., Egesdal, M., Ellen, I. G., Li, X., & Sundararajan, A. (2018). Airbnb usage across New York ity neighborhoods: Geographic patterns and regulatory implications. In N. M. Davidson, M. Finck, & J. J. Infranca (Eds.), The Cambridge Handbook of the Law of the sharing economy (pp. 108–128). Cambridge: Cambridge University Press.
- Dann, D., Teubner, T., & Weinhardt, C. (2019). Poster child and Guinea pig – Insights from a structured literature review on Airbnb. International Journal of Contemporary Hospitality Management, 31(1), 427–473.
- DiNatale, S., Lewis, R., & Parker, R. (2018). Short-term rentals in small cities in Oregon: Impacts and regulations. Land Use Policy, 79, 407–423.
- Dogru, T., Mody, M., & Suess, C. (2019). Adding evidence to the debate: Quantifying Airbnb’s disruptive impact on ten key hotel markets. Tourism Management, 72, 27–38.
- Dolnicar, S. (2018). Peer-to-peer accommodation networks: Pushing the boundaries. Oxford: Goodfellow Publishers.
- Dolnicar, S. (2019). A review of research into paid online peer-to-peer accommodation. Annals of Tourism Research, 75, 248–264.
- Domènech, A., Larpin, B., Schegg, R., & Scaglione, M. (2019). Disentangling the geographical logic of Airbnb in Switzerland. Erdkunde, 73(4), 245–258. doi: 10.3112/erdkunde.2019.04.01
- Eugenio-Martin, J. L., Cazorla-Artiles, J. M., & González-Martel, C. (2019). On the determinants of Airbnb location and its spatial distribution. Tourism Economics. Advance online publication. doi: 10.1177/1354816618825415
- Farmaki, A. (2019). Women in Airbnb: A neglected perspective. Current Issues in Tourism. Advance online publication. doi: 10.1080/13683500.2019.1674257
- Ginindza, S., & Tichaawa, T. M. (2019). The impact of sharing accommodation on the hotel occupancy rate in the kingdom of Swaziland. Current Issues in Tourism, 22(16), 1975–1991.
- Gunter, U., & Önder, I. (2018). Determinants of Airbnb demand in Vienna and their implications for the traditional accommodation industry. Tourism Economics, 24(3), 270–293.
- Gutiérrez, J., García-Palomares, J. C., Romanillos, G., & Salas-Olmedo, M. H. (2017). The eruption of Airbnb in tourist cities: Comparing spatial patterns of hotels and peer-to-peer accommodation in Barcelona. Tourism Management, 62, 278–291.
- Guttentag, D. (2015). Airbnb: Disruptive innovation and the rise of an informal tourism accommodation sector. Current Issues in Tourism, 18(12), 1192–1217.
- Guttentag, D. (2019). Progress on Airbnb: A literature review. Journal of Hospitality and Tourism Technology. Advance online publication. doi: 10.1108/JHTT-08-2018-0075
- Guttentag, D., Smith, S., Potwarka, L., & Havitz, M. (2018). Why tourists choose Airbnb: A motivation-based segmentation study. Journal of Travel Research, 57(3), 342–359.
- Gyódi, K. (2019). Airbnb in European cities: Business as usual or true sharing economy? Journal of Cleaner Production, 221, 536–551.
- Hajibaba, H., & Dolnicar, S. (2018). Airbnb and its competitors. In S. Dolnicar (Ed.), Peer-to-peer accommodation networks: Pushing the boundaries (pp. 63–76). Oxford: Goodfellow Publishers.
- Hassanli, N., Small, J., & Darcy, S. (2019). The representation of Airbnb in newspapers: A critical discourse analysis. Current Issues in Tourism. Advance online publication. 1–13. doi: 10.1080/13683500.2019.1669540
- Heo, C. Y., & Blengini, I. (2019). A macroeconomic perspective on Airbnb’s global presence. International Journal of Hospitality Management, 78, 47–49.
- ITU. (2007). 2007 ICT-OI values and sub-indices: networks, skills, uptake and intensity, and ICT-OI average annual growth rate 2001-2005. Retrieved from https://www.itu.int/ITU-D/ict/publications/idi/material/2007/table1_2007.html
- ITU. (2017). The ICT Development Index (IDI): conceptual framework and methodology. Retrieved from https://www.itu.int/en/ITU-D/Statistics/Pages/publications/mis2017/methodology.aspx
- Jing, M., & Soo, Z. (2019, March 29). Airbnb complies with China law to hand over guest details as listings double. South China Morning Post. Retrieved from https://www.scmp.com/tech/article/2139526/airbnb-complies-china-law-hand-over-guest-details-listings-double
- Kagermeier, A., Amzil, L., & Elfasskoui, B. (2017). Touristification of the Moroccan oasis landscape: New dimensions, new approaches, new stakeholders and new consumer formulas. Retrieved from http://wordpress.kagermeier.de/wp-content/uploads/2017/09/Kagermeier-Amzil-Elfasskaoui_Colloque-Ait-Hamza_Tourisme-Oasis-Maroc_26-09-2017.pdf
- Ke, Q. (2017, June 25–28). Sharing means renting?: An entire-marketplace analysis of Airbnb. In Proceedings of the 2017 ACM on web science conference – WebSci ‘17, Troy, NY (pp. 131–139). New York, NY: ACM Press.
- Ključnikov, A., Krajčík, V., & Vincúrová, Z. (2018). International sharing economy: The case of Airbnb in the Czech Republic. Economics and Sociology, 11(2), 126–137.
- Larpin, B., Mabillard, J., Scaglione, M., Favre, P., & Schegg, R. (2019). An analysis of regional developments of Airbnb in Switzerland: Insights into growth patterns of a P2P platform. In J. Pesonen & J. Neidhardt (Eds.), Information and communication Technologies in tourism 2019 (pp. 92–103). Cham: Springer.
- Li, J., Xu, L., Tang, L., Wang, S., & Li, L. (2018). Big data in tourism research: A literature review. Tourism Management, 68, 301–323.
- Lutz, C., & Newlands, G. (2018). Consumer segmentation within the sharing economy: The case of Airbnb. Journal of Business Research, 88, 187–196.
- Matsui, S. (2019). Is law killing the development of new technologies?: Uber and Airbnb in Japan. Boston University Journal of Science & Technology Law, 25, 100–144.
- Mermet, A.-C. (2019). The ‘Airbnbfication’ of the Icelandic capital. Towards an assessment of the socio-spatial impacts of Airbnb in the Reykjavik capital area. Retrieved from https://www.ferdamalastofa.is/static/files/ferdamalastofa/kannanir/skyrslur/airbnb-heild2.pdf
- Nieuwland, S., & van Melik, R. (2018). Regulating Airbnb: How cities deal with perceived negative externalities of short-term rentals. Current Issues in Tourism. Advance online publication. 1–15. doi: 10.1080/13683500.2018.1504899
- Nikkei Asian Review. (2018, June 4). Airbnb removes 80% of Japan home-share listings. Retrieved from https://asia.nikkei.com/Business/Airbnb-removes-80-of-Japan-home-share-listings
- NOAA. (2019). Global self-consistent, hierarchical, high-resolution geography database (GSHHG). Retrieved from https://www.ngdc.noaa.gov/mgg/shorelines/
- OpenSnowMap. (2019). data.opensnowmap.org. Retrieved from http://www.opensnowmap.org/iframes/data.html#osm
- Oskam, J. A. (2019). The future of Airbnb and the ‘sharing economy’: The collaborative consumption of our cities. Bristol: Channel View.
- Pawlicz, A. (2019). Ekonomia współdzielenia na rynku usług hotelarskich. Niedoskonałości. Pośrednicy. Regulacje [Sharing economy in the hospitality market. Imperfections – intermediaries – regulations]. Szczecin: Uniwersytet Szczeciński.
- Pebesma, E. (2018). Simple features for R: Standardized support for spatial vector data. The R Journal, 10, 439–466.
- Pung, J. M., Del Chiappa, G., & Sini, L. (2019). Booking experiences on sharing economy platforms: An exploration of tourists’ motivations and constraints. Current Issues in Tourism. Advance online publication. 1–13. doi: 10.1080/13683500.2019.1690434
- Quattrone, G., Proserpio, D., Quercia, D., Capra, L., & Musolesi, M. (2016). Who benefits from the “sharing” economy of Airbnb? In Proceedings of the 25th international conference on world wide web – WWW‘16. (pp. 1385–1394). New York, NY: ACM Press
- Roelofsen, M. (2018). Exploring the socio-spatial inequalities of Airbnb in Sofia, Bulgaria. Erdkunde, 72(4), 313–327.
- Ruiz-Correa, S., Ruiz-Correa, I., Olmos-Carrillo, C., Rendón-Huerta, F. A., Ramirez-Salazar, B., Son Nguyen, L., & Gatica-Perez, D. (2018). Mi Casa es su Casa? Examining Airbnb hospitality exchange practices in a developing economy. ACM Transactions on Social Computing, 2(1), 1–24.
- Schaal, D. (2019, May 29). Airbnb tests hotel integration by adding some HotelTonight partners. Skift. Retrieved from https://skift.com/2019/05/29/airbnb-starts-adding-some-hoteltonight-partners-in-next-move-into-the-hotel-business/
- Shan, S. (2018, August 2). Taiwan would rank 14th in UN’s ICT index: NCC. Retrieved from http://www.taipeitimes.com/News/taiwan/archives/2018/08/02/2003697836
- Simplemaps. (2019). World cities database. Retrieved from https://simplemaps.com/data/world-cities
- Slee, T. (2018). Data collection for Airbnb listings. Retrieved from https://github.com/tomslee/airbnb-data-collection
- Strommen-Bakhtiar, A., & Vinogradov, E. (2019). The adoption and development of Airbnb services in Norway. International Journal of Innovation in the Digital Economy, 10(2), 28–39.
- Ting, D. (2017, November 15). Airbnb growth story has a plot twist – A saturation point. Skift. Retrieved from https://skift.com/2017/11/15/airbnb-growth-story-has-a-plot-twist-a-saturation-point/
- Ting, D. (2018, February 27). This is how Airbnb plans to win over hotels. Skift. Retrieved from https://skift.com/2018/02/27/this-is-how-airbnb-plans-to-win-over-hotels/
- Ting, D. (2019, February 7). Airbnb hires aviation industry veteran to lead new transportation division. Skift. Retrieved from https://skift.com/2019/02/07/airbnb-hires-aviation-industry-veteran-to-lead-new-transportation-division/
- Tussyadiah, I. P. (2016). Factors of satisfaction and intention to use peer-to-peer accommodation. International Journal of Hospitality Management, 55, 70–80.
- UNWTO. (2019). International tourism highlights, 2019 Edition. Madrid: World Tourism Organization.
- Wegmann, J., & Jiao, J. (2017). Taming Airbnb: Toward guiding principles for local regulation of urban vacation rentals based on empirical results from five US cities. Land Use Policy, 69, 494–501.
- Wickham, H. (2016). Ggplot2: Elegant Graphics for data analysis. New York, NY: Springer-Verlag.
- World Bank. (2019). World Bank Open Data. Retrieved from https://data.worldbank.org/
- Xiang, Y., & Dolnicar, S. (2017). Networks in China. In S. Dolnicar (Ed.), Peer-to-Peer accommodation networks (pp. 148–159). Oxford: Goodfellow Publishers.
- Zervas, G., Proserpio, D., & Byers, J. (2015). A first look at online Reputation on Airbnb, where every stay is Above average. SSRN repository. doi:10.2139/ssrn.2554500.
- Zhang, G., Cui, R., Cheng, M., Zhang, Q., & Li, Z. (2019). A comparison of key attributes between peer-to-peer accommodations and hotels using online reviews. Current Issues in Tourism. Advance online publication.doi:10.1080/13683500.2019.1575339.