
 ?Mathematical formulae have been encoded as MathML and are displayed in this HTML version using MathJax in order to improve their display. Uncheck the box to turn MathJax off. This feature requires Javascript. Click on a formula to zoom.
ABSTRACT
The economy of Small Island Developing States (SIDS) is highly dependent on tourism and travel sector. Under the impact of COVID-19, these islands have suffered strongly. Possible recovery strategies are tested through exploring the concept of risk perception as an important factor to influence the behaviour intention under the framework of theory of planned behaviour (TPB). A behavioural simulation is built to help evaluate tourism policies. This paper takes Maldives as an example. Four strategies are tested in the model: social distancing, tax reduction strategy, travel bubble strategy and joint strategy. The results show that the most effective way to change tourist behaviour intention is the travel bubble strategy. The results also indicate that the reduction in tourism arrivals may bring opportunities for local ecosystem recovery. This study exemplifies the advantage of using the system dynamics approach when the past pattern is not a good predictor for the future by making predictions based on how the system works.
1. Introduction
Small Island Developing States (SIDS) have unique vulnerabilities and characteristics: small scale, remote location, limited resources, and the risk of facing exposure to global environmental challenges and external economic shocks (Briguglio, Citation1995). The outbreak of the new coronavirus (COVID-19) is undoubtedly a global disaster, in the past decades, no other epidemic has had a similar impact on the global economy as the COVID-19 pandemic (Gössling et al., Citation2020). Many countries carry out the travel restrictions and the lockdown policy to control the spread of the virus, which has severely affected the service sector, especially the tourism industry. On April 20, in response to COVID-19, 100% of destinations around the world have implemented travel-related restrictions, 45% of destinations have completely or partially closed the border, and 30% of destinations have suspended all or some international flights (Unwto.org. (Citation2020b)). The UNWTO estimated the international tourist number could fall 60-80% throughout the year (Unwro.org.(Citation2020a)).
Under the impact of COVID-19, SIDS are most fragile as their economy is highly dependent on tourism and travel sector which accounts for 30% or above of the gross domestic product (Unctad.org., 2020). The tourism industry generates around $30 billion per year in SIDS. A 25% drop in tourism receipts will lead to a 7.3% fall in GDP. In some SIDSs, the decline in GDP may be more severe, reaching 16% in Seychelles and Maldives (United Nations, Citation2020). Hence, it is important for these islands to respond quickly to the epidemic crisis by understanding the tourist behaviour during this unsettled time in order to figure out how to recover from the impact of pandemic.
To capture the tourist behaviour under COVID-19, risk is regarded as a priority consideration for travel and it is a crucial factor in the tourist decision-making process (Kozak et al., Citation2007). Risk perception is a set of subjective beliefs and personal judgments about uncertain situations that may lead to risks (Bauer, Citation1960). In tourism, risk may arise from terrorism, natural disasters, accidents and epidemics, which will cause different kinds of risk such as financial, psychological, and healthy risks (Bae & Chang, Citation2020).
Simulation approaches have been recognized as an effective tool on destination management (Lu et al., Citation2019). Particularly, system dynamics (SD), a computer-based simulation tool, has been applied to analyze the dynamic interactions of the tourism system over time (Zhang et al., Citation2015). SD is dependent on the causal relationships among system variables (Sterman, Citation2000). Other prediction models, such as time series forecast models and neural network models, are highly dependent on historical data and previous trends so they will perform poorly when conditions are unstable and the structure of the data has changed dramatically (Luo et al., Citation2020). COVID-19 is a new type of pandemic and its characteristics and degree of interaction with the world are different from the past pandemics. In this case, the past is not a good predictor for the future. Since SD makes predictions based on how the system works rather than past patterns, it becomes an appropriate method for rehearsing strategies (Kunc & Morecroft, Citation2007).
Previous studies have employed SD for island planning in areas such as environment management (Banos-González et al., Citation2016; Dvarskas, Citation2017; Kapmeier & Gonçalves, Citation2018; Nugroho et al., Citation2019). Although some scholars have explored the ability of SD in crisis management (Carlini & Tsaples, Citation2015; Pruyt, Citation2010; Sharareh et al., Citation2016), few studies have integrated the risk perception in the SD model to simulate the tourist behaviour.
Hence, the objective of this paper includes three aspects. Firstly, the paper introduces the risk perception under the framework of theory of planned behaviour (TPB) as an important factor to capture the tourist behaviour changes during the COVID-19. Secondly, an SD simulation model is proposed for SIDS to understand the impact of pandemic on the destination. In order to have a more comprehensive insight of the entire system, the model includes five sub-models that represent the social, economic and environmental sectors of the destination. Thirdly, to support decision-making, four strategies are tested in the model for the destination tourism recovery. Our contributions to the literature are to understand how tourist behaviour changes during the COVID-19 and rehearse possible recovery strategies for tourism recovery.
2. Literature review
2.1 Risk perception and tourist behaviour during COVID-19
In the field of tourist behaviour research, the TPB has been applied to understand tourist motivation and the decision-making process of travel destination choice (Ghaderi et al., Citation2018; Lam & Hsu, Citation2006; Mohammad & Neda, Citation2012; Sergey & David, Citation2016; Soliman, Citation2019). TPB is developed by Ajzen (Citation1991), it is an extension of the theory of reasoned action (TRA) (Fishbein & Ajzen, Citation1977) and became one of the frequently studied consumer behaviour models. When consumers making their decisions, TPB considers three dimensions that include both social and psychological factors. The dimensions are attitude toward the behaviour, subjective norm and perceived behaviour control.
How risk perception influences the tourist behaviour and the relationship between risk perception and the TPB was studied by Quintal et al. (Citation2010). Their finding illustrated that perceived risk has a significant negative impact on tourist’s attitude towards a destination. The same result is also found in the study by Bae and Chang (Citation2020) who indicated the affective risk perception was positively influenced by the attitudes, and the subjective norms are influenced by the cognitive risk perceptions. With the consideration of the risk perception, TPB can be extended as shown in .
Figure 1. The TPB with risk perception.
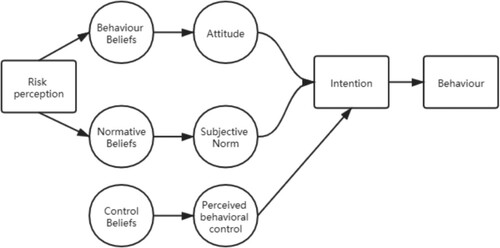
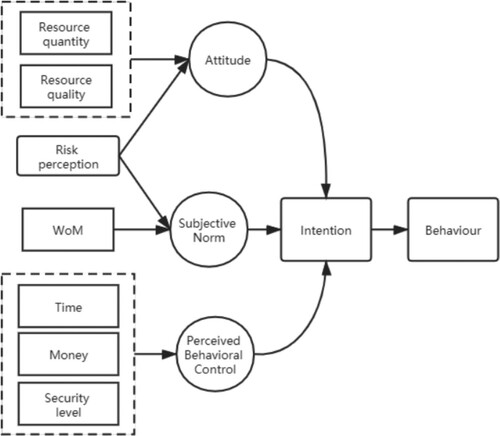
After considering the risk perception, the following paragraphs review how to measure each dimension of the tourist behaviour intention model. The framework of tourist intention model under the COVID-19 is shown in .
Figure 2. Tourist travel intention model based on TPB and risk perception.
2.1.1 Attitude toward the behaviour
Attitude toward the behaviour is the individual’s assessment of the performance of a certain behaviour and the belief in the behaviour (Ajzen, Citation1991). For tourists, their evaluation of the outcome usually comes from the tourism resources, which provide them with tourism attractions and activities to visit and enjoy (Leisen, Citation2001). For a destination, the quality and quantity of tourist resources contribute to the destination image and therefore become a key factor to measure the enjoyment of travel (Fan et al., Citation2019; Reza Jalilvand et al., Citation2012). Furthermore, risk perception has a significant impact on attitudes during the pandemic period (Bae & Chang, Citation2020).
2.1.2 Subjective norm
A subjective norm is a social pressure that affects an individual’s behaviour; it can encourage and discourage one’s actions (Hsu & Huang, Citation2012). Previous research has proven that word of mouth (WoM) has a strong influence on subjective norms. Since social norms put pressure on tourists’ intentions, WoM can play a better role than market experts and opinion leaders (Guo et al., Citation2010). Also, risk perception can positively affect subjective norms (Bae & Chang, Citation2020). When individuals perceive threats and risks from a disease, they will be more likely to comply with social norms so strong peer pressure will prompt individuals to reconsider their behaviour intention to follow social trends. During COVID-19, public information from social media will influence people’s expectations of what others might do and what is appropriate to do (Berger, Citation2020). For example, to prevent from getting pandemic, new social norms came into being, people change their greeting behaviour from shaking hands to gain footing, a foot-to-foot greeting also known as Wuhan shake (Mishagina et al., Citation2020).
2.1.3 Perceived behavioural control
Perceived behavioural control refers to an individual’s ability to conduct an action (Ajzen, Citation1991). It represents an individual’s belief whether he can control and manage the required resources to achieve the behaviour (Bae & Chang, Citation2020). Therefore, perceived behavioural control is related to people’s own capabilities such as time and money to perform a behaviour. Also, the security level of the destination is a factor that affects the perceived behaviour control of tourists (Fan et al., Citation2019; Quintal et al., Citation2010).
Hsu and Huang (Citation2012) demonstrated that TPB is an effective framework for analyzing tourist intention of visiting a destination. The three dimensions of TPB all have a direct and positive influence on tourist behaviour intention. Specifically, subjective norm has a very significant effect (β = 0.349), perceived behaviour control has a lower impact (β = 0.241) and the influence of attitude is the smallest (β = 0.209) (Hsu & Huang, Citation2012). Their findings are consistent with the study by Lam and Hsu (Citation2006), which show that subjective norms have a salient significant influence, followed by perceived behavioural control, and attitude is less important than the other two dimensions.
2.2 SD models for tourism destination management
Tourism destination is a complex social ecosystem that is affected by various internal and external factors (Morrison & Mill, Citation1985), the interactions and the relationship among these components are nonlinear (Baggio, Citation2008). When predicting the future, prediction models such as time series models and econometric models are based on historical data. These models assume that the past is a good predictor of the future and they use the previous trend to estimate the future (Mai & Smith, Citation2018). In contrast, a simulation tool can handle the uncertainty in a complex context because it focuses on the interactions between system components. These interactions of variables and factors may form the feedback loops within the system that can be explained the system’s behaviour. How the feedback loops drive the behaviour of the system can be explained using SD theory (Sterman, Citation2000).
SD has been used for different areas of research in tourism, such as accommodation (Dhirasasna et al., Citation2020; Rudan, Citation2014), natural attractions (Luo et al., Citation2020; Nugroho et al., Citation2019), tour operators (Marko, Citation2014) and some specific areas religious tourism (Jakulin & Clarke, Citation2017) and event tourism (Golob & Jere, Citation2014). In recent years, the most widely used area of SD is destination management (Lu et al., Citation2019). Destination management not only involves tourist attractions and related services but also includes the interests of local residents and other considerations (Marko, Citation2014). Therefore, system thinking is important to understand how the tourism industry interacts with society, economy and local communities, and the system approach will provide a means to explore potential solutions (Marko, Citation2014; Walker et al., Citation1998).
SD allows managers to change decision variables and visualize how the situation changes, so each strategy can be evaluated before execution. SD model development can involve stakeholders directly or indirectly in the model development stage. For example, Tan et al. (Citation2018) built an SD to assess coastal tourism sustainable development with local stakeholders using the Delphi method. Combined with scenario planning, SD can be a tool to anticipate the unexpected real world, it has the ability to deal with uncertainty in tourist destination planning (Maani & Cavana, Citation2007). Carlisle et al. (Citation2016) combined SD model with the strategic planning approach to evaluate the development path of a tourism city. Similarly, Mai and Smith (Citation2018) use an SD model to evaluate five tourism development scenarios for a Vietnam island. The results indicated that if the island continues to develop according to the status quo, it may face water shortages, overcrowding and other sustainable problems.
To sum up, previous studies have proven that SD modelling can be used for tourism destination management. It can explain the feedback loops, estimate future trends and enables policymakers to test possible strategies to solve the problem (Lu et al., Citation2019). Under the challenge of COVID-19, SD becomes a practical tool to predict the future trend by using the feedback loops among the relationships. The combination of risk perception and the SD model will help us understand the behaviour of tourists and further support the recovery of the tourism industry by testing policies that can change the intention of tourists.
3. Research methods
3.1 SD as methodology
As a methodology, SD can be used for both quantitative and qualitative analysis (Kunc, Citation2017). According to the study of Kunc (Citation2017), there are two modes of interventions in SD. The first mode is the descriptive mode (or qualitative modelling). The model focuses on understanding and capturing the system, and the main tool to achieve this goal is using the causal loop diagram (CLD), which does not rely on quantitative data (Checkland, Citation1985). The purpose of using SD as a qualitative analysis method is to promote system thinking and to describe a complex system in detail (Homer & Oliva, Citation2001). The second mode is predictive mode, which uses quantitative methods to solve problems. Data is required to parameterize SD models, so that system behaviour can be simulated and hypotheses can be tested (Forrester, Citation1994).
Behaviour modelling is a field that has attracted widespread attention in recent years. It needs to integrate theories of different disciplines to study behavioural problems (Kunc et al., Citation2016). Kunc (Citation2016) demonstrated SD can be used in this area in three ways. Firstly, SD can be used in laboratory experiments of individual decision-making processes in a complex and dynamic context. Secondly, the SD model can be embedded in the organization and competitive environment. Support the organizational process by conducting before and after experiments. Lastly, SD can be used as a behavioural theory development tool because it can discover the theory-in-use in organizations.
In this study, SD as a methodology is used both for qualitative and quantitative behavioural modelling. First, SD will be used qualitatively to provide a holistic understanding of the impact of COVID-19 on the SIDS and on changes in tourist behaviour. Next, the SD model will be used quantitatively to test policies for tourism industry recovery.
3.2 Case description and data collection
The Maldives is selected as the case in this study. The main reason for choosing the Maldives is that the economy of this country is highly dependent on the development of tourism, which is the main source of foreign exchange and the largest source of Gross Domestic Product (GDP) of the Maldives. In 2018, the tourism industry contributed a total of 17 million Rufiyaa and accounted for 24.5% of its GDP, while the primary sectors (i.e. agriculture and fishers) only contributed 4.9% to the GDP. Besides, the government revenue is mainly generated from the tourism revenue, which accounted for 34.4% of government revenue in 2018 (Ministry of Tourism Maldives, Citation2019).
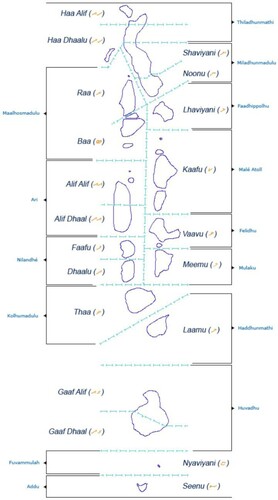
The Maldives is formed by a group of islands located in the Indian Ocean (). It has 22 geographical atolls, including approximately 1200 islands. Among them, only about 200 islands are inhabited, and the remaining islands are mainly used for tourism. Tourism in the Maldives began in 1972 when two resorts were opened providing 280 beds for tourists. Over the years, resorts have developed and expanded dramatically, and at the end of 2018, there were 145 resort islands with 32,137 beds for accommodation in Maldives. The beautiful and unique natural environment of the Maldives attracts more and more tourists. Tourist arrival has grown at an average annual rate of 12% since 1979, amounting to 1.7 million in 2018 (Ministry of Tourism Maldives, Citation2019). If not affected by COVID-19, the Maldivian government predicts that the number of tourists visiting will reach 2.5 million by 2023 (Travel Trade Maldives, Citation2020).
Figure 3. Map of Maldives (source: https://commons.wikimedia.org/wiki/File:Atolls_of_the_maldives.jpg).
However, the unexpected COVID-19 pandemic has had a huge impact on the tourist industry of the Maldives. Starting in February 2020, the number of tourists has decreased significantly. The Maldives closed their borders on March 27, so no tourists had arrived between April and June 2020. The Maldives were reopened to international tourists in July and only 1752 tourists visited the Maldives, a decrease of 98.7% compared to July 2019 (Ministry of Tourism Maldives, Citation2019). shows the number of tourists from July to November after the reopening. The figures show that compared with last year, there has been an average decrease of 70% from January to November in 2020 (Ministry of Tourism, Citation2020). also provides some information about the changes in Maldives GDP during this server period.
Table 1. Number of tourists changes between 2019 and 2020.
Table 2. Changes in gross domestic product from 2018Q3 to 2020Q3.
Data for building the SD model were mostly collected from Maldives government official data, which includes Ministry of Tourism Maldives (from 2017 to 2019) (http://statisticsmaldives.gov.mv/), the Maldives Ministry of Tourism (from 2017 to 2019) (https://www.tourism.gov.mv/), the Maldives Immigration (from 2017 to 2019) (https://immigration.gov.mv/) and the Maldives Ministry of Health (in 2020) (https://covid19.health.gov.mv/en).
3.3 Model development
3.3.1 Modelling time and objective
The model starts to simulate Maldives tourism industry in January 2017, and it simulates the historical tourism development of the Maldives from 2017 to June 2020. Next, the model will simulate the local tourism from July 2020 to the end of 2021. The modelling process aims to capture the tourist behaviour intention changes during the COVID-19 and to understand the impact of pandemic on the Maldives. Therefore, the tourism behaviour intention and the tourist arrival are two performance variables in the model. Other performance variables, such as goods and service tax from the tourism sector, the waste generated by tourists and unemployment rate are used to understand the influence of COVID-19 from a holistic view including the consideration of social, economic and environmental condition.
To simplify the description of the entire model, we divide the model into five sub-models. They are tourist arrival and tourism economy, tourism resort, residents and population, waste and pollution and health care. The parameters, equations and functions for each variable are listed in the Appendix 1.
3.3.2 Tourist arrival and tourism economy
The tourist arrival and tourism economy () concern with the number of tourist arrival in the Maldives and the tourism revenue generated from tourists. Therefore, the main stock and flows are the number of tourists, who will arrive in the Maldives and stay in the resort for a few days. After that, they will leave the destination and return home.
Figure 4. Tourist arrival and tourism economy subsystem. (The rectangle is the stock and the black arrowheads are flows. Flows will change the stock, which will generate behaviours in the system. The hexagons are policy variables. Others are variables and parameters that affect changes in stock and flow).
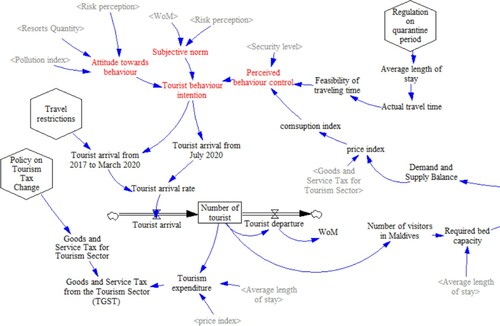
We use TPB to explain tourist behaviour intention. Hence, in our model, the number of tourist arrival is influenced by the tourist behaviour intention. The tourist behaviour intention is influenced by attitude toward behaviour, subjective norm and perceived behavioural control.
The attitude toward the behaviour is measured by resorts quantity, pollution index, and risk perception. Resorts quantity represents the abundance of local tourism resources. Pollution is an important indicator of the quality of natural beauty, it is detrimental to a destination's image (Xu & Reed, Citation2017). In the Maldives, 11.5% of waste is not properly treated and causes pollution (Maldives National Bureau of Statistics, Citation2016). Furthermore, risk perception is measured by two variables, the influence of the number of tourist active cases and the occupied rate of hospital bed.
The subjective norm is calculated by WoM and risk perception. According to Maldives visitor survey (Ministry of Tourism, Citation2017), internet and WoM are the two main sources of information for tourists to explore the Maldives. It is noteworthy that 98% of the visitors stated that they would recommend the Maldives to others (Ministry of Tourism, Citation2017). This indicates that WoM is an important variable to measure the subjective norm. Also, as discussed in the literature review, risk perception can positively affect the subjective norms (Bae & Chang, Citation2020).
The perceived behavioural control is measured by three variables in the SD model, which are leisure time, destination consumption index and security level. The traveling time is important under the COVID-19 since the quarantine regulation is applied for international travellers. When actual travel time becomes longer, the tourism behaviour will be more difficult due to the limited leisure time. The consumption index is used to measure affordability of the tourist destination. The local price variable that influenced by the destination demand and supply function will influence affordability of the tourist destination. Affordability of Maldives tourism is influenced by seasons. In the peak season, more visitors will come, so the demand and supply function will increase, leading to a rise in the local price index. Therefore, as accommodation and transportation prices increase, travel expenses during peak seasons will increase. The security level reflects the perception and control of tourists to safely visit the destination (Fan et al., Citation2019). It also affects whether personal travel can be achieved. Destinations with higher crime rates will reduce tourists’ behavioural control over travel safety, therefore, affecting the choice of tourists in various destinations(Ferreira & Harmse, Citation2000).
After calculating tourist arrivals, the model will simulate the goods and service tax from the tourism sector, which can be used to represent the economic income from tourism. Appendix 2 summarizes the detailed explanation of each variable.
3.3.3 Tourism resort subsystem
This subsystem () focused on the development of resorts and the bed capacity utilization in the Maldives. As mentioned in the previous paragraph, the number of resorts represents the abundance of local tourism resources and further affects tourists’ attitudes towards destinations. In addition, the number of resorts also determines the number of beds that the destination can provide and accommodate travellers. There is one stock and flow in this sub-model, which is the development of new resorts. The developing rate of the resorts is dependent on bed capacity utilization, and a higher occupancy rate will bring more revenue and result in more resorts being developed (Kapmeier & Gonçalves, Citation2018).
Figure 5. Tourism resort subsystem.
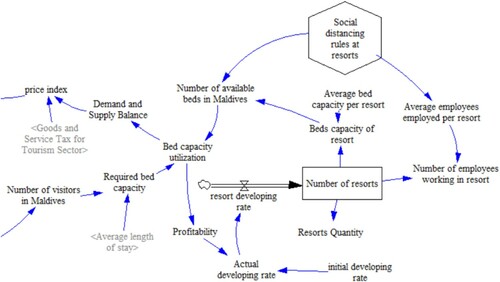
To compute bed capacity utilization, the model uses the ratio between the number of beds required and the number of beds available. According to the data from the (Ministry of Tourism Maldives, Citation2019), during the entire visit, 75% of tourists will choose to stay on a specific resort island, while the remaining tourists will book hotels for accommodation. To simplify the simulation, the SD model only considers the resorts beds capacity. Based on this assumption, the number of beds required can be calculated in EquationEquation 1(1)
(1) . As for the number of beds available in the Maldives, the model uses the total number of resorts multiplied by the average number of beds per resort. The ratio of these two variables will determine the supply and demand function (Equationequation 2
(2)
(2) ) and affect the price index of the Maldives. As demand increases during the peak seasons, the price will rise, and when demand decreases, the price will fall accordingly. Also, when the demand for bed is high, or, in other words, the resort occupancy is high, the profitability to develop and build more resorts will be high:
(1)
(1)
(2)
(2)
3.3.4 Residents and population subsystem
The model simulates the dynamic population growth of Maldives in this subsystem (). The purpose of this part of the model is to understand the impact of tourism on local employment and immigration growth.
Figure 6. Residents and population subsystem.
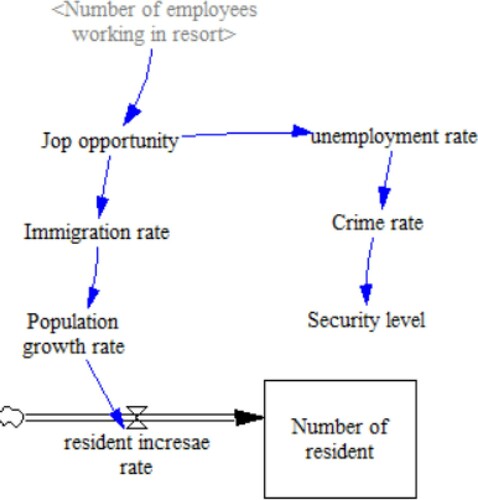
There is one stock and flow in this subsystem: the dynamic of the number of residents. The population growth rate is influenced by the changes in the immigration rate. If the Maldives could provide more job opportunities, the immigration rate will increase, and the population growth rate will increase accordingly. The resort provides great employment opportunities and attracts many immigrants. According to Maldives National Bureau of Statistics (2019), 53% of the workers employed are foreigners. On the other hand, if the job opportunity is low in Maldives, the unemployment rate will increase, which will lead to the risk of increasing the crime rate and decreasing the security level of Maldives. The security level will then influence tourists’ attitude toward the destination, thereby decreasing the tourism behaviour intention and the number of tourist arrival as a feedback loop.
3.3.5 Waste and pollution subsystem
The waste and pollution sector () focuses on the dynamics of the Maldives solid waste generation and disposal process. The motivation for establishing this subsystem is to understand how the tourism industry affects the local environment by generating waste and pollution.
Figure 7. Waste and pollution subsystem.
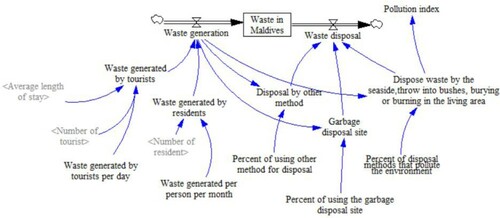
Specifically, the solid waste generated in the Maldives can be divided into two parts, waste produced by the local residents and the tourists (Kapmeier & Gonçalves, Citation2018). According to the data from Maldives National Bureau of Statistics (2019), the Maldives generate about 365,000 tons of solid waste per year, the solid waste produced by the resorts is 3.5 kg per person per day, and the solid waste generated in Male and inhabited islands is 1.8 and 0.8 kg per person per day, respectively. Thus, the solid waste generated by tourists can be calculated in EquationEquation (3(3)
(3) ). The unit for this equation is kilogram. To simplify the calculation, the model uses the average waste weight by the proportion of population in Male and other areas (i.e. 1.2 kg), the equation is shown below (4), the unit is kilogram.
(3)
(3)
(4)
(4)
In the Maldives, 87.2% of solid waste is disposed on the garbage disposal site, while 11.5% of the solid waste is not properly handled (Maldives National Bureau of Statistics, Citation2016). The waste thrown into the ocean and bushes leads to pollution. The SD model uses a pollution index to measure the environmental degradation caused by solid waste, and then the index will affect the attitude of tourists towards the destination and further influence the tourist behaviour intention as a feedback loop.
3.3.6 Health care subsystem
This subsystem () is mainly concerned about the tourist COVID-19 active cases in the Maldives and the occupation of hospital beds. The objective of building this sub-model is to understand whether the destination has the ability to control infection and whether the local healthcare system can operate smoothly.
Figure 8. Health care subsystem.
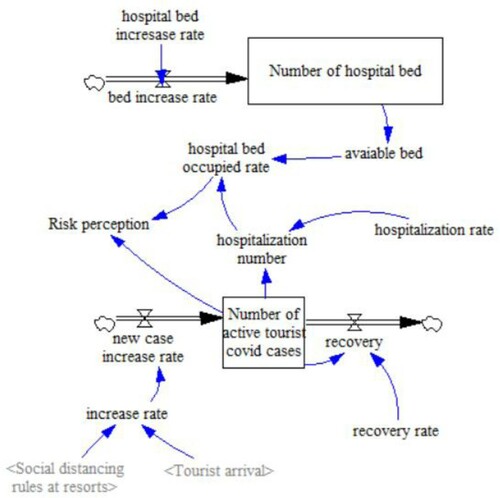
The first stock in this sector is the number of active tourists COVID-19 cases, which calculates the confirmed cases of tourists who visit Maldives. Since the Maldivian government reopens its tourism industry from 15 July, the number of active cases is counted from July 2020 in the model. The number of tourist active cases is dependent on the flow of new cases increases the rate and the recovery rate in Maldives. The new cases increase rate is affected by the number of tourist arrival and social distancing policies. The agent-based model provided by Orazio et al. (Citation2020) indicates that when adopting social distancing regulation, contagious transmission can be limited. Since the number of active cases is an indicator of the pandemic situation, this figure is used as a proxy of the tourists’ risk perception of the destination.
Also, the average hospitalization rate is used to calculate the number of hospitalizations. The occupancy rate of hospital bed is another important indicator for estimating whether the destination can treat patients effectively without overload. The two variables influence the risk perception of the destination and affect the tourism behaviour intention as a feedback loop.
3.4 Model verification and validation
Before performing estimation and investigation, it is necessary to find any problems with the model (Moon, Citation2017). The verification process is to ensure the model is built right, which requires checking the external consistency of the model and comparing the conceptual model with the simulated model (Fan et al., Citation2019). Usually, the verification process includes model coding debugging and model structure test (Nugroho et al., Citation2019). To verify this model, the first step is to debug the code using the self-test function in Vensim. The software displays all warnings and errors for checking and debugging. After correcting all errors in the model, the code is double checked by the tester. The next step is to conduct the model structure test, which is verified by the literature review and the feedback loop test. The results show that all the feedback loops performed the expected behaviour, balancing loops show the balancing behaviour and positive loops perform the reinforcing behaviour.
The validation process is to ensure the model represents reality, which requires checking the internal consistencies in the model (Fan et al., Citation2019; Lu et al., Citation2019). The SD model is not designed for accurate simulation but to understand the system structure and behaviour trends from a dynamic and comprehensive perspective (Tan et al., Citation2018). The most common way to valid the simulation model is to conduct a historical data fit (Banos-González et al., Citation2016; Lu et al., Citation2019). The average absolute percentage error (MAPE) and normalized root mean square error (NRMSE) from 2017 to 2019 are calculated in . The performance of the model shows a high degree of fit between the simulation results and the actual value. MAPE and NRMSE for all variables are below 10%, which indicates that the model has a good fit for the historical data (Andarzian et al., Citation2011; Goh & Law, Citation2002).
Table 3. Historical fit result (2017–2019).
4. Strategy design and result evaluation
4.1 Strategy design
The base scenario simulated the historical tourism development of the Maldives from 2017 to June 2020. Then, the base scenario will model the changes in tourist arrival and the impact of COVID-19 after Maldives reopen its border in July 2020. The base scenario will simulate local tourism until the end of 2021. The model assumes that global medical vaccines will not be realized until the end of 2021, so COVID-19 will continue to spread globally in 2021.
In order to recover the tourism and attract more tourists to visit Maldives, four possible strategies are designed and tested in the model. The parameter settings for these different strategies are summarized in .
Table 4. Parameter settings in different strategies.
The first strategy is to implement social distancing rule among the resort, which aims to control the active cases in Maldives. The introduction of social distancing in resorts reduces capacity. Hence, in the model, the number of available beds per resort and the number of employees in each resort are reduced under this strategy.
The second strategy is to conduct price promotion by reducing the goods and service tax from the tourism sector. Pricing is one of the most important components in tourism marketing (Ciriković, Citation2014). The policy of reducing tourism goods and services tax is a marketing strategy for price promotion. During the COVID-19, many countries have already taken the strategy of reducing taxes to support economic recovery (KPMG, Citation2020; UK Government, Citation2020). To apply this strategy, the tax rate on tourism sector will be reduced to encourage tourists to visit.
The third possible strategy is to build bilateral travel bubbles, state-level agreements that allow inbound tourists from certain countries (Development Asia, Citation2020). A travel bubble usually requires a COVID-19 test before traveling and allows a shorter isolation period. This can greatly improve travel intentions. For example, Thailand is negotiating with China to build a quarantine-free travel bubble by January 2021 to recover its tourism economy (China Daily, Citation2020). Australia resumed its travel bubble with New Zealand in January 2021, which means that the arrivals entering from these two countries will not need a 14-day quarantine. To lower the risk, Australia requires passengers from New Zealand to be screened before and after the flight (Aljazeera, Citation2021). Similarly, New Zealand and Cook Islands have agreed to a quarantine-free travel bubble. This travel arrangement will be in place in the first quarter of 2021(Australian Associated Press, Citation2020). Hence, to apply this strategy, the first step is to implement a shorter quarantine policy. Next, the perceived security level of a destination needs to be high enough because a travel bubble agreement indicates a sign of trust.
The last strategy is a joint strategy that combines the social distancing strategy, the tax reduction strategy and the travel bubble strategy. The reason for designing this strategy is to explore the possibility of combining different policies for a better solution. The parameter settings for this strategy are listed in .
4.2 Simulation results
4.2.1 Base scenario
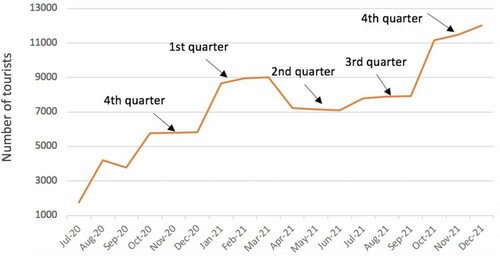
The results of the basic scenario () show that until January 2020, the number of tourists has been increasing steadily. However, after the global COVID-19 outbreak in 2020, there has been a dramatic decline, the arrival of tourists continued to decline until the implementation of comprehensive travel restrictions in the Maldives in April 2020, therefore no tourists entered the Maldives from April 2020 to June 2020. shows the simulation result for tourist arrivals from July 2020 to December 2021. Although the number of tourists will start to increase after the reopening of the Maldives tourism industry, the number of tourists arriving is still much lower than before COVID-19. Compared with 2019, the average number of visitors from July to November 2020 has decreased by 88.8%. Moreover, due to the seasonal characteristics of the Maldives tourism industry, the model estimates that the number of tourists will increase in the fourth quarter of 2020 and the first quarter of 2021. The real data in also shows that since October 2020, the number of tourists has greatly increased.
Figure 9. Simulation results of the number of tourists from January 2017 to June 2020 (in thousands).
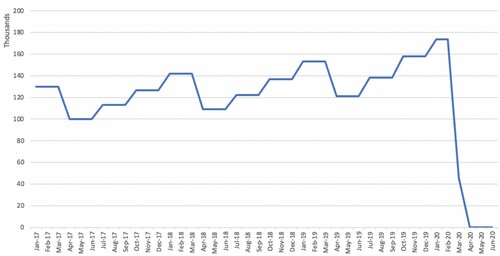
Figure 10. Simulation results of the number of tourists from July 2020.
The decline in the number of tourists is mainly due to the changes in tourist behavioural intentions. More specifically, as the risk perception increases after COVID-19 spreads worldwide, travel intentions decrease accordingly. The risk perception has significant impacts on subjective norm and attitude towards behaviour. When tourists noticed that there are several activity cases in the potential destination, their positive attitudes may change and tend to have a more conservative attitude towards tourism behaviour. Similarly, social pressure from family and friends will also force tourists to reconsider their travel plans to comply with social norms.
4.2.2 Social distancing rules
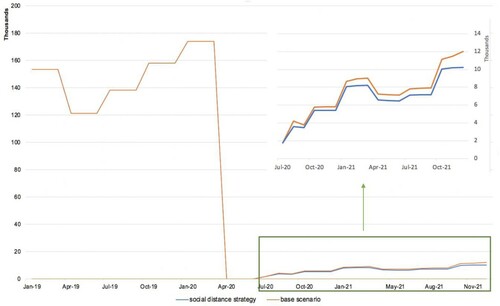
The result of this policy cannot effectively attract tourists, but it can control the number of COVID-19 cases among tourists to a certain extent. However, as the number of employees in resorts also decreases, job opportunities will be affected, and the unemployment rate will rise. Meanwhile, this reduction will rise the local unemployment rate and will increase the potential crime rate at the destination accordingly. The model assumes that the increase in crime rate will have an immediate effect on the destination image, reducing the positive attitude of tourists on the security level of the destination. Hence, the number of tourists slightly reduced under this policy compared with the base scenario ().
Figure 11. Prediction results of number of tourists under the social distancing strategy (in thousands).
4.2.3. Reducing the tourism tax
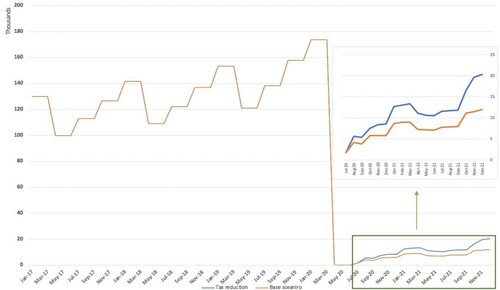
The result of this strategy is quite effective. After applying this strategy, the tourist arrival increases compared with the base scenario (). The changes in tourist behaviour are due to the increase in tourism behaviour intention. Price promotion will rise the perceived behaviour control because tourists’ payment capacity increases. However, as the number of tourists increases, the cross transmission between local people and international tourists will also increase. Hence, the number of active cases among tourists may rise under this strategy. In this case, the risk perception is still high, and the number of tourists cannot return to the level before COVID-19. Although the tax reduction strategy may attract more tourists, lowering the tax rate will also reduce the tourism income, which means that this strategy may not help the local economic recovery.
Figure 12. Prediction results of number of tourists under the tax reduction strategy (in thousands).
4.2.3 Establishing travel bubbles
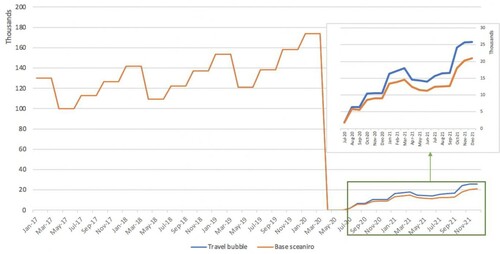
This strategy is useful because it can change the tourist behaviour intention from two aspects. On the one hand, tourist perceived behaviour control will be improved because a shorter quarantine policy is applied, which will save the actual travel time of tourists and provide convenience for potential travellers with limited leisure time. On the other hand, the establishment of a travel bubble will also increase the perceived security level of a destination. An agreement between countries is usually more reassuring, which is an expression of mutual trust. Hence, tourists’ perceived control over their behaviour has been strengthened, and tourists’ attitudes towards the destination have become more positive. This brings an increase in the number of tourist arrivals ().
Figure 13. Prediction results of number of tourists under travel bubble strategy (in thousands).
4.2.4 Joint strategy
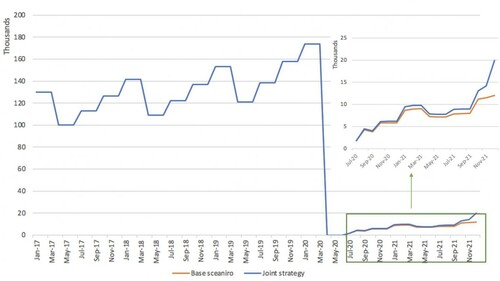
Combining all three strategies together will not make a significant improvement in attracting visitors to the Maldives. As shown in , the number of tourist arrival increases slightly. The main reason for this is that while the tax reduction strategy and tourism bubble strategy can increase the number of visitors, the application of social distancing rules can reduce the tourism accommodation capacity of the resorts, which in turn will lead to an imbalance in the supply and demand function and reduce tourism behavioural intentions. Therefore, this joint strategy does not provide a better solution for the destination.
Figure 14. Prediction results of number of tourists under the joint strategy (in thousands).
4.2.5 Result comparison
By comparing the estimated number of tourists under these four strategies (), the most effective way to change tourist behaviour intention is the travel bubble strategy, followed by the tax reduction strategy, while the social distancing strategy and the joint strategy are not very useful in attracting tourists. However, the simulation results under all four policies show that the destination tourism recovery is still a long way to go. As shown in , the number of tourists in the post-epidemic is far less than the pre COVID-19. illustrates the change in the intention of travel behaviour under four strategies, which is consistent with the number of tourist arrival. In , some key variables are selected and compared under strategies.
Figure 15. Prediction results of number of tourists under different scenario (in thousands).
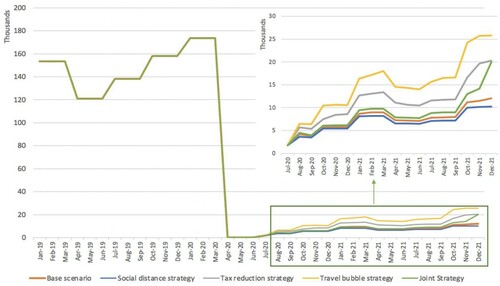
Figure 16. Prediction results of changes in tourists’ behaviour intention under four strategies. (The tourism behaviour intention is a value between 0 and 10, the higher the score, the greater the willingness to travel).
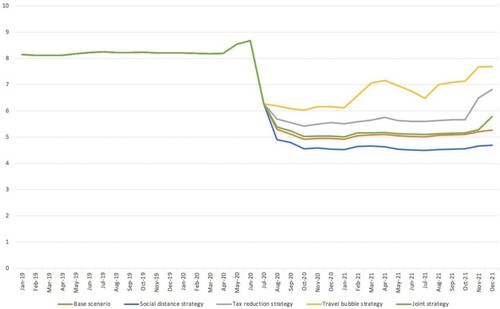
Table 5. Comparison of all recovery scenarios relative to the base case scenario.
However, the reduction in the number of tourists also brings opportunities for the destination to restore the environment. Starting from January 2020, the number of tourists has dropped sharply. According to our simulation results, within two years, the number of tourists will not reach the level before COVID-19, which provides a break to restore the environment. The waste generated by tourists will be greatly reduced because of the reduction in the number of tourists. According to the Maldives Visitor Survey (Ministry of Tourism, Citation2017), the main motivation for tourists to visit the Maldives is beautiful nature. The reduction in the number of tourists will have a positive impact on the environmental protection of the resort and restore its tourism industry in a more sustainable way (Kapmeier & Gonçalves, Citation2018).
4. Discussion
The new coronavirus has had an unprecedented global impact. Traditional prediction models based on past patterns and historical data may not be applicable to predict the impact of new coronaviruses. Hence, this paper proposes an SD approach to support tourism recovery. This simulation method can help tourism managers in three ways. Firstly, it provides managers with estimates to understand how tourism destinations will be affected by COVID-19, including social, economic and environmental aspects. The results of the simulations also give managers a general idea of future declines in tourism numbers, tourism economic losses and increases in unemployment. Secondly, the model can help managers understand how tourism intentions change and the reasons behind these changes. The consideration of risk perception in the TPB suggests that if the epidemic is not well controlled at a local destination, tourists’ risk perceptions of this destination will remain high, thus negatively affecting their travel intentions. Reducing tourists’ risk perception is key to the recovery of the tourism industry and is the goal and focus of tourism managers. Thirdly, the SD model enables managers to anticipate the recovery trajectory of different strategies. From our modelling results, it appears that the best strategy to support the recovery is to build a tourism bubble among countries, as quarantine time is a very important factor that inhibits tourists’ travel intention. At the same time, this strategy will release a signal of trust between countries, which may help reduce the tourists’ risk perception in the destination country. Furthermore, the model results suggest that the recovery of tourism is a long-term process. Rebuilding confidence in tourism destination may take years, which is why SIDS need more attention and funding, as their economies are very fragile and sensitive to global influences.
The paper provides a set of contributions to the literature. Firstly, it contributes to the rich stream of SD models supporting research on SIDS. In this case, our model includes the healthcare sector and explicit behavioural aspects of tourists using TPB considering the impact of a pandemic, which involved a sharp decline in tourist arrivals. Secondly, the use of SD offers a complementary approach to traditional tourism arrivals models, especially forecasting models that depend heavily on past data and long-term trends. By including the diverse behavioural factors that affect tourism arrivals explicitly, the model can show how long will take arrivals to recover, if arrivals will recover and the most important drivers affecting them. Finally, our paper contributes to the intersection of models and strategic planning. We show the impact of different policies on the different trajectories for recovery. Policies that are aligned with the recent ideas discussed by different governments.
5. Conclusion
Under the impact of COVID-19, the tourism industry is facing great challenges, especially for SIDS. To solve these problems, the first thing is to understand the tourist behaviour during this unsettled period. Thus, risk perception is introduced and extended to TBP to analyze the tourist behaviour intention. The next step is to evaluate the impact of COVID-19 on destination and to support local tourism recovery decision-making. An SD model is therefore proposed to provide integrate information from a holistic perspective and to support the policymakers.
The study selected the Maldives as one case of SIDS and established an SD model that contains the social, economic, and environmental conditions. Four possible strategies are tested for tourism recovery. The results show that the most effective way to change tourism behaviour intention is the travel bubble strategy. Also, it is worth noting that the reduction in tourism arrivals also brings good opportunities for destinations to repair the natural beauty and local ecosystem.
A major limitation of this study is insufficient data. Not all variables in the model can get empirical data. To simplify, the model uses assumptions, which may cause some subjective issues. In addition, due to insufficient data, some variables and parameters are not considered in the model, which makes the model unable to fully represent and simulate the destination. Future improvements will start by collecting more data and consider more factors for destination recovery. For example, the current model does not include the development of guest houses on inhabited islands. However, this type of accommodation may bring considerable income to the local community. Moreover, this study did not consider the impact of vaccine development on tourists’ behavioural intentions, which can be another scenario for future improvements.
RCIT_1924636_Appendix
Download MS Word (145 KB)Disclosure statement
No potential conflict of interest was reported by the author(s).
Additional information
Funding
References
- Ajzen, I. (1991). The theory of planned behavior. Organizational Behavior and Human Decision Processes, 50(2), 179–211. https://doi.org/https://doi.org/10.1016/0749-5978(91)90020-T
- Aljazeera. (2021). Australia reopens ‘travel bubble’ with New Zealand. https://www.aljazeera.com/news/2021/1/31/australia-reopens-travel-bubble-with-new-zealand
- Andarzian, B., Bannayan, M., Steduto, P., Mazraeh, H., Barati, M. E., Barati, M. A., & Rahnama, A. (2011). Validation and testing of the AquaCrop model under full and deficit irrigated wheat production in Iran. Agricultural Water Management, 100(1), 1–8. https://doi.org/https://doi.org/10.1016/j.agwat.2011.08.023
- Australian Associated Press. (2020). New Zealand and Cook Islands to launch quarantine-free travel bubble. https://www.theguardian.com/world/2020/dec/12/new-zealand-and-cook-islands-to-launch-quarantine-free-travel-bubble
- Bae, S. Y., & Chang, P. J. (2020). The effect of coronavirus disease-19 (COVID-19) risk perception on behavioural intention towards ‘untact’ tourism in South Korea during the first wave of the pandemic (March 2020). Current Issues in Tourism, 24(7), 1017–1035. https://doi.org/https://doi.org/10.1080/13683500.2020.1798895
- Baggio, R. (2008). Network analysis of a tourism destination. University of Queensland Australia.
- Banos-González, I., Martínez-Fernández, J., & Esteve, MÁ. (2016). Tools for sustainability assessment in island socio-ecological systems: An application to the canary islands. Island Studies Journal, 11(1), 9–34. https://islandstudies.ca/sites/default/files/ISJ-11-1-B-BanosGonzález-et-al.pdf
- Bauer, R. A. (1960). “Consumer behaviour as risk taking”. In Risk taking and information handling in consumer behavior. Reading, MA: Addison-Wesley.
- Berger, M. (2020). How have new social norms emerged as COVID-19 has spread?. Penn Today. Retrieved December 20, 2020, from https://penntoday.upenn.edu/news/Penn-philosopher-Cristina-Bicchieri-studies-social-norms-COVID
- Briguglio, L. (1995). Small island developing states and their economic vulnerabilities. World Development, 23(9), 1615–1632. https://doi.org/https://doi.org/10.1016/0305-750X(95)00065-K
- Carlini, C., & Tsaples, G. (2015). Interactive Learning Environments for Crisis Management through a System Dynamics approach. May, 1–37.
- Carlisle, S., Johansen, A., & Kunc, M. (2016). Strategic foresight for (coastal) urban tourism market complexity: The case of bournemouth. Tourism Management, 54, 81–95. https://doi.org/https://doi.org/10.1016/j.tourman.2015.10.005
- Checkland, P. (1985). From optimizing to learning: A development of systems thinking for the 1990s. Journal of the Operational Research Society, 36(9), 757–767. https://doi.org/https://doi.org/10.1057/jors.1985.141
- China Daily (2020). Thai association proposes China travel-bubble plan. https://www.chinadaily.com.cn/a/202011/17/WS5fb3112aa31024ad0ba947a2.html
- Ciriković, E. (2014). Marketing mix in tourism. Academic Journal of Interdisciplinary Studies, 3(2), 111. http://www.richtmann.org/journal/index.php/ajis/article/view/2955
- Development Asia. (2020). Strategies to Restart the Tourism Sector during the COVID-19 Pandemic. https://development.asia/policy-brief/strategies-restart-tourism-sector-during-covid-19-pandemic.
- Dhirasasna, N., Becken, S., & Sahin, O. (2020). A systems approach to examining the drivers and barriers of renewable energy technology adoption in the hotel sector in Queensland, Australia. Journal of Hospitality and Tourism Management, 42, 153–172. https://doi.org/https://doi.org/10.1016/j.jhtm.2020.01.001
- D'Orazio, M., Bernardini, G., Quagliarini, E. (2020). How to restart? An agent-based simulation model towards the definition of strategies for COVID-19" second phase" in public buildings. arXiv preprint arXiv:2004.12927.
- Dvarskas, A. (2017). Dynamically linking economic models to ecological condition for coastal zone management: Application to sustainable tourism planning. Journal of Environmental Management, 188, 163–172. https://doi.org/https://doi.org/10.1016/j.jenvman.2016.12.014
- Fan, C., Gong, L., & Li, H. (2019). An agent-based model approach for assessing tourist recovery strategies after an earthquake: A case study of Jiuzhai valley. Tourism Management, 75(November 2018), 307–317. https://doi.org/https://doi.org/10.1016/j.tourman.2019.05.013
- Ferreira, S. L. A., & Harmse, A. C. (2000). Crime and tourism in South Africa: International tourists perception and risk. South African Geographical Journal, 82(2), 80–85. https://doi.org/https://doi.org/10.1080/03736245.2000.9713696
- Fishbein, M., & Ajzen, I. (1975). Belief, attitude, intention, and behavior: An introduction to theory and research. Reading, MA: Addison-Wesley.
- Forrester, J. W. (1994). System dynamics, systems thinking, and soft OR. System Dynamics Review, 10(2–3), 245–256. https://doi.org/https://doi.org/10.1002/sdr.4260100211
- Ghaderi, Z., Hatamifar, P., & Henderson, J. C. (2018). Destination selection by smart tourists: The case of isfahan, Iran. Asia Pacific Journal of Tourism Research, 23(4), 385–394. https://doi.org/https://doi.org/10.1080/10941665.2018.1444650
- Goh, C., & Law, R. (2002). Modeling and forecasting tourism demand for arrivals with stochastic nonstationary seasonality and intervention. Tourism Management, 23(5), 499–510. https://doi.org/https://doi.org/10.1016/S0261-5177(02)00009-2
- Golob, A., & Jere, J. (2014). Standardization and classification of events in tourism based on a systems approach. Singidunum Journal of Applied Sciences, 11(1), 67–73. https://doi.org/https://doi.org/10.5937/sjas11-5741
- Gössling, S., Scott, D., & Hall, C. M. (2020). Pandemics, tourism and global change: A rapid assessment of COVID-19. Journal of Sustainable Tourism, 29(1), 1–20. https://doi.org/https://doi.org/10.1080/09669582.2020.1758708
- Guo, G., Zhang, Z., Chen, K., & Wang, X. (2010). The influence of WOM on consumers’ intention of brand switching: The mediate role of subjective norms. Management Review, 22(12), 62–69. http://www.seidatacollection.com/upload/product/200911/2009scyxhy01a8.pdf
- Homer, J., & Oliva, R. (2001). Maps and models in system dynamics: A response to coyle. System Dynamics Review, 17(4), 347–355. https://doi.org/https://doi.org/10.1002/sdr.224
- Hsu, C. H. C., & Huang, S. (2012). An extension of the theory of planned behavior model for tourists. Journal of Hospitality & Tourism Research, 36(3), 390–417. https://doi.org/https://doi.org/10.1177/1096348010390817
- Jakulin, T. J., & Clarke, A. (2017). Systems (holistic) approach to religious tourism. International Journal of Religious Tourism and Pilgrimage, 5(3), 19–25. https://doi.org/https://doi.org/10.21427/D7SM5F
- Kapmeier, F., & Gonçalves, P. (2018). Wasted paradise? Policies for Small island States to manage tourism-driven growth while controlling waste generation: The case of the Maldives. System Dynamics Review, 34(1–2), 172–221. https://doi.org/https://doi.org/10.1002/sdr.1607
- Kozak, M., Crotts, J. C., & Law, R. (2007). The impact of the perception of risk on international travellers. International Journal of Tourism Research, 9(4), 233–242. https://doi.org/https://doi.org/10.1002/jtr.607
- KPMG. (2020). China: Tax developments in response to COVID-19. https://home.kpmg/xx/en/home/insights/2020/04/china-tax-developments-in-response-to-covid-19.htm
- Kunc, M. (2016). System dynamics: A behavioral modeling method. 2016 Winter Simulation Conference (WSC) (pp. 53–64). https://doi.org/https://doi.org/10.1109/WSC.2016.7822079
- Kunc, M. (2017). System dynamics: A soft and hard approach to modelling. 2017 Winter Simulation Conference (WSC) (pp. 597–606). https://doi.org/https://doi.org/10.1109/WSC.2017.8247818
- Kunc, M., Malpass, J., & White, L. (2016). Behavioral operational research: Theory, methodology and practice. Springer.
- Kunc, M. H., & Morecroft, J. D. W. (2007). Competitive dynamics and gaming simulation: Lessons from a fishing industry simulator. Journal of the Operational Research Society, 58(9), 1146–1155. https://doi.org/https://doi.org/10.1057/palgrave.jors.2602246
- Lam, T., & Hsu, C. H. C. (2006). Predicting behavioral intention of choosing a travel destination. Tourism Management, 27(4), 589–599. https://doi.org/https://doi.org/10.1016/j.tourman.2005.02.003
- Leisen, B. (2001). Image segmentation: The case of a tourism destination. Journal of Services Marketing, 15(1), 49–66. https://www.emerald.com/insight/content/doi/https://doi.org/10.1108/08876040110381517/full/html
- Lu, X., Yao, S., Fu, G., Lv, X., & Mao, Y. (2019). Dynamic simulation test of a model of ecological system security for a coastal tourist city. Journal of Destination Marketing and Management, 13, 73–82. https://doi.org/https://doi.org/10.1016/j.jdmm.2019.05.004
- Luo, Y., Mou, Y., Wang, Z., Su, Z., & Qin, Y. (2020). Scenario-based planning for a dynamic tourism system with carbon footprint analysis: A case study of Xingwen global Geopark, China. Journal of Cleaner Production, 254, https://doi.org/https://doi.org/10.1016/j.jclepro.2020.119999
- Maani, K., & Cavana, R. Y. (2007). Systems thinking, system dynamics: Managing change and complexity. Prentice Hall.
- Mai, T., & Smith, C. (2018). Scenario-based planning for tourism development using system dynamic modelling: A case study of Cat Ba island, Vietnam. Tourism Management, 68, 336–354. https://doi.org/https://doi.org/10.1016/j.tourman.2018.04.005
- Maldives National Bureau of Statistics. (2016). Maldives - Population and Housing Census 2014. Ministry of Finance and Treasury. http://statisticsmaldives.gov.mv/nbs/wpcontent/uploads/2016/07/Statistical-Release-IV-Housing-FINAL-1.pdf
- Maldives National Bureau of Statistics. (2016). Maldives population & housing census 2014. http://statisticsmaldives.gov.mv/nbs/wp-content/uploads/2016/07/Statistical-Release-IV-Housing-FINAL.pdf
- Marko, P. (2014). Systems thinking and alternative business model for responsible tourist destination. Kybernetes, 43(3/4), 480–496. https://doi.org/https://doi.org/10.1108/K-07-2013-0132
- Ministry of Tourism. (2017). Maldives visitor survey February 2017. Ministry of Tourism. https://www.tourism.gov.mv/en/downloads/visitor_survey
- Ministry of Tourism. (2020). Monthly statisstics November 2020. Ministry of Tourism. https://www.tourism.gov.mv/en/statistics/publications
- Ministry of Tourism Maldives. (2019). Tourism yearbook 2019. https://www.tourism.gov.mv/statistics/publications/year-2019
- Mishagina, N., Laszlo, S., & Strumpf, E. (2020). Can preventive measures become social norms? A study of the 2009 H1N1 flu outbreak offers lessons for public health messaging. Policy Options. Retrieved December 20, 2020, from https://policyoptions.irpp.org/magazines/march-2020/the-importance-of-new-social-norms-in-a-covid-19-outbreak/
- Mohammad, R. J., & Neda, S. (2012). The impact of electronic word of mouth on a tourism destination choice : Testing the theory of planned behavior (TPB). Internet Research, 22(5), 591–612. https://doi.org/https://doi.org/10.1108/10662241211271563
- Moon, Y. B. (2017). Simulation modelling for sustainability: A review of the literature. International Journal of Sustainable Engineering, 10(1), 2–19. https://doi.org/https://doi.org/10.1080/19397038.2016.1220990
- Morrison, A. M., & Mill, R. C. (1985). The tourism system: An introductory text. Prentice-Hall.
- National Bureau of Statistics. (2020). Monthly Statistics. https://statisticsmaldives.gov.mv/monthly-statistics/
- Nugroho, S., Uehara, T., & Herwangi, Y. (2019). Interpreting daly’s sustainability criteria for assessing the sustainability of marine protected areas: A system dynamics approach. Sustainability, 11(17). https://doi.org/https://doi.org/10.3390/su11174609
- Pruyt, E. (2010). Using small models for big issues: Exploratory system dynamics modelling and analysis for insightful crisis management.Proceedings of the 28th International Conference of the System Dynamics Society, Seoul, Korea, System Dynamics Society July 2010, 25–29. http://www.systemdynamics.org/conferences/2010/proceed/papers/P1266.pdf
- Quintal, V. A., Lee, J. A., & Soutar, G. N. (2010). Risk, uncertainty and the theory of planned behavior: A tourism example. Tourism Management, 31(6), 797–805. https://doi.org/https://doi.org/10.1016/j.tourman.2009.08.006
- Raphael, S, & Winter-Ebmer, R. (2001). Identifying the effect of unemployment on crime. The Journal of Law and Economics, 44(1), 259–283.
- Reza Jalilvand, M., Samiei, N., Dini, B., & Yaghoubi Manzari, P. (2012). Examining the structural relationships of electronic word of mouth, destination image, tourist attitude toward destination and travel intention: An integrated approach. Journal of Destination Marketing and Management, 1(1–2), 134–143. https://doi.org/https://doi.org/10.1016/j.jdmm.2012.10.001
- Rudan, E. (2014). The new strategic orientation in innovating hospitality logistics system. Tourism and Hospitality Management, 20(2), 195–206. https://doi.org/https://doi.org/10.20867/thm.20.2.4
- Sergey, Y., & David, F. (2016). The efficacy of the theory of planned behavior for predicting intentions to choose a travel destination: A review. Tourism Review, 71(2), 135–147. https://doi.org/https://doi.org/10.1108/TR-11-2015-0055
- Sharareh, N., Sabounchi, N. S., Sayama, H., & MacDonald, R. (2016). The ebola crisis and the corresponding public behavior: A system dynamics approach. PLoS Currents, 8(November), https://doi.org/https://doi.org/10.1371/currents.outbreaks.23badd9821870a002fa86bef6893c01d
- Soliman, M. (2019). Extending the theory of planned behavior to predict tourism destination revisit intention. International Journal of Hospitality & Tourism Administration, 1–26. https://doi.org/https://doi.org/10.1080/15256480.2019.1692755
- Sterman, J. D. (2000). Business Dynamics: Systems Thinking and Modeling for Complex World. Boston: McGraw-Hill.
- Tan, W.-J., Yang, C.-F., Château, P.-A., Lee, M.-T., & Chang, Y.-C. (2018). Integrated coastal-zone management for sustainable tourism using a decision support system based on system dynamics: A case study of cijin, kaohsiung, Taiwan. Ocean and Coastal Management, 153, 131–139. https://doi.org/https://doi.org/10.1016/j.ocecoaman.2017.12.012
- Travel Trade Maldives. (2020). TTM Report: Maldives Tourism Industry Forecast 2023. https://www.traveltrademaldives.com/ttm-report-maldives-tourism-industry-forecast-2023/
- UK Government. (2020). Get a discount with the eat out to help out scheme. HM Revenue & Customs.
- United Nations. (2020). COVID-19 funding for small island developing states. https://www.un.org/ohrlls/content/covid-19-sids
- Unwto.org. (2020a). Impact assessment of the COVID-19 outbreak on international tourism, UNWTO. https://www.unwto.org/impact-assessment-of-the-covid-19-outbreak-on-international-tourism
- Unwto.org. (2020b). Travel restrictions, UNWTO. https://www.unwto.org/covid-19-travel-restrictions
- Walker, P. A., Greiner, R., McDonald, D., & Lyne, V. (1998). The tourism futures simulator: A systems thinking approach. Environmental Modelling & Software, 14(1), 59–67. https://doi.org/https://doi.org/10.1016/S1364-8152(98)00033-4
- Xu, X., & Reed, M. (2017). Perceived pollution and inbound tourism in China. Tourism Management Perspectives, 21, 109–112. https://doi.org/https://doi.org/10.1016/j.tmp.2016.12.006
- Zhang, J., Ji, M., & Zhang, Y. (2015). Tourism sustainability in Tibet - forward planning using a systems approach. Ecological Indicators, 56, 218–228. https://doi.org/https://doi.org/10.1016/j.ecolind.2015.04.006