
 ?Mathematical formulae have been encoded as MathML and are displayed in this HTML version using MathJax in order to improve their display. Uncheck the box to turn MathJax off. This feature requires Javascript. Click on a formula to zoom.
ABSTRACT
This study investigates empirically how the regional economic activity, measured as the agglomeration of establishments, affects domestic travel and tourism flows during the COVID-19 summer of 2020. Domestic tourism flows are approximated by the number of overnight stays in all 96 French regions. Results from spatial estimations reveal that lower economic activity attracts more domestic tourists. This relationship becomes inflated if the neighbouring areas are characterized by equally sparse economic activity. In July and August 2020, regions with a 10% lower density of establishments (combined effect of within the same region and surrounding regions) have a between one and two percentage points higher growth rate in domestic overnight stays than others. The share of second homes is also significantly and positively related to domestic tourism. Coastal regions and regions surrounded by national parks have a larger growth in domestic overnight stays in August 2020 (by 15 and 24 percentage points, respectively). The counterfactual estimations based on data for the years prior to the pandemic (2017–2019) reveal that regions with a high establishment density are growing in domestic tourism. The other local characteristics investigated are either insignificant (direct effects) or have the opposite sign (spillover effects).
1. Introduction
The COVID-19 pandemic has a major negative impact on mobility and thus also on the tourism sector. External factors such as country lockdowns, forced closures of tourist facilities, strict orders not to travel and the decline of transportation services restrict national and international mobility (Miao et al., Citation2021). Personal fears and uncertainties related to the pandemic is an additional aspect that may reduce the willingness to travel (Neuburger & Egger, Citation2021). Zheng et al. (Citation2021) show that the threat of the pandemic, its severity and vulnerability can lead to ‘travel anxiety’, which manifests itself in protective travel behaviour.
In the growing literature on the COVID-19 pandemic, there are several arguments that domestic tourism is likely to be the first to recover (Arbulú et al., Citation2021; Neuburger & Egger, Citation2021). After the initial wave of the pandemic, mobility and travel was largely unrestricted in several countries in the summer of 2020. Despite this, observed travel patterns do not coincide with those of the past and there is a clear difference between densely and sparsely populated areas (OECD, Citation2020). Cities that normally attract many international, business and event visitors are particularly negatively affected (Anguera-Torrell et al., Citation2021; Li et al., Citation2021). The need for social distancing, contact minimization and the lack of major events in urban areas may steer tourism flows in the direction of more deserted regions. Indeed, several studies document gains from domestic tourists during the summer of 2020 for rural areas (Marques et al., Citation2021; Vaishar & Šťastná, Citation2020), mountain regions (Osti & Nava, Citation2020; Seraphin & Dosquet, Citation2020) and coastal areas with previously low tourism density (Jeon & Yang, Citation2021).
The aim of this study is to empirically investigate how the level of regional economic activity affects domestic travel and tourism flows during the COVID-19 summer of 2020. Economic activity is measured as the agglomeration of establishments. Domestic tourism flows are approximated by the number of overnight stays in all 96 French regions, based on official data from the Statistical Office (INSEE). Control variables include the proportion of second homes, coastal area and natural parks. Spatial econometric models are used to estimate the role of the economic activity and its possible indirect effect. As a counterfactual, the development three years before 2020 is used.
France has the largest internal tourism market in Europe with more than 100 million overnight stays in July and August 2019, and thus is a particularly suitable country for an analysis of domestic travel flows (Source: Eurostat, Nights spent at tourist accommodation establishments – monthly data [TOUR_OCC_NIM]). The period chosen for the analysis is the summer of 2020 when French residents temporarily were released from mobility restrictions. Huybers (Citation2003) emphasises that changes in geopolitical stability and the spread of dangerous diseases such as the SARS virus outbreak may well lead to a substitution effect between international and domestic tourism flows. Cafiso et al. (Citation2018) find evidence that tourists tend to choose closer destinations in times of crisis. This suggests that there could be a change in demand for domestic destinations during the pandemic, although it is not clear which regions potentially benefit the most.
Several studies investigate the changes in travel and tourism behaviour during the COVID-19 pandemic. One strand of the literature uses surveys of residents about their travel intentions and behaviour (Jin et al., Citation2021; Neuburger & Egger, Citation2021; Osti & Nava, Citation2020; Vaishar & Šťastná, Citation2020; Zheng et al., Citation2021). Other analyses rely on data from official travel and tourism surveys (Boto-García & Leoni, Citation2021). These latter surveys also encompass representatives of tourist establishments (Ntounis et al., Citation2021; Silva, Citation2021). Silva (Citation2021), for instance, demonstrates that a minority of establishments in Portugal reports positive impacts on their business due to increased domestic demand. Besides questionnaires to individuals or establishments, some explorations use content analysis of newspapers or other media (Li et al., Citation2021). Research based on official travel data for domestic overnight stays at the detailed destination level is rare. One exception is Altuntas and Gok (Citation2021), who examine the patterns of interregional travel flows across regions in Turkey.
This study contributes a first quantitative analysis on how the effects of the COVID-19 pandemic vary across regions in terms of domestic overnight stays and ongoing economic activities. By use of establishment data, confusion over ownership and location is avoided, making these data particularly suitable for regional analyses. The second contribution to the empirical literature lies in the explicit treatment of spillover effects by the use of spatial modelling. This work also adds to the determinants of regional attractiveness by building on Romão et al. (Citation2013), who emphasise the importance of natural resources and cultural heritages, based on NUTS 2 data for Italy, France, Spain and Portugal.
The structure of the study is as follows: Section 2 outlines the conceptual background. Section 3 introduces the empirical approach while Section 4 describes the data used for the estimations. Empirical results are presented in Section 5 and Section 6 concludes.
2. Conceptual background
Prior to the COVID-19 outbreak, areas with dense settlements or a large number of businesses experience a huge increase in visitors, domestic as well as foreign (Koens et al., Citation2018). There are many reasons behind this development. One is the supply of cultural attractions and urban amenities (shopping, entertainment), another is the presence of academic institutions (Romão et al., Citation2018). Good physical infrastructure is also important, including airports to which an increasing number of low-cost airlines fly. During the COVID-19 pandemic, areas with high agglomerations of businesses or people are possibly less attractive to visitors and tourists. Another reason for a decline in tourism flows is the present lack of large events, meetings, conferences, and business travellers in urban areas (Sharifi & Khavarian-Garmsir, Citation2020).
There is evidence that the rate of contact with a virus is proportional to the population density (Rocklöv & Sjödin, Citation2020). This means that avoiding situations and areas with large amounts of people is a necessary condition to limit the spread of a virus like the COVID-19. Lai et al. (Citation2020) mention that cities with high population density are synonymous with low per capita living space, heavily used mass transportation and general overcrowding. Sharifi and Khavarian-Garmsir (Citation2020) conclude that the high concentration of people and activities in cities make the former vulnerable to various stressors such as natural and man-made disasters. Consequently, densely populated and well-connected areas could become hotspots for a rapid spread of viruses because of the high level of personal interactions that makes social distancing difficult (Sharifi & Khavarian-Garmsir, Citation2020). Several studies confirm that population density or population in urban agglomerations is positively correlated with the number of COVID-19 cases or its growth rate based on regional data (see Cartenì et al., Citation2020; Coccia, Citation2020 for Italian regions). Business travel, face-to-face meetings and conferences are scarce after the outbreak of the pandemic and are also to some extent replaced by virtual meetings. Caligiuri et al. (Citation2020) mention that lives of many international business travellers and globally mobile employees in multinational companies change dramatically during the pandemic. Their frequent travels, hotel nights and business lunches are all replaced by home offices and virtual meetings. This leads to a decline in demand for hotel beds and other amenities in major conference cities. In the dataset examined, the capital Paris is included, one of the top ten conference cities in Europe (ICCA, Citation2019).
As an antipole, holidays in sparsely populated areas with low economic activities can be seen as a strategy to stay safe and healthy. These areas, often characterized by the presence of lakes, forests and mountains, allow for individual outdoor activities with low risk of transmissions such as hiking, (mountain) biking and swimming.
Studies investigating the determinants of travel flows or intentions show that residents avoid crowded destinations during the COVID-19 pandemic (Wen et al., Citation2021). In addition, Li et al. (Citation2021) document that the loss of city tourism is more severe in the early phase of the COVID-19 pandemic. Based on a survey of camping tourists in early summer 2020, Craig (Citation2021) shows that visitors plan to travel to less popular destinations to avoid overcrowding.
In this study, the central variable determining the changes in domestic travel and tourism behaviour during the COVID-19 pandemic is regional economic activity, measured as establishment density. Population density and close contact among individuals are thought to play a central role in the spread of the COVID-19 virus (Rader et al., Citation2020; Sharifi & Khavarian-Garmsir, Citation2020). Kock et al. (Citation2020) discover that psychological responses associated with COVID-19, such as perception of crowding, are caused by a long-term disease avoidance. Crowding can be measured in various ways, for instance by agglomeration of firms or agglomeration of people (population density).
The number of business premises per square kilometre is a measure of the degree of concentration and urbanization (Doran et al., Citation2016; Loveridge & Nizalov, Citation2007) and is referred to as urbanization economy and agglomeration (Woodward et al., Citation2006). Alternatively, business agglomeration may be identified as employment density (Ciccone, Citation2002). Establishment or employment density measures economic activity in a broad sense and includes linkages both forward and backwards (clients and suppliers). Thus, establishment density might be a better measure than population density in capturing human and economic activity and their interactions. This is supported by Zoğal et al. (Citation2020), who report that in the early stages of the pandemic, the second home-owners moved out from the crowded cities.
This leads to the formulation of the main hypotheses:
Hypothesis 1: There is a significant relationship between economic activity and the change in domestic overnight stays.
Hypothesis 2: The established relationship changes sign in 2020.
Second homes play an important role in domestic tourism in many countries (Back, Citation2020; Hall & Müller, Citation2004). In France, the share of second homes is 11.7% on average but varies between zero and 45% across regions (Insee, Citation2021; Appendix, Figure A1). These second homes are commonly located near lakes, coasts and mountains (Jaakson, Citation1986), close to nature with many outdoor recreational opportunities and amenities or in remote areas (Hiltunen, Citation2007; Marjavaara & Müller, Citation2007; Nepal & Jamal, Citation2011). Some of the second homes are also to a certain extent available to tourists (Zaninetti, Citation2013). Areas with second homes could benefit from the change in domestic tourism flows in the COVID-19 period (Seraphin & Dosquet, Citation2020), as they are often located in places where people feel physically and psychologically safe (Adie, Citation2020; Jaakson, Citation1986). Zoğal et al. (Citation2020) argue that a potential change in tourism preferences in the COVID-19 period puts second homes at the centre of tourism activities. Because of this, the presence of second homes is expected to be an important control variable, as are areas with typical rural or recreational features (Rosalina et al., Citation2021). Two other control variables related to local characteristics are included. One is whether the region is a coastal region. These regions offer many water sports activities and space and are therefore ideal for escaping possible infection risks. The other variable indicates if the region lies within a national park or is surrounded by areas with national parks. Buckley and Westaway (Citation2020) mention that during the COVID-19 pandemic, low-key, localized outdoor tourism may become more attractive because it can improve mental health. Romão et al. (Citation2013) argue that nature values (measured as the percentage of regional territory protected in the European Natura 2000 network) are important factors in the attractiveness of a region for tourism.
3. Empirical approach
Several studies examine the determinants of domestic tourism flows at the regional level (Massidda & Etzo, Citation2012 and Cafiso et al., Citation2018 for Italy; Yang et al., Citation2014 for China; Alvarez-Diaz et al., Citation2020 for Spain). Accounting for spatial effects is common in analysis of regional travel flows (Alvarez-Diaz et al., Citation2020; Majewska, Citation2015; Romão & Nijkamp, Citation2019; Yang & Fik, Citation2014). The spatial Durbin model (SDM) is regularly used for analyses of regional tourism flows (Karimi et al., Citation2021; Yang & Fik, Citation2014), even if LeSage (Citation2014) recommends the spatial Durbin error model (SDEM) in cases where the possible regional spillover effects are of particular interest. In other words, the LeSage procedure selects the SDEM over the SDM. The reason behind not specifying ex ante the exact version of the more general Manski specification (which nests both SDEM and SDM models) is the risk of over-parameterization in the estimation. LeSage (Citation2014) also notes that the error term in the SDEM models captures the global effects that would be modelled by the spatially lagged dependent variable in the SDM. As a result, SDEM and SDM might yield similar results for the spatial coefficient of the lagged dependent variable and the global diffusion of shocks. Another advantage of the SDEM is that it can capture all possible global effects (beyond that of the spatially lagged dependent variable) (LeSage & Ha, Citation2012). This kind of research questions might also be important for the choice of model. SDEM is preferred when regional characteristics may lead to spillover effects. In the following, the determinants of the change in the logarithm of domestic overnights stays with spatial effects are specified as a function of regional characteristics in the framework of the SDEM (subscript i for region and t for time are suppressed):
(1)
(1) where
is the first difference operator. Dependent variable lnDNS represents the natural logarithm of the vector of domestic overnight stays in hotels and related accommodations in either July or August (excluding camping sites),
denotes the natural logarithm of establishment density per square kilometre of the area (‘department’) and SECONDHOME indicates the proportion of second homes in the region. COASTAL and NATIONALPARK represent dummy variables if (a) the region has a seaside or (b) stretches over one of the eight National parks in France.
illustrates the spatial continuity weight matrix normalized with the largest eigenvalue as 1 and
is the inverse distance matrix. By adopting two weight matrices the spillover effects in parameters and error terms can be separated. A presumptive misspecification of the spatial disturbances
would not lead to biased estimation of the coefficients,
to
(Pace & Zhu, Citation2012).
Parameters to
measure the direct effects of the regional characteristics and
to
the spillover effects. Regional spillover effects are defined as non-feedback endogenous interactions (LeSage, Citation2014). The indirect effects are the net of the spillover and global effects, which include feedbacks, captured by the spatial error terms in the coefficient
. A common way to obtain information on indirect effects is to calculate the average effects (LeSage & Pace, Citation2009). Consequently, the delta method is used for this operation and the total effect is the sum of the direct and indirect effects.
The SDEM nests two specifications, the spatial lag of X (SLX) that only includes a spatial lag of the explanatory variables and the spatial error model (SEM) where there is merely a spatial component in the error term. All spatial econometric models are estimated using Maximum Likelihood with robust standard errors.
For the selection of the model with the best fit, four spatial models, SDEM, SXL, SEM and OLS are estimated. The first selection step is based on the Wald and Moran I tests. Model(s) with significant Wald statistic(s) will be kept for further consideration. If there is no significant Wald or Moran I statistics, the OLS will be chosen. In this case, no spatial effect could be identified. If only the Wald statistics, but not the Moran I test is significant, the spatial models will still be selected. When there are more than one model with significant Wald statistics, the likelihood-ratio (LR) tests can be employed to chisel out the model with the best fit (LeSage, Citation2014). The counterfactual to the impact of the COVID-19 pandemic, ΔlnDNS = ln(DNSt)-ln(DNSt-1) is the development during the years 2017–2019, ceteris paribus. Tourist behaviour is characterized by a high degree of persistence (Habibi, Citation2017), which means that they like to return to places they have visited before. Despite this, lagged adjustment or dynamic relationships are not taken into account because of the short time window for the analysis.
4. Data and descriptive statistics
The number of domestic overnight stays in hotels and related accommodation establishments excluding overnight stays at camping sites at the regional level is based on French official data (https://www.insee.fr/en/statistiques?debut=0&theme=67). Information on the summer months July and August during the years 2017–2020 are employed for the analysis. Data on surface in square kilometres (Superficie en 2017 en km²), the proportion of second homes (Part des résidences secondaires y compris les logements occasionnels en 2017 en %), number of establishments (Nombre d'établissements actifs fin 2017) and number of employees (Emploi total - salarié et non salarié- au lieu de travail en 2017) all originate from the same official source (statistics: Comparateur de territoire, https://www.insee.fr/fr/statistiques/1405599?geo=DEP-971+DEP-75+DEP-76). Information on coastal areas is derived from google maps and national parks are identified by the use of Wikipedia (https://en.wikipedia.org/wiki/List_of_national_parks_of_France). There are 26 regions with coastal areas and 15 with national parks.
Two spatial weight matrices are used for the analysis. One is the spatial continuity weight matrix normalized with the largest eigenvalue 1 and the other is the inverse distance matrix utilizing the geographical distance in kilometre between the capitals (prefecture) of the regions. All 96 regions (departments) are included in the calculations.
On average, domestic overnight stays decrease by 0.7% in August and by 15.5% in July 2020, compared with the same months in the three preceding years (). The share of second homes amounts to 11.4% on average in 2017. The establishment density in its logarithm is 1.23 on average in 2017 (which is equal to 3.4 establishments per square kilometre) (Appendix, Figure A2). Growth of domestic overnight stays in the summer of 2020 is unevenly distributed across regions, with strong increases in mountain and coastal areas in August 2020 as compared to the same month in the preceding years (Appendix, Figure A1).
Table 1. Descriptive statistics.
These regions experience an increase in domestic overnight stays of 20% or more compared with the same month in 2019 (for instance Alpes maritimes, Alpes de hautes provence, Haute Alpes, Haute Savoie, Savoie and Dordogne). Paris, the capital, on the other hand, records a decrease of 36%.
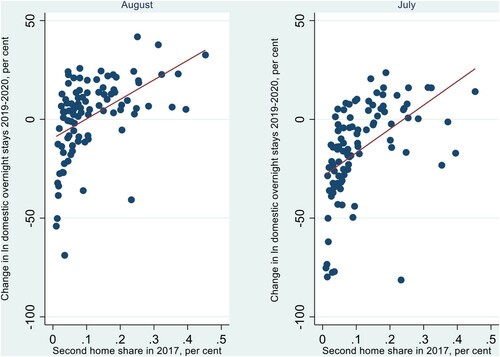
Bivariate Pearson correlation coefficients show that both the change in domestic overnight stays in August 2020 compared with the same month in 2019 and the share of second homes are significantly correlated with the logarithm of the establishment density (coefficients of 0.48 and 0.63, and ). Correlations for domestic overnight stays in July are quite similar but not reported here.
Figure 1. Correlation between change in overnight stays and establishment density. Source: Insee, own calculations.
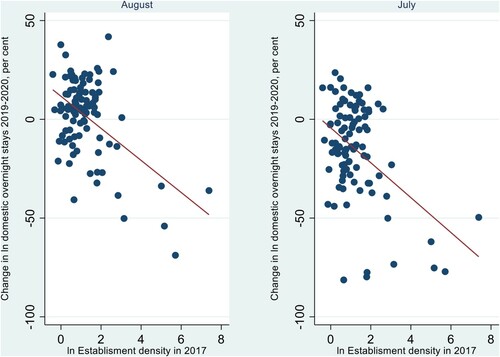
Figure 2. Correlation between change in domestic overnight stays and proportion of second homes. Source: Insee, own calculations.
5. Empirical results
Results based on the SDEM/SLX estimations ( and ) reveal that there is a significant relationship between the change in domestic overnight stays and the level of regional economic activity in both July and August 2020. Lower economic activity attracts more domestic tourism. The spatially weighted establishment density indicates that this relationship becomes inflated if the area in question is surrounded by neighbours with equally low economic activity. This is consistent with the first research hypothesis stating that travel and tourism behaviour is influenced by the level of economic activity. Control variables second homes, coastal areas and national parks are also clearly significant and positive, as opposed to what can be found in the counterfactual estimations for the years running up to 2020. Spillover effects related to the control variables (second homes, coastal areas and national parks) are partly significant in August and July 2020 implying that domestic travel flows are higher in regions surrounded by areas with many second homes and partly (August) by national parks.
Table 2. Determinants of domestic overnight stays, spatial estimations.
Table 3. Determinants of domestic overnight stays, average marginal effects, spatial estimations.
Areas surrounded by neighbours with a high establishment density have significantly lower growth rates of domestic overnight stays than those with fewer businesses. Indirect effects achieved for these regions are −0.13 for July and −0.08 for August (). Even the direct effects appear significantly negative for both July and August, but with smaller coefficients in absolute terms (−0.06 and −0.03) and at the five instead of the 1% level. These results clearly show that neglecting spatial effects risks omitted variable bias.
Since the explanatory variables are scaled differently, a change in one standard deviation can be used to illustrate the magnitude of the relationships. A one standard deviation increase in the logarithm of establishment density (from a mean of 1.23–2.47) is associated with a decrease in domestic overnight stays of 23 percentage points in July and 13 percentage points in August (1.24*(−0.188) and 1.24*(−0.105) respectively). Calculated as an increase of a 10% higher establishment density in the same and surrounding regions, this corresponds to a two and one percentage points higher growth rate of domestic overnight stays. Thus, the magnitude of the relationships cannot be neglected.
The indirect effect of the proportion of second homes is significant in both July and August, while the direct effect is only valid for July. The total marginal effects of the second home share in July and August are 1.37 and 0.86, respectively (). This means that a one standard deviation increase in the second home share from the mean of 11.4% to 21.1% is associated with a surge in domestic overnight stays by 13 percentage points in July and 8 percentage points in August. The spatially weighted dummy variable for national parks is significant at the 1% level in August. Thus, regions surrounded by areas with national parks benefit from higher growth rates of domestic overnight stays. The marginal effect is 0.24, indicating that the growth rate of domestic overnight stays is 24 percentage points in August as compared to those who are not surrounded by areas with national parks. Overall, the models can explain between 40% and 50% of the variation in the change in domestic overnight stays.
Based on pre-COVID data, the establishment density variable is significant for both July and August at the 5% level but shows the opposite sign in comparison with the results for 2020, verifying the second hypothesis. None of the control variables appear significant, implying that local characteristics such as coasts, national parks and share of second home do not determine the change in domestic overnight stays before the outbreak of the pandemic. Nevertheless, there is a negative spillover effect from second homes for the average July in 2017–2019. Consequently, these results support the hypothesis that the summer of 2020 exhibits a different pattern of domestic tourism demand than in previous years, including a stronger preference for less dense areas.
Several studies focus on the impact on domestic tourism of the pandemic (Neuburger & Egger, Citation2021), although few of them use data on actual behaviour from official statistics (for exceptions see Altuntas & Gok, Citation2021; Boto-García & Leoni, Citation2021). Because of this, comparisons with other studies are difficult to undertake.
A first robustness regression is run with an alternative measure of regional economic activity: employment density. Besides this, the model selection procedure is identical. The results coincide with those of the baseline model (Appendix, Tables A1 and A2). In the estimations for 2020, the spatial coefficients measuring the regional spillover effects of the employment density are all significant for both July and August. The signs of the total effects confirm the conclusion that decreases in employment density leads to a higher growth rate of domestic overnight stays in 2020. In addition, other land use characteristics are considered such as the share of agricultural establishments, although this variable is not significant at the 1% level and thus not included in the final specification.
Overall, the results suggest that the COVID-19 pandemic reverses the prevailing trend of travel and tourism towards areas characterized by a low level of economic activity. Prior to the outbreak of the pandemic, cities had become magnets for tourists and travellers, leading to a strong growth in the number of visitors. Since the 1980s, several urban areas, including older industrial cities, are the beneficiaries of this wave, leading to concerns about over-visitation in general (Koens et al., Citation2018). This possible over-visitation is temporarily halted. The basis for future domestic tourism is not only about suddenly again allowing events and large gatherings, but planners and providers need to put in place stronger public health measures and tools to make the place safe for visitors. This includes regular inspections, raising awareness, tourist awareness of health risks and sanitation measures (Kim et al., Citation2021). The role of automation technologies in biosecurity measures is also important (Ivanov et al., Citation2020).
6. Conclusions
This study investigates empirically how the degree of regional economic activity affects domestic travel and tourism flows during the COVID-19 summer of 2020 in France. Economic activity is measured as the agglomeration of establishments and demand for domestic tourism is approximated by the number of overnight stays in all 96 French regions. The specification also takes into account regional characteristics (coastal location, presence of national parks and second homes).
Evidence based on spatial econometric models show that regions with high economic activity are in less demand for domestic tourism in the summer of 2020. Regions close to national parks, with coasts or in areas where there is a high proportion of second homes receive a significant surge in domestic travel flows. The findings contrast results based on pre-COVID domestic summer tourism data (2017–2019), for which neither the establishment density nor the control variables coastal area or national park are significant determinants. There is, however, a negative spillover effect of second homes for the average July.
The strongest change in demand appears in regions with low economic activity, surrounded by areas with equally low density of establishments. Regions surrounded by a 10% lower establishment density exhibit an almost two percentage points higher growth rate in domestic overnight stays as compared to the months of July and August in the years prior to 2020. In addition, regions near national parks experience a 24 percentage points higher growth rate in domestic overnight stays. Thus, the absence of events as well as the spread of the virus and measures to control it clearly steer the domestic tourism behaviour.
Several policy implications can be drawn from the results. The findings highlight that the effects of the pandemic differ markedly across regions in a way that partly reverse the development of previous years. Areas characterized by the highest levels of economic activity are those most strongly negatively affected. These are regions that are normally not eligible for any kinds of domestic or international support schemes. The magnitude of the decline is unprecedented implying that it contributes to a lat of the earlier ongoing city tourism boom, at least temporarily. Low demand for city tourism and areas with high economic activity by domestic travellers could remain even after the COVID-19 pandemic is under control, due to behavioural changes and the well-known persistence in tourism demand. There is a possibility that events and places where people cannot properly distance themselves from each other will be considered frightening for a longer period of time. A positive aspect of the situation is that areas acknowledged as over-visited are given some time for recovery and consideration of more sustainable strategies for future tourism. One methodological implication is that domestic tourism demand cannot be analysed at the aggregate level only, because of the risk of balancing out important movements at lower levels. Results also indicate that regions should not be analysed in isolation, since the absence of spatial parameters may introduce omitted variable bias.
Several limitations must be noted. The results refer to France during the first pandemic summer of 2020. Tourism during other seasons in the same year cannot be analysed because of the travel bans incurred. The study focuses on the short-term effects of the pandemic; medium- and long-term implications or dynamic relationships are for future research to answer. Another area for future work is the use of individual travel data. This will allow to account for individual characteristics and will also be beneficial since they hold information on travel flows and motivations (mountains, lakes, cities et cetera) and possibly characteristics of the destination.
Disclosure statement
No potential conflict of interest was reported by the author(s).
Data availability statement
Data is available upon acceptance
References
- ICCA. (2019). The International Association, Meetings Market 2019, ICCA Statistics Report - Public Abstract. Retrieved, December 27, 2020, from https://www.iccaworld.org/newsarchives/archivedetails.cfm?id=2812383
- OECD. (2020). Mitigating the impact of COVID-19 on tourism and supporting recovery, OECD Tourism Papers, 2020/03. OECD Publishing. https://doi.org/http://doi.org/10.1787/47045bae-en
- INSEE. (2021). Comparateur de territoire. https://www.insee.fr/fr/statistiques/1405599?geo=DEP-971+DEP-75+DEP-76)
- Adie, B. A. (2020). Place attachment and post-disaster decision-making in a second home context: A conceptual framework. Current Issues in Tourism, 23(10), 1205–1215. https://doi.org/https://doi.org/10.1080/13683500.2019.1600475
- Altuntas, F., & Gok, M. S. (2021). The effect of COVID-19 pandemic on domestic tourism: A DEMATEL method analysis on quarantine decisions. International Journal of Hospitality Management, 92, 102719. https://doi.org/https://doi.org/10.1016/j.ijhm.2020.102719
- Alvarez-Diaz, M., D'Hombres, B., Ghisetti, C., & Pontarollo, N. (2020). Analysing domestic tourism flows at the provincial level in Spain by using spatial gravity models. International Journal of Tourism Research, 22(4), 403–415. https://doi.org/https://doi.org/10.1002/jtr.2344
- Anguera-Torrell, O., Vives-Perez, J., & Aznar-Alarcón, J. P. (2021). Urban tourism performance index over the COVID-19 pandemic. International Journal of Tourism Cities, early online. https://doi.org/https://doi.org/10.1108/IJTC-09-2020-0206
- Arbulú, I., Razumova, M., Rey-Maquieira, J., & Sastre, F. (2021). Can domestic tourism relieve the COVID-19 tourist industry crisis? The case of Spain. Journal of Destination Marketing & Management, 20, 100568. https://doi.org/https://doi.org/10.1016/j.jdmm.2021.100568
- Back, A. (2020). Temporary resident evil? Managing diverse impacts of second-home tourism. Current Issues in Tourism, 23(11), 1328–1342. https://doi.org/https://doi.org/10.1080/13683500.2019.1622656
- Boto-García, D., & Leoni, V. (2021). Exposure to COVID-19 and travel intentions: Evidence from Spain. Tourism Economics, 1354816621996554. https://doi.org/https://doi.org/10.1177/1354816621996554
- Buckley, R., & Westaway, D. (2020). Mental health rescue effects of women's outdoor tourism: A role in COVID-19 recovery. Annals of Tourism Research, 85, 103041. https://doi.org/https://doi.org/10.1016/j.annals.2020.103041
- Cafiso, G., Cellini, R., & Cuccia, T. (2018). Do economic crises lead tourists to closer destinations? Italy at the time of the great recession. Papers in Regional Science, 97(2), 369–386. https://doi.org/https://doi.org/10.1111/pirs.12242
- Caligiuri, P., De Cieri, H., Minbaeva, D., Verbeke, A., & Zimmermann, A. (2020). International HRM insights for navigating the COVID-19 pandemic: Implications for future research and practice. Journal of International Business Studies, 51(5), 697–713. https://doi.org/https://doi.org/10.1057/s41267-020-00335-9
- Cartenì, A., Di Francesco, L., & Martino, M. (2020). How mobility habits influenced the spread of the COVID-19 pandemic: Results from the Italian case study. Science of the Total Environment, 741, 140489. https://doi.org/https://doi.org/10.1016/j.scitotenv.2020.140489
- Ciccone, A. (2002). Agglomeration effects in Europe. European Economic Review, 46(2), 213–227. https://doi.org/https://doi.org/10.1016/S0014-2921(00)00099-4
- Coccia, M. (2020). Factors determining the diffusion of COVID-19 and suggested strategy to prevent future accelerated viral infectivity similar to COVID. Science of the Total Environment, 729, 138474. https://doi.org/https://doi.org/10.1016/j.scitotenv.2020.138474
- Craig, C. A. (2021). Camping, glamping, and coronavirus in the United States. Annals of Tourism Research, 89, 103071. https://doi.org/https://doi.org/10.1016/j.annals.2020.103071
- Doran, J., McCarthy, N., & O’Connor, M. (2016). Entrepreneurship and employment growth across European regions. Regional Studies, Regional Science, 3(1), 121–128. https://doi.org/https://doi.org/10.1080/21681376.2015.1135406
- Habibi, F. (2017). The determinants of inbound tourism to Malaysia: A panel data analysis. Current Issues in Tourism, 20(9), 909–930. https://doi.org/https://doi.org/10.1080/13683500.2016.1145630
- Hall, C. M., & Müller, D. K. (2004). Introduction: Second homes, curse or blessing? Revisited. In C. M. Hall, & D. K. Müller (Eds.), Tourism, mobility and second homes. Between elite landscape and common ground (pp. 3–14). Aspects of Tourism 15. Channel View Publications.
- Hiltunen, M. J. (2007). Environmental impacts of rural second home tourism–case Lake District in Finland. Scandinavian Journal of Hospitality and Tourism, 7(3), 243–265. https://doi.org/https://doi.org/10.1080/15022250701312335
- Huybers, T. (2003). Domestic tourism destination choices – A choice modelling analysis. International Journal of Tourism Research, 5(6), 445–459. https://doi.org/https://doi.org/10.1002/jtr.450
- Ivanov, S. H., Webster, C., Stoilova, E., & Slobodskoy, D. (2020). Biosecurity, crisis management, automation technologies and economic performance of travel, tourism and hospitality companies – A conceptual framework. Tourism Economics, 1354816620946541. https://doi.org/https://doi.org/10.1177/1354816620946541
- Jaakson, R. (1986). Second-home domestic tourism. Annals of Tourism Research, 13(3), 367–391. https://doi.org/https://doi.org/10.1016/0160-7383(86)90026-5
- Jeon, C. Y., & Yang, H. W. (2021). The structural changes of a local tourism network: Comparison of before and after COVID-19. Current Issues in Tourism, 1–15. https://doi.org/https://doi.org/10.1080/13683500.2021.1874890
- Jin, X., Bao, J., & Tang, C. (2021). Profiling and evaluating Chinese consumers regarding post-COVID-19 travel. Current Issues in Tourism, 1–19. https://doi.org/https://doi.org/10.1080/13683500.2021.1874313
- Karimi, M. S., Khezri, M., & Razzaghi, S. (2021). Impacts of regional conflicts on tourism in Africa and the Middle East: A spatial panel data approach. Current Issues in Tourism, https://doi.org/https://doi.org/10.1080/13683500.2021.1931054
- Kim, M. J., Bonn, M., & Hall, C. M. (2021). What influences COVID-19 biosecurity behaviour for tourism? Current Issues in Tourism, 1–7. https://doi.org/https://doi.org/10.1080/13683500.2021.1883558
- Kock, F., Nørfelt, A., Josiassen, A., Assaf, A. G., & Tsionas, M. G. (2020). Understanding the COVID-19 tourist psyche: The evolutionary tourism paradigm. Annals of Tourism Research, 85, 103053. https://doi.org/https://doi.org/10.1016/j.annals.2020.103053
- Koens, K., Postma, A., & Papp, B. (2018). Is overtourism overused? Understanding the impact of tourism in a city context. Sustainability, 10(12), 4384. https://doi.org/https://doi.org/10.3390/su10124384
- Lai, K. Y., Webster, C., Kumari, S., & Sarkar, C. (2020). The nature of cities and the COVID-19 pandemic. Current Opinion in Environmental Sustainability, 46, 27–31. https://doi.org/https://doi.org/10.1016/j.cosust.2020.08.008
- LeSage, J. (2014). What regional scientists need to know about spatial econometrics. The Review of Regional Studies, 44(1), 13–32. https://doi.org/https://doi.org/10.2139/ssrn.2420725
- LeSage, J., & Ha, C. (2012). The impact of migration on social capital – Do migrants take their bowling balls with them? Growth and Change, 43(1), 1–26. https://doi.org/https://doi.org/10.1111/j.1468-2257.2011.00575.x
- LeSage, J., & Pace, R. K. (2009). Introduction to spatial econometrics. Chapman and Hall/CRC.
- Li, Z., Zhang, X., Yang, K., Singer, R., & Cui, R. (2021). Urban and rural tourism under COVID-19 in China: Research on the recovery measures and tourism development. Tourism Review, 76, 718–736, ahead-of-print. https://doi.org/https://doi.org/10.1108/TR-08-2020-0357
- Loveridge, S., & Nizalov, D. (2007). Operationalizing the entrepreneurial pipeline theory: An empirical assessment of the optimal size distribution of local firms. Economic Development Quarterly, 21(3), 244–262. https://doi.org/https://doi.org/10.1177/0891242407301449
- Majewska, J. (2015). Inter-regional agglomeration effects in tourism in Poland. Tourism Geographies, 17(3), 408–436. https://doi.org/https://doi.org/10.1080/14616688.2014.997279
- Marjavaara, R., & Müller, D. K. (2007). The development of second homes’ assessed property values in Sweden 1991–2001. Scandinavian Journal of Hospitality and Tourism, 7(3), 202–222. https://doi.org/https://doi.org/10.1080/15022250601160305l
- Marques, C. P., Guedes, A., & Bento, R. (2021). Rural tourism recovery between two COVID-19 waves: The case of Portugal. Current Issues in Tourism, 1–7. https://doi.org/https://doi.org/10.1080/13683500.2021.1910216
- Massidda, C., & Etzo, I. (2012). The determinants of Italian domestic tourism: A panel data analysis. Tourism Management, 33(3), 603–610. https://doi.org/https://doi.org/10.1016/j.tourman.2011.06.017
- Miao, L., Im, J., Fu, X., Kim, H., & Zhang, Y. E. (2021). Proximal and distal post-COVID travel behavior. Annals of Tourism Research, 88, 103159. https://doi.org/https://doi.org/10.1016/j.annals.2021.103159
- Nepal, S. K., & Jamal, T. B. (2011). Resort-induced changes in small mountain communities in British Columbia, Canada. Mountain Research and Development, 31(2), 89–101. https://doi.org/https://doi.org/10.1659/MRD-JOURNAL-D-10-00095.1
- Neuburger, L., & Egger, R. (2021). Travel risk perception and travel behaviour during the COVID-19 pandemic 2020: A case study of the DACH region. Current Issues in Tourism, 24(7), 1003–1016. https://doi.org/https://doi.org/10.1080/13683500.2020.1803807
- Ntounis, N., Parker, C., Skinner, H., Steadman, C., & Warnaby, G. (2021). Tourism and Hospitality industry resilience during the COVID-19 pandemic: Evidence from England. Current Issues in Tourism, 1–14. https://doi.org/https://doi.org/10.1080/13683500.2021.1883556
- Osti, L., & Nava, C. R. (2020). Loyal: To what extent? A shift in destination preference due to the COVID-19 pandemic. Annals of Tourism Research: Empirical Insights, 1(1), 100004. https://doi.org/https://doi.org/10.1016/j.annale.2020.100004
- Pace, R. K., & Zhu, S. (2012). Separable spatial modeling of spillovers and disturbances. Journal of Geographical Systems, 14(1), 75–90. https://doi.org/https://doi.org/10.1007/s10109-011-0155-7
- Rader, B., Scarpino, S. V., Nande, A., Hill, A. L., Adlam, B., Reiner, R. C., Pigott, D. M., Gutierrez, B., Zarebski, A. E., Shrestha, M., Brownstein, J. S., Castro, M. C., Dye, C., Tian, H., Pybus, O. G., Kraemer, M. U. G. (2020). Crowding and the shape of COVID-19 epidemics. Nature Medicine, 26(12), 1829–1834. https://doi.org/https://doi.org/10.1038/s41591-020-1104-0
- Rocklöv, J., & Sjödin, H. (2020). High population densities catalyse the spread of COVID-19. Journal of Travel Medicine, 27(3), taaa038. https://doi.org/https://doi.org/10.1093/jtm/taaa038
- Romão, J., Guerreiro, J., & Rodrigues, P. (2013). Regional tourism development: Culture, nature, life cycle and attractiveness. Current Issues in Tourism, 16(6), 517–534. https://doi.org/https://doi.org/10.1080/13683500.2012.699950
- Romão, J., Kourtit, K., Neuts, B., & Nijkamp, P. (2018). The smart city as a common place for tourists and residents: A structural analysis of the determinants of urban attractiveness. Cities, 78, 67–75. https://doi.org/https://doi.org/10.1016/j.cities.2017.11.007
- Romão, J., & Nijkamp, P. (2019). Impacts of innovation, productivity and specialization on tourism competitiveness–a spatial econometric analysis on European regions. Current Issues in Tourism, 22(10), 1150–1169. https://doi.org/https://doi.org/10.1080/13683500.2017.1366434
- Rosalina, P. D., Dupre, K., & Wang, Y. (2021). Rural tourism: A systematic literature review on definitions and challenges. Journal of Hospitality and Tourism Management, 47, 134–149. https://doi.org/https://doi.org/10.1016/j.jhtm.2021.03.001
- Seraphin, H., & Dosquet, F. (2020). Mountain tourism and second home tourism as post COVID-19 lockdown placebo? Worldwide Hospitality and Tourism Themes, 12(4), 485–500. https://doi.org/https://doi.org/10.1108/WHATT-05-2020-0027
- Sharifi, A., & Khavarian-Garmsir, A. R. (2020). The COVID-19 pandemic: Impacts on cities and major lessons for urban planning, design, and management. Science of The Total Environment, 749, 142391. https://doi.org/https://doi.org/10.1016/j.scitotenv.2020.142391
- Silva, L. (2021). The impact of the COVID-19 pandemic on rural tourism: A case study from Portugal. Anatolia, 1–3. https://doi.org/https://doi.org/10.1080/13032917.2021.1875015
- Vaishar, A., & Šťastná, M. (2020). Impact of the COVID-19 pandemic on rural tourism in Czechia preliminary considerations. Current Issues in Tourism, 1–5. https://doi.org/https://doi.org/10.1080/13683500.2020.1839027
- Wen, J., Kozak, M., Yang, S., & Liu, F. (2021). COVID-19: Potential effects on Chinese citizens’ lifestyle and travel. Tourism Review, 76(1), 74–87. https://doi.org/https://doi.org/10.1108/TR-03-2020-0110
- Woodward, D., Figueiredo, O., & Guimaraes, P. (2006). Beyond the Silicon Valley: University R&D and high-technology location. Journal of Urban Economics, 60(1), 15–32. https://doi.org/https://doi.org/10.1016/j.jue.2006.01.002
- Yang, Y., & Fik, T. (2014). Spatial effects in regional tourism growth. Annals of Tourism Research, 46, 144–162. https://doi.org/https://doi.org/10.1016/j.annals.2014.03.007
- Yang, Y., Liu, Z. H., & Qi, Q. (2014). Domestic tourism demand of urban and rural residents in China: Does relative income matter? Tourism Management, 40, 193–202. https://doi.org/https://doi.org/10.1016/j.tourman.2013.05.005
- Zaninetti, J. M. (2013). Vacation homes in France since 1962. In Z. Roca (Ed.), Second home tourism in Europe: Lifestyle issues and policy responses (pp. 141–163.
- Zheng, D., Luo, Q., & Ritchie, B. W. (2021). Afraid to travel after COVID-19? Self-protection, coping and resilience against pandemic ‘travel fear’. Tourism Management, 83, 104261. https://doi.org/https://doi.org/10.1016/j.tourman.2020.104261
- Zoğal, V., Domènech, A., & Emekli, G. (2020). Stay at (which) home: Second homes during and after the COVID-19 pandemic. Journal of Tourism Futures, early online, https://doi.org/https://doi.org/10.1108/JTF-06-2020-0090
Appendix
Figure A1. Spatial distribution of the dependent variables. Source: Insee and own calculations.
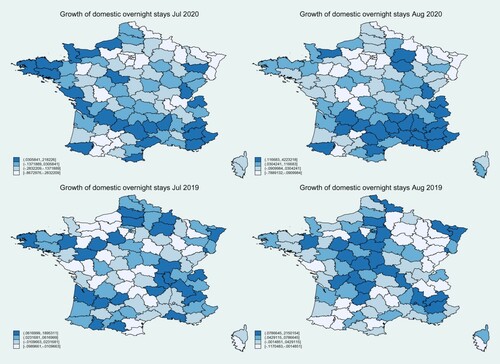
Figure A2. Spatial distribution of the independent variables. Source: Insee and own calculations.
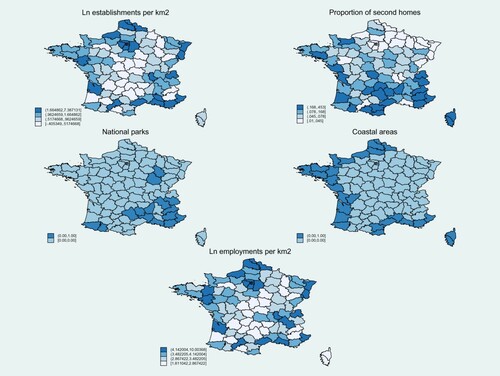
Table A1. Determinants of domestic overnight stays, spatial estimations (robustness check).
Table A2. Determinants of domestic overnight stays, average marginal effects, spatial estimations (robustness check).