
 ?Mathematical formulae have been encoded as MathML and are displayed in this HTML version using MathJax in order to improve their display. Uncheck the box to turn MathJax off. This feature requires Javascript. Click on a formula to zoom.
ABSTRACT
The importance of tourism expenditure is widely recognized, but the spatial patterns of visitor expenditure in cities is so far an unexplored subject. The main aim of this paper is to analyze the spatial distribution of visitor spending using bank card transaction data. Spatial statistics tools are used to identify expenditure clustering patterns and hot spots, distinguishing between national and foreign visitors, and comparing their patterns with those of locals. Our analysis shows that visitor expenditure, and especially that of foreigners, is much more concentrated in the city centre and spatially clustered than local spending. OLS regressions and spatial regression models are used for explaining the spatial distribution of visitor expenditure. Predictors are extracted from old (Cadastre) and new (the social network Foursquare) data sources. Regressions results indicate that socio-symbolic variables have greater explanatory power than physical dimension variables, that expenditure falls sharply with the distance to the city centre, and that the amount of spending in each spatial unit is influenced by the expenditure in the neighbouring spatial units. The paper demonstrates the great potential of this data source to explore with a high level of detail the spatial patterns and drivers of visitor spending within urban destinations.
1. Introduction
Urban tourism has experienced significant growth in recent decades. In fact, urban tourism is the tourism sector that has grown the most during the twenty-first century. Since cities are multifunctional spaces that offer a great variety of attractions, facilities and services, urban tourism encompasses a diversity of motivations and activities, such as attending congresses, conferences and business meetings, visiting historical monuments, galleries and museums, visiting friends and family, shopping, etc. Some visitors may consume only one product (for example, visit to an art gallery), while others may consume a bundle of products (several products such as a visit to a theatre and museum and a meal in a restaurant) (Hall & Page, Citation2014).
Many cities have benefited from the consumption of a growing number of tourists, whose spending contributes to the local economy and job creation. Tourism has become the main economic activity in some cities and an essential activity in many others (Van der Borg et al., Citation1996). The importance of tourism expenditure is widely recognized, both by private sector and by local authorities and destination marketing organizations (Lin et al., Citation2015). Tourism expenditure produces a direct, indirect and induced economic impact. Direct spending is the expenditure by visitors on goods and services consumed (e.g. hotels, restaurants, fashion shops and tourist transport services). This expenditure is used by companies to pay for services, taxes and employees (indirect impact) and the expenditure of these employees also produces impacts on the local economy (induced impact). Thus, direct visitor expenditure represents only the first impact on an urban destination (Hall & Page, Citation2003).
The growing number of tourists has produced not only economic benefits for many cities but also conflicts with the local population. In fact, over-tourism has become a serious problem for some urban destinations, such as Venice and Barcelona (Gutiérrez et al., Citation2017). The increasing number of tourists exceeds the carrying capacity of the city centres, producing an unacceptable alteration in the physical environment, a serious loss of the quality of the visitor experience and an unacceptable pressure on the local population. The pressure of tourism on the value of urban facilities and premises creates an incentive for citizens and firms to abandon central locations, a process known as tourism gentrification (Russo, Citation2002). In extreme cases, a middle-class neighbourhood is transformed into a relatively affluent and exclusive enclave marked by a proliferation of corporate entertainment and tourism venues. The case of the French quarter in New Orleans is a paradigmatic example of tourism gentrification (Gotham, Citation2005). Tourist gentrification influences the spatial distribution of direct visitor expenditure, in the sense that the more gentrified an area is, the more visitor spending will be in that area.
Over-tourism is a consequence not only of the increasing number of tourists visiting cities but also of the fact that tourists make very selective use of the city. It is well-known that tourists tend to seek hotels and apartments in the city centre within walking distance of major attractions in the city (Arbel & Pizam, Citation1977). Tourists tend to be concentrated in specific areas of the city centre, particularly in the tourism business district (Hall & Page, Citation2003), where they find the main tourist attractions (historical buildings and parks, museums, theatres, concert halls, etc.), along with leisure and shopping facilities and accommodation services for tourists (Pearce, Citation1987). Consequently, it can be inferred that direct tourism expenditure is concentrated in the city centre too. However, the spatial patterns of tourism expenditure within cities have not been studied so far.
Understanding tourism expenditure is of vital importance for cities because ‘tourism is an expenditure-driven economic activity’ (Mihalic, Citation2002). Tourist expenditure research is well grounded in urban tourist studies, focusing mostly on identifying socio-economic factors and travel characteristics affecting tourist expenditure in urban destinations, but there is little knowledge available on the spatial patterns of tourist expenditure in cities. This is mainly because the main source used (surveys) does not provide useful data for this purpose. The large scale of big data could, to some extent, make up for the limitation of sample size issues faced by survey data users, providing a new way to understand tourist behaviour (Yang et al., Citation2015). Not surprisingly, even at an early stage, diverse big data sources have been applied to tourism research and made an amazing improvement (Li et al., Citation2018). While there are numerous studies using geolocation data from social media and devices, analyzing the areas of concentration of tourists, research based on bank card transaction data remains at a highly embryonic stage.
Our paper enriches the literature on the spatial patterns of urban tourism, adding new knowledge on tourist expenditure within cities. Traditional data sources provided information on the location of the tourist supply within cities (tourist attractions, facilities and services). New data sources (GPS tracks, mobile phones, social networks, etc.) have provided relevant information on the places that tourists visit and their mobility patterns within cities, but tourist expenditure within cities remained until now an unexplored issue. This paper contributes to fill this gap in research on the spatial pattern of urban tourism, by adding the expenditure perspective thanks to the use of bank card transaction data. Spatial statistical tools are used to analyze spatial clustering patterns and to identify expenditure hotspots according to the different groups of consumers. In addition, Ordinary Least Square regressions, Spatial Lag Models and Spatial Error Models are applied to explain the spatial patterns in visitor expenditure, taking as independent variables the distance to the city centre, variables drawn from the cadastre, and variables extracted from the Foursquare social network. The variables drawn from the cadastre express the physical dimension of tourist facilities and services, and those drawn from social media reflect the popularity and preferences of consumers (social-symbolic capital) with regard to these locations. As far as we are aware, no paper has so far addressed an analysis of these characteristics. For this research, we use geo-located bank card expenditure data in the city of Madrid, Spain, provided by one of the leading Spanish banks (BBVA). The analysis is conducted by segmenting expenditure in accordance with the type of consumer (local, domestic visitor and foreign visitor).
The paper is structured as follows. After this brief introduction, Section 2 reviews the related literature, Section 3 describes the data and methodology, Section 4 shows the main results, and Section 5 discusses the results and presents the main conclusions.
2. Urban tourism expenditure: from old data sources to big data
One of the biggest challenges facing the tourism industry is the need to overcome the lack of information necessary to target consumers (Jang & Ham, Citation2009). Most studies on tourism expenditure are based on surveys data obtained from structural household surveys. They are official datasets of governmental institutions, which regularly collect data from household or consumer panels, or from face-to-face surveys in public places (Brida & Scuderi, Citation2013). Thus, for example, Zheng and Zhang (Citation2013) used the Consumer Expenditure Survey to study the influence of income and household characteristics on tourist expenditure patterns in the USA, and Lin et al. (Citation2015) used China’s urban household survey data to analyze the impacts of the economic and socio-demographic characteristics of urban household expenditure on tourism in different age cohorts. The second type of source of data is specific surveys on tourist behaviour (see, for example, Nicolau & Más, Citation2005a, Citation2005b). Surveys on tourist spending carried out by some cities are of special interest for research on urban tourism. Thus, for example, the study by van Loon and Rouwendal (Citation2017) used survey data collected for the Amsterdam Metropolitan for analyzing tourist expenditure, concluding that trip purposes are associated with substantial differences in total daily expenditure as well as on budget shares.
The existing literature on tourism acknowledges the significant influence of economic, socio-demographic, cultural, travel-related and psychological characteristics of tourists on their expenditure (Brida & Scuderi, Citation2013; Lin et al., Citation2015; Wang & Davidson, Citation2010). Thus, for example, the literature reveals that income has a positive impact on tourism expenditure (Brida & Scuderi’s, Citation2013). The relationship between education and expenditure is more controversial. Alegre et al. (Citation2013) and Cai et al. (Citation1996) suggest that the educational level is positively related to spending, while Nicolau and Más (Citation2005a) conclude that education is related to the propensity to travel, but not to expenditure. Regarding the socio-demographic determinants of tourism expenditure, several studies have found that older and middler-agers travellers spent more than younger travellers (Wang & Davidson, Citation2010), while gender does not seem to influence tourism expenditure (Brida & Scuderi, Citation2013). Certainly, surveys reveal interesting overall patterns and determinants of tourist expenditure, but rarely is there any breakdown on where that spending occurs within the city and who the beneficiaries are (Parlett et al., Citation1995).
Big data opens up new avenues in research on patterns and drivers of tourist expenditure, incorporating the spatial dimension. When visiting cities, tourists voluntarily or involuntarily generate massive quantities of data which is very useful for exploring their behaviour, expenditure, preferences and feelings. For example, tourists typically leave a digital trace when they make calls on their cell phones (Ahas et al., Citation2007; Park et al., Citation2020; Raun et al., Citation2017; Saluveer et al., Citation2020), when they visit web pages (Li et al., Citation2020) or when they use social media (Chen et al., Citation2021; García-Palomares et al., Citation2015; Jin et al., Citation2018; Martí et al., Citation2019; Salas-Olmedo et al., Citation2018; Vu et al., Citation2018). Bank card transaction data are of particular interest in studying tourist expenditure (Sobolevsky et al., Citation2014b). These data are produced by people’s actions (what people do is recorded, not what people say they do, as in surveys), offer huge samples, and, compared with surveys, it is non-intrusive. Since bank card transactions data is difficult to access, some papers have used the social network Foursquare data as a proxy for analyzing urban consumption spaces (Carpio-Pinedo & Gutiérrez, Citation2020) or, more specifically, consumption activities of tourists within cities (Salas-Olmedo et al., Citation2018) and potential tourist hotspots (Martí et al., Citation2021). As far as we know, to date, only four papers have used data from bank card transactions in tourism research (Sobolevsky et al., Citation2014a, Citation2014b; Weaver, Citation2008 and Citation2015). None of these papers explores the spatial patterns of tourist expenditure within cities.
Transactional data of bank cards include all the payments carried out by the bank’s customers with their cards and also those carried out at Point of Sale terminals belonging to the bank, either by cardholders of that bank and of other banks. Every time a bank cardholder carries out a payment at a Point of Sale, data of that transaction (amount and timestamp), of the card holder (anonymized user ID and residence postcode), and of the business (at least, anonymized business ID and geographical coordinates of the Point of Sale) are automatically stored. To ensure anonymization not only for cardholders, but also of businesses, data can be aggregated spatially and temporally. Bank card payment data provides very large samples, as the use of bank cards has become progressively more widespread in recent decades. Payments using bank cards increase relative to cash payments as the payment amount increases. According to 2019 data, in Spain, the use of bank cards represents 15% of transactions and 28% of the value of payments (European Central Bank, Citation2020). Tourists tend to use bank cards much more than locals. In fact, spending with bank cards in Spain in 2018 represented 60.7% of total destination spending of foreign tourists (Turespaña, Citation2018).
In summary, research on tourist spending in cities is based thus far on surveys, which do not provide the spatial detail necessary for an analysis of spatial patterns of tourist expenditure. Some papers have used geo-located data from social networks (Foursquare) as a proxy for tourist consumption, but this social network does not properly reflect tourist spending, but in fact, popularity. Our paper aims to cover this research gap, providing new insights and knowledge on the visitor locational patterns within cities, by adding the expenditure approach, and showing the potential of bank card transaction data in tourism research.
3. Data and methodology
3.1. Study area
The area studied in Madrid, Spain, one of the major urban tourism destinations in Europe. The municipality of Madrid (population 3.2 million) received 10.2 million tourist visitors in 2018 (53.3% foreign and 46.7% domestic), generating 21.4 million overnight stays in hotels and regulated apartments (60.9% foreign tourists and 39.1% domestic tourists) (Ayuntamiento de Madrid, Citation2019). Unsurprisingly, foreign tourists spent more nights in Madrid than domestic tourists (2.4 nights on average as opposed to 1.8), since the more distant the tourist destination is, the more likely visitors are to spend more days at that destination.
The main inbound markets are the United States (with a market share of 12.5%), Italy (6.9%) and France (6.8%). This influx of international visitors has an important economic and social impact on the region of Madrid, generating 9.32 billion euros in 2018 (7.05 billion in the municipality of Madrid), with an average spend per person of 1307 euros. The flow of tourists is highly stable throughout the year. October is the month with the greatest inflow of tourists (949,873), while January sees the fewest tourists (715,896) (Ayuntamiento de Madrid, Citation2019).
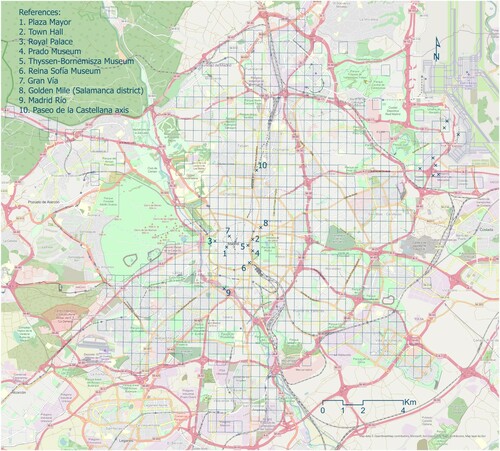
Madrid has a wide and varied hotel offering, with a total of 793 hotels, 85,418 beds and 43,816 rooms. The number of apartments for tourist use advertised via digital platforms amounts to 20,217, of which some 60% are within the historical city centre. The presence of tourists is highly concentrated in the city centre in comparison to other European cities (García-Palomares et al., Citation2015), and the degree of specialization of tourist spaces (sightseeing, consumption and accommodation) tends to increase from the historic centre radiating outwards towards the periphery (Salas-Olmedo et al., Citation2018). shows the reference points of tourist attraction in the city of Madrid.
Figure 1. Main points of tourist attraction in the city of Madrid.
3.2. Data
Our database on tourist expenditure includes all BBVA card transactions and any other card transaction in BBVA Point of Sales terminals in physical stores in Madrid during 2018.Footnote1 For our study, we focus mainly on this second group (card transaction data in BBVA Point of Sales terminals). The dataset contains a total of 52.9 million transactions. The data were aggregated within 500 m × 500 m tiles (). This tessellation is more suitable than administrative units in order to mitigate the MAUP problem, since the grid consists of spatial units with the same shape and size. For each tile, aggregate data is available as to purchase amount and number of transactions segmented by consumer’s origin. The transactions could be segmented by distinguishing between locals (resident in the province of Madrid), domestic visitors (resident in other Spanish provinces) and foreign tourists, in accordance with the place of residence of the bank card holder.Footnote2 In our analysis, the domestic visitor category includes not only domestic tourists (those staying at least one night in the city of Madrid) but also day trippers.Footnote3 Business travellers who make the roundtrip on the day are included as day trippers.
The expenditure of foreign tourists in 2018, according to the BBVA dataset, was expanded based on the total expenditure of foreign tourists in the same period according to official sources (Ayuntamiento de Madrid, Citation2019). The same expansion factor was also applied to expand the data of all groups. Since the use of bank cards in Spain is much lower for locals (28% of the value of payments) than for visitors (60.7%), as a second step, we applied an additional expansion factor to locals based on the difference in the use of bank cards between locals and tourists.
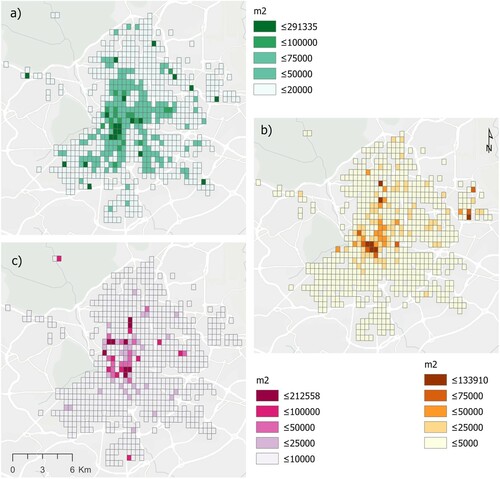
In order to explain the spatial distribution of visitor expenditure, old and new sources of data were used. The physical offering of establishments where tourists could consume goods and services may be measured by means of the cadastre, which provides the area of each building in accordance with land use (physical dimension). The land-use categories most related with tourist consumption were selected: commerce; hospitality (restaurants and hotels); and cinemas, theatres and shows. shows the spatial distribution of these categories.
Figure 2. Area of establishment categories aggregated by tiles (Cadastre): (a) Commerce, (b) Hospitality and (c) Cinemas, theatres and shows (m2).
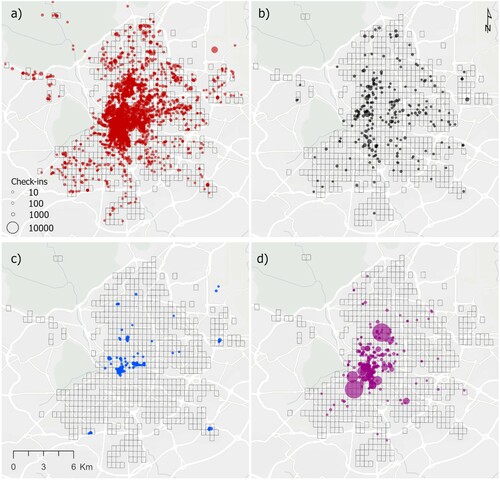
The physical offering of establishments covers the entire city, as it is required to serve the entire population. However, tourists make highly selective use of the city. Some central areas of cities are swamped by tourists, while most peripheral areas are scarcely visited by them, despite the fact that they have an extensive offering of services. It is therefore not enough to take into account the physical offering of services and facilities of the city. We should also pay attention to the popularity of establishments (socio-symbolic dimension). It is highly useful to this end to use social big data, since through social media, locals and tourists provide information about their preferences with regard to the establishments that they visit. Foursquare is a social network where users record the places that they visit, share this record publicly (‘check-in’), comment and interact with other users. In Foursquare, places are the combined result of actions and perceptions, as a place only exists as long as somebody visits and consciously chooses to check-in online (Roick & Heuser, Citation2013). Foursquare data allows to identify key city hotspots and their social relevance (Martí et al., Citation2021). There is an evident, socially eloquent bias: the number of check-ins does not represent buyers’ demand or sales proportionally, but rather the social implications of visiting that place (Carpio-Pinedo & Gutiérrez, Citation2020). People who make check-ins on Foursquare consider visiting the establishment worth sharing. For this very reason, Foursquare is particularly useful in the field of tourist consumption, as tourists tend to make use of the most popular establishments in the city (restaurants, clothing stores, theatres, etc.). In addition, Foursquare provides a quite precise layer that represents each place as a point (X, Y). Foursquare data is free to download using their API. shows the number of check-ins in Madrid according to various categories of establishments, some highly concentrated in the centre (for example, theatres, cinemas and shows) and others more widespread in other parts of the city (supermarkets). This study considered the number of check-ins at categories of establishment focused more on tourist consumption: Restaurants; Supermarkets; Clothing stores; Hotels; and Cinemas, theatres and shows.
Figure 3. Number of check-ins in some categories of establishments in Foursquare: (a) Restaurant, (b) Supermarket, (c) Clothing store and (d) Theatre, Cinema and Shows.
Distance to the city centre was used as a predictor in all models, since it is well known that visitors’ presence is particularly concentrated in the city centre.
3.3. Methodology
Distribution data on locals and tourists consumption aggregated by 500 × 500 m tiles were used to produce maps and descriptive statistics in order to explore the expenditure spatial patterns of national and international visitors, in comparison to those of locals. Expenditure maps provided a visual overview of the variable analyzed according to groups of consumers. Descriptive statistics were useful to compare the degree of spatial concentration of payments according to the origin of the card holders.
Univariate spatial autocorrelation tools were applied in order to identify the degree of spatial clustering of expenditure according to the origin of the card holders. Global Moran’s I statistic and Anselin Local Moran’s I were calculated. The spatial relationship used was the queen contiguity, equivalent to the distance threshold of 1000 m used in other studies on urban tourism (Gutiérrez et al., Citation2017), since the size of our tiles was 500 × 500 m. Global Moran’s I statistic was used to evaluate the clustering degree of the expenditure for each group of consumers in order to establish comparisons, while Anselin Local Moran’s I allowed the identification of consumption hot spots (High-High clusters, that is, a high value surrounded primarily by high values) and outliers (High-Low outliers, that is, a high value surrounded primarily by low values).
Finally, multiple regression analysis was used to generate explanatory models of the spatial distribution of tourist spending, comparing the patterns of tourists with those of locals and differentiating between national and foreign tourists. The variables used as regressors were extracted from the cadastre (physical dimension) and from Foursquare (socio-symbolic capital), whose values were aggregated by 500 × 500 m tiles in order to perform regressions. Additionally, we consider the distance to the city centre as an independent variable. We use not only Ordinary Least Squares regressions but also Spatial Lag Models and Spatial Error Models (Anselin, Citation2005).
Spatial Lag Model Incorporates spatial effects considering a spatially lagged dependent variable as an additional independent variable:
where is the dependent variable,
is a set of explanatory variables,
are the coefficients of the explanatory variables,
is the spatial lagged dependent variable,
is the spatial autoregressive coefficient, and
is a vector of error terms. The underlying idea for using Spatial Lag Models is that there is a spatial ‘contagion’ effect (substantive spatial autocorrelation) in the sense that spending on a given tile is influenced by spending on neighbouring tiles, given that visitors walk through the city centre along routes made up of a succession of neighbouring cells.
Spatial autocorrelation in the residuals using Ordinary Least Squares shows that the assumption of uncorrelated error terms is violated, suggesting that a significant spatially correlated independent variable may be is missing from the regression. As a result, the estimates are inefficient. Spatial Error Model incorporates spatial effects through error term:
where
is a vector or error terms, spatially weighted using the weights matrix
,
is the spatial error coefficient (the autoregressive parameter), and
is a vector of uncorrelated error terms.
We use the spatial relationship of queen contiguity in Spatial Lag Models and Spatial Lag Models because we obtain better fits with this spatial relationship than with longer distances.
Geographic Information Systems tools (ArcGIS 10.6) were used for mapping and performing spatial analysis. Statistical analysis was performed using GEODA software.
4. Spatial patterns of visitor expenditure
Across the city as a whole, total visitor expenditure registered in our expanded dataset amounts to 16,787 million euros, with higher expenditure among domestic visitors (9729 million) than foreigners (7057 million) (). This may be surprising, since according to the official statistics for Madrid, the proportion of foreign tourists is higher than domestic tourists, and they also stay for longer (see Section 3.1), but reflects a well-known fact, namely that some domestic tourists stay overnight in the home of family and friends, and are not reflected in the official statistics based on overnight stays at tourist accommodation and hotels. Furthermore, as indicated above (see Section 3.2), the dataset employed cannot distinguish between tourists and day trippers, and one would expect a high proportion of day trippers in the group of domestic visitors.
Table 1. Descriptive statistics of expenditure (in thousands of euros) according to bank card holder type.
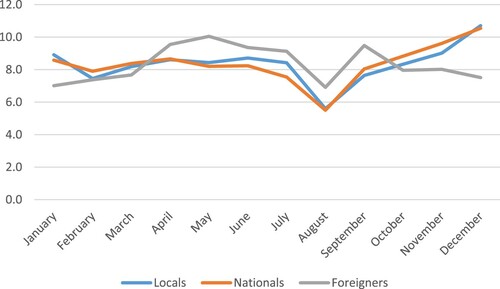
Expenditure of locals and visitors in Madrid varies considerably throughout the year (). Spending of local population shows a drop in August (summer holidays) and a peak in December (Christmas shopping). The spending of national visitors follows a similar pattern, since during the summer holidays they avoid travelling to Madrid because of the heat and before Christmas some of them visit Madrid for Christmas shopping. Finally, the expenditure of foreign visitors shows a significant drop in winter and the relative decrease in August. Some events (particularly the Madrid Pride Week), music festivals (such as MadridCool) and international football matches (Real Madrid) contribute to the percentage of spending from April to October being higher for foreigners than for the other consumer groups.
Figure 4. Seasonal change in expenditure patterns according to consumers groups (in percentages).
shows the descriptive statistics of expenditure according to consumer groups (expanded data) and tiles. The variation coefficient confirms that the spatial concentration of payments is higher for visitors (368) than for locals (214). In addition, it is higher for foreign visitors (497) than for domestic visitors (318), as had been hypothesized (Section 1).
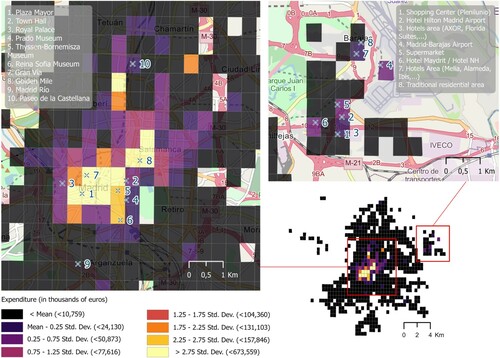
and show the areas with the greatest concentration of expenditure according to the origin of the bank card holders. Local population expenditure is spread over almost the entire city, but is mostly concentrated in the city centre and some peripheral spaces where there are shopping centres, according to the distribution of consumption spaces within the city (Carpio-Pinedo & Gutiérrez, Citation2020). Visitor expenditure, and particularly foreign visitor expenditure, is much more concentrated in the city centre, reflecting the areas most visited by tourists according to social media data (Salas-Olmedo et al., Citation2018). Bank card transaction data provide highly valuable information as to the intensity of visitor expenditure in certain parts of the city, in particular, the historic centre and what is known as the ‘Golden Mile’ (luxury shopping) of Madrid. In some tiles in the centre, visitor expenditure is in fact higher than local expenditure. This represents a huge source of income for establishments in these areas, which, nonetheless, because of their particular focus on tourist consumption, are more vulnerable to tourist crises. They are, in fact, those suffering the most from the current Covid-19 tourist crisis, with the closure of numerous hotels, stores and restaurants, while residential areas focused more on local consumption are keeping much greater activity. Interestingly, an area of high spending density emerges in the northeast, near the airport, including large commercial formats and hotels. This cluster, along with other peripheral hot spots, reflects a multiple nuclei model in the city.
Figure 5. Expenditure by locals (a), visitors (b), domestic visitors (c) and foreign visitors (d).
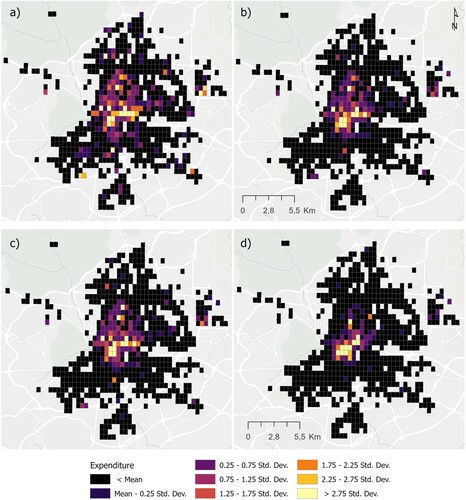
Figure 6. Total expenditure by foreign visitors. Left: Zoom to the City centre. Right: Zoom to the airport area.
The Global Moran’s I results show positive spatial autocorrelation in all bank card holder groups (). Since the p-values are below the cut-off value of 0.05, the null hypothesis that the spatial pattern of transactions is completely random can be rejected. As expected, spatial clustering is clearly higher for visitors (0.629) than for locals (0.426), and for foreign visitors (0.630) than for domestic ones (0.524). Expenditure by foreign visitors is thus not only more spatially concentrated than in the case of domestic visitors, according to the results provided by the variation coefficient (), but is also more spatially clustered ().
Table 2. Global Moran’s I statistics: Total expenditure (queen contiguity).
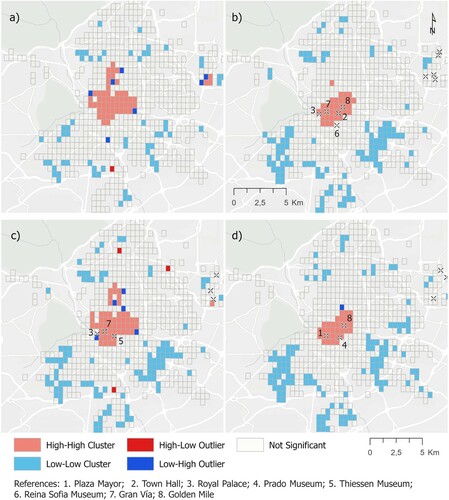
The local spatial autocorrelation analysis () shows spatial clusters and outliers statistically significant at the 0.05 level. Focusing attention on visitors, a High-High cluster emerges in the city centre covering the most touristic area of Madrid, including the main museums (Prado, Thiessen, Reina Sofía), monuments (Royal Palace, Plaza Mayor, Town Hall, etc.), theatres, shopping areas (Golden Mile, Gran Vía), as well as a large number of hotels and restaurants. A smaller High-High cluster is observed in the case of foreign visitors than domestic visitors, once again revealing their tendency to concentrate their expenditure within a very limited area of the city centre. This trend is reinforced by the fact that this group of bank card holders do not show any outlier High-Low, as opposed to the case of domestic visitors and locals, who make a significant proportion of their expenditure at shopping centres in the periphery of the city, which emerge as High-Low outliers.
Figure 7. Results of the Anselin Local Moran's I (queen contiguity): (a) Locals, (b) visitors, (c) domestic visitors and (d) foreign visitors. References: 1. Plaza Mayor; 2. Town Hall; 3. Royal Palace; 4. Prado Museum; 5. Thyssen-Bornemisza Museum; 6. Reina Sofía Museum; 7. Gran Vía; and 8. Golden Mile.
5. Factors explaining the spatial distribution of tourist expenditure
The results of the Ordinary Least Squares regressions considering variables extracted from cadaster (physical dimension of establishments) as regressors () indicate moderate explanatory power (with an R2 value of 0.43 for visitors and 0.41 for locals). All the regressions have the expected signs, positive for the cadastre variables (shopping, hospitality, shows), and negative for distance to the city centre. Robust Lagrange Multiplier (lag) values are significant in all cases, and particularly high for non-locals, expressing the existence of spatial dependence in the values of visitor expenditure, as suggested by the Global Moran’s Index results (). Since Robust Lagrange Multiplier (lag) is higher than Robust Lagrange Multiplier (error) in all cases, we use spatial lag models.
Table 3. Results of Ordinary Least Squares regressions: physical dimension variables as regressors.
The spatial lag variable (Lag Coefficient Rho) is indeed significant and positive in all spatial lag models of the spatial expenditure distribution (). The model for foreign visitors sees the greatest increase in its explanatory power, rising from an R2 of 0.34 in the Ordinary Least Squares model to 0.47 in the Spatial Lag Model, while the increase in R2 in the case of domestic visitors is weak (from 0.46 in the Ordinary Least Squares to 0.49 to in the Spatial Lag Model). Similarly, the elasticity of the Lag Coefficient Rho is higher for foreign than for domestic visitors, although the total expenditure of foreign visitors is less than that of national visitors. All of which indicates that foreign visitor expenditure is very much influenced by proximity between cells (spatial lag effect), while this influence is much weaker in the expenditure of domestic visitors, who tend to behave more like locals (with less clustered expenditure patterns). In fact, Lag Coefficient Rho is very low for locals.
Table 4. Results of spatial lag models: physical dimension variables as regressors.
shows the results of the Ordinary Least Squares regressions using the socio-symbolic capital variables and distance to the city centre as predictors. In all consumer groups, the determination coefficient values are higher than those obtained in the Ordinary Least Squares regressions with variables drawn from the cadastre (). The improvements are very high for visitors (with a determination coefficient rising from 0.43 to 0.68), and above all for domestic visitors (from 0.46 to 0.77). The higher determination coefficient value for visitors (0.68) than for locals (0.61) is no surprise, since the predictors drawn from Foursquare were selected to explain tourist expenditure. It is striking that simple models based on a low number of independent socio-symbolic capital variables should attain such a high explanatory power, above all in the case of expenditure by domestic visitors (0.77).
Table 5. Results of Ordinary Least Squares regression: socio-symbolic capital variables as regressors.
As would be expected, distance to the city centre has a negative sign in all regressions. The variables for the popularity of restaurants and clothing stores are highly significant for all consumer groups, and in all cases, register a positive sign. Hotels’ popularity is significant (and positive) for visitors but not for locals. The coefficients for supermarkets reveal more complex behaviour: it is significant and has a positive sign for locals, is not significant for visitors as a whole and has opposing signs for foreign visitors (negative) and for domestic visitors (positive). The positive sign obtained for locals was to be expected, since supermarket consumption focuses more on locals than on visitors. The difference in sign between foreign and domestic visitors is explained, because foreign visitors are concentrated in tourist neighbourhoods of the city centre (where fewer such establishments are to be found) and spend more than domestic ones in restaurants. Two candidate independent variables (Cinemas, theatres, shows / Museums and art galleries) do not prove significant in all the regressions.
Robust Lagrange Multiplier (error) values are significant and higher than Robust Lagrange Multiplier (lag) values in locals and national visitors, so we turn to the spatial error model for these two consumer groups and keep the spatial lag model for the rest (visitors and foreign visitors). The determination coefficient values and the AIC values indicate a better fit in the Spatial Models than in the Ordinary Least Squares regression, although these improvements are relatively weak in all cases (). All of which indicates again that foreign visitor expenditure is much influenced by proximity between cells (spatial lag effect), while this influence is much weaker in the expenditure of domestic visitors, who tend to behave more like locals.
Table 6. Results of Spatial Error Model and Spatial Lag Model: socio-symbolic capital variables as regressors.
Lastly, regressions were calculated by integrating physical dimension and socio-symbolic capital predictors, but the improved match with regard to the previous models was not significant, and so they are not shown in this paper. We may therefore conclude that the physical dimension does not add explanatory power to the socio-symbolic dimension when analyzing visitor consumption.
6. Conclusions
Research on the behaviour of visitors at tourist destinations has undergone considerable development over recent years thanks to new sources of data. A number of research studies have used social big data and data from devices to analyze the desires, presence, mobility, feelings and satisfaction of tourists in urban destinations. However, the body of research on visitor spending in urban tourism destinations has scarcely derived any benefit from the new sources of data. It is unanimously acknowledged that tourism is of substantial importance for the local economy in many cities, but there is no detailed understanding of the spatial distribution of visitor expenditure within cities, nor the factors that have the greatest influence on the uneven spatial distribution of tourist expenditure.
The paper generates new knowledge on the spatial patterns of visitor spending within urban destinations and explores for the first time the great potential of bank card transaction data to study this issue with a high level of detail, using GIS and spatial statistical tools. Bank card transaction data provide highly valuable information as to the intensity of visitor expenditure in certain parts of the city of Madrid, in particular, the city centre and the area known as the ‘Golden Mile’ (luxury shopping). Tourists spend more in the city centre, and these areas adapt to satisfy their needs. As a result, the business structure of such areas is transformed, as in the case of shops and restaurants, which have become increasingly geared to tourism. The variation coefficient, the Global Moran’s Index and the Anselin Local Moran’s I statistic indicate that, as expected, visitor spending, above all by foreign visitors, is much more spatially concentrated and clustered than spending by locals. Variation coefficient and Global Moran’s Index measure different dimensions of visitor expenditure. The first one measures the concentration of expenditure in the tiles without considering neighbouring tiles (intensity), while the second one is focused on spatial relations between tiles (spatial clustering). Anselin Local Moran’s I statistics show where and with what intensity spatial clusters and outliers of visitor spending occur. Our results are consistent with those obtained in previous research proving that in Madrid, tourists are highly concentrated in the city centre (for example, García-Palomares et al., Citation2015; Salas-Olmedo et al., Citation2018).
Interestingly, the Ordinary Least Squares and spatial regressions demonstrate that, at least in the case of Madrid, socio-symbolic capital predictors have a greater explanatory power than those expressing the physical dimension of the establishments. The physical space available in each tile for establishments in the Commerce and Hospitality categories proved significant in all models, as well as the space available for Cinemas, theatres and shows. In the case of the models based on variables drawn from Foursquare, the number of check-ins in the Restaurants, Clothing stores and Hotels proved significant, but not for the Cinemas, theatres and shows categories. The Supermarkets variable behaved differently for locals (positive sign) and tourists (not significant), but when tourists are segmented by origin, it proved to be significant for both groups of visitors, but with a different sign: negative for foreigners and positive for domestic visitors (whose consumption spatial patterns are more similar to those of locals).
The coefficients of the independent variables express the increase in expenditure (in Euros) when the independent variable increases by one unit (metres in the case of the Cadastre and check-ins in the case of Foursquare). From this point of view, hospitality establishments and clothing stores are the most influential variables of physical dimensions and socio-symbolic capital variables, respectively, in all customer groups. It implies that hospitality establishments and clothing stores are more likely to increase expenditure compared with others. For example, people usually have relatively fixed demands or consumptions in supermarkets, while they are more likely to purchase more value-added services in hospitality establishments and goods in clothing stores, and thus increase transactions and expenditure. As for cinemas, theatres, and shows, people are more likely to book online before visiting. The data set from BBVA Point of Sales terminals cannot reflect online expenditure, so that the variable of these establishments were not significant.
Three spatial trends were identified in the spatial expenditure distribution. The overall trend for expenditure to decline with distance from the centre was modelled with an independent variable, thereby improving the fit of the models. Models based on cadaster predictors show there is a local trend for spending to increase with proximity to tiles with a higher expenditure (spatial spill-overs) which could be captured with the Spatial Lag Models by means of the Rho coefficient. This coefficient was always higher within the foreign visitor group, who reveal greater spatial clustering in their spending. In models built with socio-symbolic capital variables, a high clustering degree for the residuals emerged. This trend could be captured with the Error Lag Models by means of the Lambda coefficient. Robust Lagrange Multiplier (error) was significant in all consumer groups except for foreign visitors, so we used the Spatial Error Models in these cases, obtaining weak increases in the R2 values with respect to those obtained using Ordinary Least Squares regressions. For foreign tourists, the Spatial Lag Model was used, resulting in a higher increase in the R2 value.
The paper demonstrates the great potential of bank card transaction data to analyze the spatial patterns of visitors’ expenditure in urban tourist destinations. The source of data used allows to measure, analyze and model spatial spending patterns according to the origin of the visitors, providing valuable specific outputs for tourist managers and entrepreneurs. It makes possible to identify the areas of the city that benefit the most from visitor spending. These areas are not necessarily the most crowded, in fact, the ‘Golden Mile’ registers a very high visitor expenditure, but according to other studies, it does not have a high presence of visitors (García-Palomares et al., Citation2015; Salas-Olmedo et al., Citation2018). Using this data source, it is also possible to detect new business opportunities in areas with high potential for tourism consumption, but not sufficiently exploited for tourism. Bank cards transaction data also allow inferring the degree of vulnerability of tourist consumption spaces in episodes of tourism crisis, such as the current COVID-19 pandemic. Further research can be conducted comparing 2018 and 2020 data to analyze the spatial impact of the tourism crisis caused by COVID-19 within cities, identifying the most affected areas. In addition, bank card data can be used in order to compare the spatial patterns of tourist expenditure in different cities, since previous studies demonstrated that the degree of spatial concentration of tourists varies significantly between cities (García-Palomares et al., Citation2015).
Disclosure statement
No potential conflict of interest was reported by the author(s).
Additional information
Funding
Notes
1 BBVA is the second largest Spanish bank, with 15.1% of the total business volume in the country.
2 The dataset for card transaction data at BBVA Point of Sales terminals contains a field with the country code of the bank card holder. As a result, this field can be used to know whether the card holder is Spanish or foreign, but not whether they live in the province of Madrid (local) or in some other Spanish province (domestic visitor). This data point was estimated by means of the first group of transactions (transactions with BBVA cards) registering the province of residence of the card holder. It should be borne in mind in this regard that BBVA is a high street retail bank with extensive coverage throughout the country, and with a similar market share in Madrid and across Spain as a whole, so that the proportion of expenditure by locals and domestic visitors in each tile of Madrid calculated on the basis of their cards can therefore be extrapolated to BBVA Point of Sales terminals bank card expenditure in each cell. As the group of ‘locals’ includes all inhabitants of the province of Madrid, most commuters are excluded from the domestic visitor group. It should in this regard be borne in mind that the municipality of Madrid covers 603 km2, as opposed to approximately 10,000 km2 for the province of Madrid, which guarantees that the identification of those resident in Spain as local or as domestic visitors is correct in the great majority of cases, since very few commuters travel into Madrid daily from bordering provinces.
3 The inclusion not only of tourists but also of day trippers in the calculations represents a strength of this source of data, since day trippers are not recorded in the official statistics, but contribute a substantial part of overall visitor expenditure. Segmentation between tourists and day trippers would be possible only if one had access to individual transaction data, but unfortunately the available dataset does not allow this, since it provides information aggregated by tiles.
References
- Ahas, R., Aasa, A., Mark, Ü, Pae, T., & Kull, A. (2007). Seasonal tourism spaces in Estonia: Case study with mobile positioning data. Tourism Management, 28(3), 898–910. https://doi.org/10.1016/j.tourman.2006.05.010
- Alegre, J., Mateo, S., & Pou, L. (2013). Tourism participation and expenditure by Spanish households: The effects of the economic crisis and unemployment. Tourism Management, 39, 37–49. https://doi.org/10.1016/j.tourman.2013.04.002
- Anselin, L. (2005). Exploring spatial data with GeoDaTM: A workbook. Center for Spatially Integrated Social Science.
- Arbel, A., & Pizam, A. (1977). Some determinants of urban hotel location: The tourists’ inclinations. Journal of Travel Research, 15(3), 18–22. https://doi.org/10.1177/004728757701500305
- Ayuntamiento de Madrid. (2019). Anuario de Turismo. Madrid 2018. Madrid, Madrid Destino. https://www.madrid-destino.com/turismo/anuario-turismo
- Brida, J. G., & Scuderi, R. (2013). Determinants of tourist expenditure: A review of microeconometric models. Tourism Management Perspectives, 6, 28–40. https://doi.org/10.1016/j.tmp.2012.10.006
- Cai, L. A., Hong, G. S., & Morrison, A. M. (1996). Household expenditure patterns for tourism products and services. Journal of Travel & Tourism Marketing, 4(4), 15–40. https://doi.org/10.1300/J073v04n04_02
- Carpio-Pinedo, J., & Gutiérrez, J. (2020). Consumption and symbolic capital in the metropolitan space: Integrating ‘old’ retail data sources with social big data. Cities, 106, 102859. https://doi.org/10.1016/j.cities.2020.102859
- Chen, J., Becken, S., & Stantic, B. (2021). Using Weibo to track global mobility of Chinese visitors. Annals of Tourism Research, 89, 103078. https://doi.org/10.1016/j.annals.2020.103078
- European Central Bank. (2020). Study on the payment attitudes of consumers in the euro area. https://www.ecb.europa.eu/pub/pdf/other/ecb.spacereport202012~bb2038bbb6.en.pdf
- García-Palomares, J. C., Gutiérrez, J., & Mínguez, C. (2015). Identification of tourist hot spots based on social networks: A comparative analysis of European metropolises using photo-sharing services and GIS. Applied Geography, 63, 408–417. https://doi.org/10.1016/j.apgeog.2015.08.002
- Gotham, K. (2005). Tourism gentrification: The case of New Orleans’ Vieux carre (French quarter). Urban Studies, 42(7), 1099–1121. https://doi.org/10.1080/00420980500120881
- Gutiérrez, J., García-Palomares, J. C., Romanillos, G., & Salas-Olmedo, M. H. (2017). The eruption of Airbnb in tourist cities: Comparing spatial patterns of hotels and peer-to-peer accommodation in Barcelona. Tourism Management, 62, 278–291. https://doi.org/10.1016/j.tourman.2017.05.003
- Hall, C. M., & Page, S. (2003). Managing urban tourism. Prentice Hall.
- Hall, C. M., & Page, S. J. (2014). The geography of tourism and recreation: Environment, place and space. Routledge.
- Jang, S. S., & Ham, S. (2009). A double-hurdle analysis of travel expenditure: Baby boomer seniors versus older seniors. Tourism Management, 30(3), 372–380. https://doi.org/10.1016/j.tourman.2008.08.005
- Jin, C., Cheng, J., & Xu, J. (2018). Using user-generated content to explore the temporal heterogeneity in tourist mobility. Journal of Travel Research, 57(6), 779–791. https://doi.org/10.1177/0047287517714906
- Li, H., Hu, M., & Li, G. (2020). Forecasting tourism demand with multisource big data. Annals of Tourism Research, 83, 102912. https://doi.org/10.1016/j.annals.2020.102912
- Li, J., Xu, L., Tang, L., Wang, S., & Li, L. (2018). Big data in tourism research: A literature review. Tourism Management, 68, 301–323. https://doi.org/10.1016/j.tourman.2018.03.009
- Lin, V. S., Mao, R., & Song, H. (2015). Tourism expenditure patterns in China. Annals of Tourism Research, 54, 100–117. https://doi.org/10.1016/j.annals.2015.07.001
- Martí, P., García-Mayor, C., & Serrano-Estrada, L. (2021). Taking the urban tourist activity pulse through digital footprints. Current Issues in Tourism, 24(2), 157–176. https://doi.org/10.1080/13683500.2019.1706458
- Martí, P., Serrano-Estrada, L., & Nolasco-Cirugeda, A. (2019). Social media data: Challenges, opportunities and limitations in urban studies. Computers, Environment and Urban Systems, 74, 161–174. https://doi.org/10.1016/j.compenvurbsys.2018.11.001
- Mihalic, T. (2002). Tourism and economic development issues. In R. Sharpley & D. Telfer (Eds.), Tourism and development: Concepts and issues (pp. 81–111). Clevedon, UK: Channel View Publications.
- Nicolau, J. L., & Más, F. J. (2005a). Stochastic modeling: A three-stage tourist choice process. Annals of Tourism Research, 32(1), 49–69. https://doi.org/10.1016/j.annals.2004.04.007
- Nicolau, J. L., & Más, F. J. (2005b). Heckit modelling of tourist expenditure: Evidence from Spain. International Journal of Service Industry Management, 16(3), 271–293. https://doi.org/10.1108/09564230510601404
- Park, S., Xu, Y., Jiang, L., Chen, Z., & Huang, S. (2020). Spatial structures of tourism destinations: A trajectory data mining approach leveraging mobile big data. Annals of Tourism Research, 84, 102973. https://doi.org/10.1016/j.annals.2020.102973
- Parlett, G, Fletcher, J. & Cooper, C. (1995). The impact of tourism on the Old Town of Edinburgh. Tourism Management, 16(5), 355–360.
- Pearce, D. G.. (1987). Tourism today: A geographical analysis. Burnt Mill: Longman.
- Raun, J., Ahas, R., & Tiru, M. (2016). Measuring tourism destinations using mobile tracking data. Tourism Management, 57, 202–212. https://doi.org/10.1016/j.tourman.2016.06.006
- Roick, O., & Heuser, S. (2013). Location based social networks – definition, current state of the art and research agenda. Transactions in GIS, 17(5), 763–784. https://doi.org/10.1111/tgis.12032
- Russo, A. P. (2002). The “vicious circle” of tourism development in heritage cities. Annals of Tourism Research, 29(1), 165–182. https://doi.org/10.1016/S0160-7383(01)00029-9
- Salas-Olmedo, M. H., Moya-Gómez, B., García-Palomares, J. C., & Gutiérrez, J. (2018). Tourists digital footprint in cities: Comparing Big Data sources. Tourism Management, 66, 13–25. https://doi.org/10.1016/j.tourman.2017.11.001
- Saluveer, E., Raun, J., Tiru, M., Altin, L., Kroon, J., Snitsarenko, T., Aasa, A., & Silm, S. (2020). Methodological framework for producing national tourism statistics from mobile positioning data. Annals of Tourism Research, 81, 102895. https://doi.org/10.1016/j.annals.2020.102895
- Sobolevsky, S., Bojic, I., Belyi, A., Sitko, I., Hawelka, B., Arias, J. M., & Ratti, C. (2015, June). Scaling of city attractiveness for foreign visitors through big data of human economical and social media activity. In 2015 IEEE International Congress on Big Data (pp. 600–607). IEEE.
- Sobolevsky, S., Sitko, I., Des Combes, R. T., Hawelka, B., Arias, J. M., & Ratti, C. (2014a, June). Money on the move: Big data of bank card transactions as the new proxy for human mobility patterns and regional delineation. The case of residents and foreign visitors in Spain. In: 2014 IEEE international congress on big data (pp. 136–143). IEEE.
- Sobolevsky, S., Sitko, I., Grauwin, S., Des Combes, R. T., Hawelka, B., Arias, J. M., & Ratti, C. (2014b). Mining urban performance: Scale-independent classification of cities based on individual economic transactions. In Big data science and computing, 2014 ASE international conference on May 27e31 (p. 10). Stanford University.
- Turespaña. (2018). Informe Anual 2018. Pasarelas de pago. Operaciones realizadas en España con tarjetas bancarias extranjeras. https://www.tourspain.es/es-es/ConocimientoTuristico/InformesPasarelasPago/Pasarelas%20de%20Pago%20-%20Informe%20Anual%202018%20(definitivo).pdf
- Van der Borg, J., Costa, P., & Gotti, G. (1996). Tourism in European heritage cities. Annals of Tourism Research, 23(2), 306–321. https://doi.org/10.1016/0160-7383(95)00065-8
- van Loon, R., & Rouwendal, J. (2017). Travel purpose and expenditure patterns in city tourism: Evidence from the Amsterdam Metropolitan area. Journal of Cultural Economics, 41(2), 109–127. https://doi.org/10.1007/s10824-017-9293-1
- Vu, H. Q., Li, G., Law, R., & Zhang, Y. (2018). Tourist activity analysis by leveraging mobile social media data. Journal of Travel Research, 57(7), 883–898. https://doi.org/10.1177/0047287517722232
- Wang, Y., & Davidson, M. C. (2010). A review of micro-analyses of tourist expenditure. Current Issues in Tourism, 13(6), 507–524. https://doi.org/10.1080/13683500903406359
- Weaver, A. (2008). When tourists become data: Consumption, surveillance and commerce. Current Issues in Tourism, 11(1), 1–23. https://doi.org/10.2167/cit338.0
- Yang, X., Pan, B., Evans, J. A., & Lv, B. (2015). Forecasting Chinese tourist volume with search engine data. Tourism Management, 46, 386–397. https://doi.org/10.1016/j.tourman.2014.07.019
- Zheng, B., & Zhang, Y. (2013). Household expenditures for leisure tourism in the USA 1996 and 2006. International Journal of Tourism Research, 15(2), 197–208. https://doi.org/10.1002/jtr.880