
ABSTRACT
The purpose of this study is to investigate what type of Facebook posts help cruise lines build bridging and bonding social capital. The study applies the Chi-Square Automatic Interaction Detection (CHAID) method to identify which types of posts establish bridging and bonding social capital. The analysis is conducted on an international cruise line’s official Facebook posts posted between 1 January 2018 and 1 January 2020 before the Covid-19 pandemic. The results highlight that media type, embedding passenger motivation, and a ship image help establish both bridging and bonding social capital, while content type helps establish bridging social capital. The paper is original because it helps understand how cruise lines can improve bonding and bridging social capital via social media. The paper also enhances understanding of social capital theory in the travel industry by investigating the relationship between Facebook post types and social capital in cruise shipping.
1. Introduction
Digital platforms, including social network sites (SNSs), have altered the communication between consumers and brands from one-way to bidirectional interactions (Denktaş-Şakar & Sürücü, Citation2020). SNSs such as Facebook, Twitter, and LinkedIn are well-known sites and considered vital marketing platforms for companies. Barnes et al. (Citation2020) indicated that 95% of the Fortune 500 companies actively use Facebook. While companies use SNSs for such tasks as advertising their product and services, sharing the latest information, interacting with their customers, enhancing their reputation, and undertaking marketing research, users utilize SNSs for networking, creating content, and gathering information about brands.
The use of SNSs is prevalent in tourism. SNSs in the tourism sector are used by tourists for holiday planning, accessing tourism information, choosing holiday destinations and sharing travel experiences (Gon, Citation2020). The research also shows that SNS usage significantly affects travellers’ holiday types and destination choices (Narangajavana et al., Citation2017). Accordingly, organizations in the travel and tourism industry extensively use SNSs to reap the benefits of SNSs’ interactive nature. By effectively using SNSs, travel and tourism organizations can enhance their destination marketing, maximize customer engagement, and secure travellers’ loyalty, thereby increasing sales (Yost et al., Citation2021).
Cruise lines are active users of SNSs. Eighty-two percent of the Cruise Lines International Association (CLIA, Citation2019) global cruise line members have Facebook pages.. Cruise tourism (CT) deserves a particular attention while studying SNSs as it involves combination of travelling, city and shore excursions, accommodation, recreational activities, dining, and onboard entertainment (Sun et al., Citation2011). Thus, it attracts tourists with both transportation, destination, accommodation, and entertainment motives (Niavis & Tsiotas, Citation2018). This multidimensionality of CT is also reflected in cruise travellers’ service perceptions which is affected by different range of elements such as ships, entertainment, excursion, port, room, food, and embarkation (Arasli et al., Citation2020). Cruise travellers are also distinct from other tourists because, alongside all tourism dimensions, ships themselves play a major role in their experience (Kwortnik, Citation2008). Cruise travellers are also considered as a distinct type of tourist segment having their own virtual communities due to peculiarities of cruise tourism (Roth-Cohen & Lahav, Citation2021).
Number cruise travellers increased rapidly until COVID-19 that it increased from 17.8 million in 2009–28.5 million in 2018, which is expected to exceed 30 million by the end of 2019 (CLIA, Citation2019). However, another peculiarity of CT is that, sailing overseas and visiting multiple destinations, CT is severely affected by both local and global disruptions such as weather conditions, natural disasters, and pandemics. For instance, COVID-19 has impacted the entire tourism industry The tourist psyche is negatively impacted by COVID-19 (Kock et al., Citation2020). However, its impact on the cruise industry is particularly remarkable (Choquet & Sam-Lefebvre, Citation2021). Several tourism studies also indicate the negative impacts of COVID-19 on the cruise travel industry and the perceptions of passengers (Pan et al., Citation2021; Roth-Cohen & Lahav, Citation2021). Furthermore, the industry is regularly challenged by pressure on corporate social responsibility due to air pollution and over-tourism (Rodrigue & Wang, Citation2021; Seraphin et al., Citation2018). Management of these diverse challenges requires cruise lines to be well-connected to their stakeholders, extend their network, and enhance the relationship intensity. These network extension and relationship enhancement efforts can be considered the social capital (SC) building process of cruise lines.
SC – which refers to benefits received from relationships between people and groups (Lin, Citation2017) – is a vital asset for individuals and business organizations (Kim et al., Citation2019). It can be built both through offline and online connections. SNSs offer significant opportunities for cruise lines to efficiently and effectively improve their SC. The use of SNSs to build SC has been well documented in previous studies (Abuljadail & Ha, Citation2019; Sias & Duncan, Citation2020). However, despite some scholarly papers discussing SNSs in the cruise sector (Roth-Cohen & Lahav, Citation2021; Satta et al., Citation2018), forming SC in cruise travel through SNSs has not been analyzed.
Prior research in other sectors has demonstrated that receiving user actions such as liking and re-sharing influences organizations and individuals’ SC building efforts (Horng & Wu, Citation2020). Hence, it is of significant importance to figure out what type of posts trigger more reactions from the network. Moreover, the literature suggests that SNS users’ liking and re-sharing attitudes are not identical (Satta et al., Citation2018; Surucu-Balci et al., Citation2020; Villamediana-Pedrosa et al., Citation2019). Thus, it is also critical to identify whether the same or different posts trigger more liking and re-sharing.
Motivated with social capital theory (SCT), this paper focuses on one particular SNS, Facebook, and aims to investigate what type of Facebook posts help cruise lines extend their network and improve their network engagement. More specifically, this research aims to identify Facebook posts that enable cruise lines to build bonding social capital (BOSC) and bridging social capital (BRSC) with their network. To do this, a Chi-Square Automated Interaction Detection (CHAID) method is applied on Facebook posts of a leading global cruise line. The liking of the cruise line's Facebook posts is considered as the reflection of BRSC, whereas the re-sharing is considered as the reflection of BOSC. This paper has novelty because it helps understand how cruise lines can improve their BOSC and BRSC via Facebook, which has not been investigated to the authors’ best knowledge. Considering the recent COVID-19 and common challenges the cruise lines face, this paper's results present meaningful implications for the industry. The paper also enhances the understanding of SCT by revealing Facebook posts’ effect on BOSC and BRSC separately.
2. Literature review
2.1. Social capital through social network sites
SC exists in the relationships among persons and organizations (Coleman, Citation1988) and consists of social ties between people and benefits achieved from social participation (Teng, Citation2018). SC creates close relationships and strengthens communication (Ali et al., Citation2019). To maintain SC, social interactions and networks must be continuing. The SCT is implemented on various levels of individual and organizational context. The theory is also applied in the tourism literature. For instance, Zhao et al. (Citation2011) used SCT to investigate why some residents in certain areas preferred to establish and operate tourism businesses. Kim and Shim (Citation2018) highlighted the structural relationship among SC, innovation, and the performance of small and medium-sized enterprises in a tourism cluster. McGehee et al. (Citation2010) examined tourism-related SC and its relationships with other capital forms, including cultural, natural, political, human, and financial capital.
Putnam (Citation2000) classified social capital as bridging (identified as weak ties) and bonding (identified as strong ties). The connections between people with different backgrounds form BRSC. Hence, BRSC represents weak ties or acquaintances (Ali et al., Citation2019). BRSC enables one to gain new perspectives and expand social horizons (Ellison et al., Citation2007). On the other hand, the relations between people who share similar characteristics or social identity form BOSC. BOSC represents strong ties or close relationships (Ali et al., Citation2019). BOSC enables inward growing and dense relations (Ellison et al., Citation2007).
With the rise of Internet usage, SNSs are stepping forward as essential communication tools that help establish and maintain SC (Steinfield et al., Citation2009). SNSs gather people having similar interests, views, and goals and allow users to exchange ideas, opinions, and comments. These exchanges, including interpersonal relationships and organizational networks, are primary SC sources (Lin, Citation2017). Williams (Citation2006) ascertains that BRSC and BOSC can be established in the online context. Different parties can build networks, which might be broad but weak, with little online effort. These efforts help to establish BRSC. Similarly, different parties can develop a sense of belongings to networks, establish healthy relationships, and get emotional benefits. These efforts help to establish BOSC.
SNSs such as Facebook make simultaneous interaction accessible between users and organizations. As a result, the information flow between users and organizations substantially increases. High utilization of SNSs enables the creation of UGC and engagement with the organization. This creation and engagement are generated with users’ activities such as ‘share,’ ‘comment,’ and ‘like’ (Dolan et al., Citation2016). Although these three options contribute to social network engagement, they are different from each other and symbolize the different levels of user commitment and effort (Swani & Labrecque, Citation2020).
‘Like’ and recently added reactions (love, care, haha, wow, sad, angry) on Facebook are the most commonly used engagement option. However, they symbolize the lowest level of engagement action (Swani et al., Citation2017). ‘Like’ requires only one click and is effortless and spontaneous (Shen & Bissell, Citation2013). In other words, ‘Like’ establishes the lowest ties between the user and the organization. ‘Comment’ involves further steps than ‘Like’ because, in order to comment, the user needs to click the comment button first and then type the message and click to send it. ‘Comment’ engagement action is slow, reflective, and intended (Swani et al., Citation2017). Similar to ‘Comment,’ ‘Share’ also requires additional steps. When a post is shared, it can be shared directly to the user’s news feed or in a private, personalized message (Swani & Labrecque, Citation2020).
‘Share’ is the only engagement option that gives the opportunity in all SNSs for disseminating the organization’s post on the user’s timeline. Kim and Yang (Citation2017) argue that most of the time, users prefer the ‘Share’ option when the user wants/feels to express himself/herself in the same way as the brand. Thus, the ‘Share’ engagement option establishes the most substantial ties between the user and the organization. With users’ engagement activities, SNSs establish and make visible the hidden ties between users and organizations. Thus, SNSs generate and maintain strong and weak ties simultaneously (Ellison et al., Citation2007).
Adopting BRSC and BOSC to the social networking engagement context, this study considers the ‘like’ action as the BRSC while defining the ‘share’ action as the BOSC. In most cases, to share positive feedback, support, joy, or empathy, users utilize the ‘like’ action (Lee et al., Citation2016). Since the ‘like’ action is the simplest way to maintain the relationship, users prefer the ‘like’ function to keep weak ties without additional effort. The ‘share’ action is considered the highest engagement level considering the user reactions (Song et al., Citation2020) because when a user shares content, it also appears on the user’s wall and news feed, and the user’s friend can also see the shared post. Kim and Yang (Citation2017) highlight that sharing the post is related to self-identity presentation, emphasizing that the users found something from themselves in the previously shared post and shared their wall. Thus, sharing another’s post indicates strong ties.
2.2. Effect of post characteristics on bridging and bonding social capital
Earlier studies revealed that post characteristics impact the number of user activities. In other words, the number of likes and shares are significantly affected by the post’s features such as the media type (MT), the content type (CT), and the length of the post (Denktaş-Şakar & Sürücü, Citation2020; Luarn et al., Citation2015; Surucu-Balci et al., Citation2020). Since this study mirrors the number of likes as BRSC and the number of shares as BOSC, it is argued that the characteristics of posts determine the level of BRSC and BOSC.
MT and CT are commonly used post features that are predictors of BRSC and BOSC. In parallel to this, the tourism and hospitality literature also indicates that different MTs lead to different levels of engagement. Villamediana-Pedrosa et al. (Citation2019) found that the number of shares among Facebook users regarding tourist destinations is higher when a video is included in the post. Kucukusta et al. (Citation2019) revealed that visual content significantly increases engagement in the hospitality context. Su et al. (Citation2015) revealed that photos could boost the number of sharing. In the cruise tourism context specifically, Satta et al. (Citation2018) highlighted that posts that include videos receive more likes and shares. Similar to MT, CT also impacts the engagement level. For instance, Kucukusta et al. (Citation2019) demonstrated that informative posts have the highest level of engagement. Pino et al. (Citation2019) found that emotional posts trigger the engagement level in the tourist destination. Satta et al. (Citation2018) revealed that emotional content positively impacts the number of likes and shares.
Several studies indicate that the messages’ length impacts the engagement level (De Vries et al., Citation2012). For instance, Surucu-Balci et al. (Citation2020) indicated that the length of Twitter messages significantly affects the engagement of container shipping stakeholders; while, Pino et al. (Citation2019) highlighted that the number of likes decreases as the message's length increases. Satta et al. (Citation2018) revealed that the longer the post, the less the received engagement reactions. On the other hand, Villamediana-Pedrosa et al. (Citation2019) found that the post's length does not affect the number of likes and shares.
Besides generic predictors of user engagement, cruise travel-specific post characteristics can also affect the number of likes and shares as cruise travel involves peculiar characteristics. For instance, we argue that the existence of a ship image may influence the BRSC and BOSC. Hung and Petrick (Citation2011) identified that some passengers describe themselves as sea fetish and enjoy being on the ship or see the ship other times. The ship is the most crucial tangible resource (the most impressive image) of the cruise lines, and they frequently share photos or videos of their ships. A study conducted on cruise passengers’ Tweets revealed that ship is one of the most frequently used words in cruise-related tweets (Park et al., Citation2016).
Passengers may have various motivations for their cruise travels, and SNS posts with different motives may lead to the different levels of SC. This argument is also confirmed by Park et al. (Citation2016), who found that motivation-related tweets can get more interaction from cruise travellers. Having entertainment options both onboard and at the shore, having facilities for relaxation, discovering new places, cost of travel, socializing with other passengers, and loyalty appear to be primary motivators of the cruise travelling.
3. Methodology
This study applies CHAID to classify Facebook posts by utilizing dependent and independent variables. We explain sampling and data collection, variables and coding, and the CHAID method in this section.
3.1. Sampling and data collection
As of October 2020, Facebook is the fifth commonly visited web page globally (Alexa, Citation2020). With 2.7 billion monthly active users and an average of eighteen minutes fifty-three seconds daily time spent on site, Facebook is the biggest SNS worldwide (Statista, Citation2020). This makes Facebook an important channel for organizations to advertise, enhance their brand attractiveness and engage with consumers.
The study focused on a global cruise line’s Facebook. The number of fans in Facebook changes variably for each cruise line. For instance, a cruise line has 121,543 followers, while the another line has 5,030,845 followers. This significant difference has led to focus on one cruise line in this study. Thus, we focused on a global cruise line with one of the highest number of Facebook followers. The data was collected in November 2020. We manually collected Facebook posts of the selected cruise line between 1 January 2018 and 1 January 2020. A total of 633 Facebook posts were collected.
Data bias should be carefully handled in SNS studies when collecting the data (Morstatter & Liu, Citation2017). The bias may occur due to the uneven distribution of users’ profiles in terms of their age, gender, etc., language differences in posts, and doubtful or incomplete information that may be shared by some users (Wang et al., Citation2020). Data bias issue is handled by several approaches in our study. First, we focused on a single cruise line’s Facebook page to eliminate the heterogeneity in the number of users among lines, which might significantly affect the number of likes and shares regardless of post characteristics. Second, the selected line’s all posts were shared in English; thus, no heterogeneity exists regarding the language of the post. Third, the data is collected and coded manually by two researchers, and the inter-reliability is measured, as explained in the following section, to mitigate discrepancies in data.
3.2. Data coding
We employed De Vries et al. (Citation2012)’s and Luarn et al.'s (Citation2015) data coding protocol while coding the selected cruise line’s Facebook posts. One of the authors and another researcher, who does not know the studies’ assumptions, coded the selected cruise line company’s posts between 1 January 2018 and 1 January 2020 separately, after receiving 60 min of training about the coding procedure. After completing the coding, results were compared, and in case conflict occurs, coders discussed the post and reached a consensus about the coding. Also, we calculated inter-coder reliability using Perreault and Leigh’s (Citation1989) method to assess the degree of agreement among coders. According to Perreault and Leigh (Citation1989), inter-coder reliability should be between 0.8-1.0, and this study's inter-coder reliability is calculated as 0.85. In this study, we utilized six independent variables and two dependent variables.
3.2.1. Independent variables
This study postulates that BRSC and BOSC in cruise travel can be affected by posts’ MT, CT, message length, the existence of a ship image, and type of cruise travel motivation. MT consists of three categories, which are ‘video,’ ‘gif,’ and ‘photo.’ Thus, if a post includes a photo, it is coded as ‘photo.’ For instance, the post, which was shared on 1 January 2020, included a photo. Thus, the post was coded as the photo for MT. On 18 December 2018, the selected cruise line shared a gif. Hence, this post was coded as a gif. The selected cruise line shared a video on 10 January 2018. Therefore, it was coded as video.
‘Emotional’ and ‘functional’ are the GT categories. If the cruise line celebrates a special day such as fests, New Year, mothers’ day, fathers’ day, it is coded as emotional. For instance, on 26 November 2019, the selected cruise line shared a post to celebrate its followers’ Thanksgiving. Thus, this post was coded as emotional. When the cruise line posts about one of their ships’ travel destinations and day information, it is coded as functional. For instance, on 6 July 2018, the cruise line shared a post about their ship’s trip to Grand Turk Islands. Thus, this post was coded as functional.
‘Relaxation,’ ‘fun,’ ‘exploring new things (doing something new),’ ‘socializing,’ ‘being cost-sensitive,’ ‘loyalty,’ and ‘convenience’ consist of the passenger motive categories. If the cruise line shares a post while passengers have fun on the deck, it is coded as entertainment. For instance, on 10 February 2018, the cruise line shared a post where passengers were dancing with the animation team. This post was coded as entertainment. If the cruise line shares a post while their passengers are zip lining, it is coded as exploring new things. For example, on 30 October 2019, the cruise line shared a video where passengers were zip-lining in travel destinations. This post was coded as exploring new things. The length of the post message is calculated by counting the total characters in each post, and the data is input as a continuous metric variable to the CHAID analysis.
3.2.2. Dependent variables
We have two dependent variables in this study, which are BRSC and BOSC. In this study, the BRSC is measured with the number of likes for each post received. Thus, the number of likes for each post was coded as BRSC. The BOSC is measured with the number of shares received for each post. Hence, coders were coded the number of shares per post as BOSC.
3.3. CHAID method
This paper aims to explore cruise lines’ Facebook post characteristics that generate a higher number of likes and shares and to compare whether predictors of these two dependent variables differ or not. We have chosen CHAID methodology, a decision tree method used for classification and prediction purposes. First developed by Kass (Citation1980), CHAID method splits the whole dataset into homogenous subgroups based on the relationship between independent variables and the dependent variable, or the criterion variable, in other words. The method finds out distinct sub-groups of the total sample regarding the criterion variable. With these characteristics, CHAID is an ideal method in our study. The method can find cruise lines’ SNS engagement predictors that reveal distinct post groups related to the number of likes and shares.
Since our purpose is to find out and compare predictors of BRSC (number of likes) and BOSC (number of shares) in SNS, two separate CHAID analyses are conducted as the method classifies objects based on only one dependent variable at each time. Despite the obstacle of employing multiple dependent variables, CHAID is still the ideal option for this study for several reasons. First, it can employ several independent variables, which can be both categorical and continuous. The ability to utilize both types of data as independent variables makes CHAID ideal for finding more engaging SNSs’ post characteristics, categorical and numeric. Second, CHAID partitions the sample into sub-samples by identifying the most significant predictor based on the interaction with the criterion variable (Díaz-Pérez & Bethencourt-Cejas, Citation2016). The CHAID algorithm then splits sub-groups into their sub-groups by determining each step's most significant predictor variable. This process lasts until no predictor partitions those sub-groups into further sub-groups. This characteristic of the CHAID method allows us to compare predicting – partitioning, in other words – variables of two different dependent variables in our study (number of likes and shares).
The total sample in CHAID is called the root node displayed at the top of the tree. Those partitioned nodes are named as parent nodes if they are also further split into sub-groups. When no partition exists, the final node is called the child node. Just like independent variables, the criterion variable in CHAID can be both categorical and continuous. In our study, both criterion variables are continuous in those two different CHAID analyses. Same independent variables are entered in both analyses to be able to make the proper comparison. The significance level to split the posts of the sampled cruise line is set to be 0.05. The parent/child node ratio is adjusted as 30/15, which means the minimum sample size of a parent node can be 30 while it can be 15 for a child node. The maximum number of tree branch levels is set to five so that no more nodes will be created after both trees reach a total of five layers.
The CHAID methodology is used in several tourism and travel segmentation studies, which indicates its success in classification based on prediction in the tourism industry (do Valle et al., Citation2012; Legohérel et al., Citation2015; and Díaz-Pérez et al., Citation2020). The strength of CHAID over other classification and prediction techniques in the tourism context has also been demonstrated by the study of Díaz-Pérez and Bethencourt-Cejas (Citation2016). However, to the authors’ best knowledge, none of the papers in tourism research has employed the method for SNSs, although it is quite appropriate for the usage of CHAID considering the size and variety of data available in SNSs.
4. Results
4.1. Descriptive results
The results of the Facebook posts of the selected cruise line show that the average number of likes is 2006.6, while the average number of re-sharing is 364.7 (N = 631). Regarding independent variables, 38.8% of posts include cruise ship images in photos or videos, while 61.2% do not have any ship image. As shown in , almost 60% of posts are shared with a photo, while around 17% include a video, and almost 25% of posts included a gif. Regarding the CT, 43% of posts include emotional content, while 53% have functional content.
Table 1. Frequencies of the media type and content type.
illustrates that 37% of sampled Facebook posts have fun-related passenger motivation. This percentage is followed by relaxation motivation with the rate of 21%. The third most frequent passenger motivation is about socializing. The least two frequent motivations in sampled Facebook posts are cost and loyalty with 1.1% and 2.4% ratios. Our sample's mean value of post length is 123.7 characters with a maximum value of 535 and a minimum value of 0 (a total of 15 posts do not have any text message).
Table 2. Frequencies of passenger motivation.
4.2. CHAID results
Two CHAID trees were built based on two dependent variables: Number of likes and number of re-shares. Regarding the number of likes, which illustrates BRSC, passenger motivation, the existence of a ship image, CT, and MT significantly partitioned posts into sub-groups (see ). These four variables are also considered as determinants of the number of likes. Among four variables, passenger motivation is the most significant predictor of the number of likes as it is the first independent variable splitting the sample. Posts including relaxation and convenience motivations attract significantly higher likes of the cruise line’s followers than other motivations. These two parent nodes (Node 1 and Node 2) are further split into sub-groups by the MT of posts, which is the second most significant predictor of the number of likes. In both partitions, gif posts have significantly fewer likes than posts with videos and photos. This is demonstrated in as Node 4 and Node 6 likes are significantly lower than Node 3 and Node 4, respectively. Three of these four nodes are further split into different nodes by the existence of a ship image and CT. The existence of a ship is the third most significant predictor of the number of likes. Existence of a ship image partitions Node 3 and Node 6 into sub-groups. In both groups, the posts with a ship image (Node 7 and Node 11) lead to a higher number of likes. On the other hand, CT partitions Node 5 into two subgroups (Node 9 and Node 10), among which emotional posts have a significantly higher number of likes compared to functional posts.
Figure 1. Number of likes CHAID decision tree.
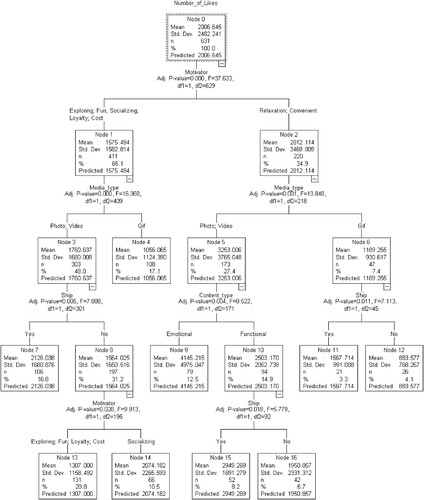
A total of seven parent nodes (Nodes 1, 2, 3, 5, 6, 8, and 10) and a total of nine child nodes (Nodes 4, 7, 9, 11, 12, 13, 14, 15, and 16) are achieved in the tree of the number of likes. Node 9 consists of posts with relaxation and convenience motivations, including photos or videos as the MT, and emotional content has the highest number of likes. The second-highest number of likes is Node 15, which consists of posts with relaxation and convenience, including photos or videos as MTs, but with functional content including a ship image. The third highest likes are received by Node 7, which involves posts with motivations other than relaxation and convenience, including photos or videos with ship images. Node 14 has the third-highest number of likes among all child nodes. This shows that when posts do not have any ship photo or video, socializing motivation attracts more likes than other motivations. Node 12, on the other hand, has the lowest level of liking among all child nodes. This group of posts contains gif shares without any ship image and has relaxation and convenience motivations. The second-lowest number of likes belongs to Node 4, which again includes GIFs and other types of motivations than Node 12 .
Figure 2. Number of shares CHAID decision tree.
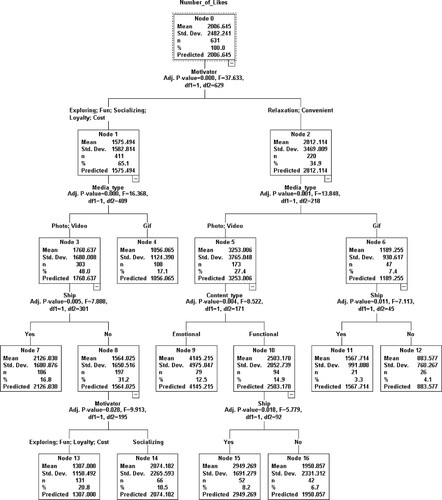
Regarding the number of re-sharing of the post or BOSC in SNSs, the same independent variables partition the total sample, except the CT, which does not create any group in re-sharing. The most significant predictor of the number of re-sharing is the MT. Posts with videos are shared significantly higher than posts with photos and gifs. The average sharing score of video posts (Node 2) is 766, while photo and gif posts (Node 1) are 284. The existence of a ship is the second-best predictor of the number of re-sharing as it partitions Node 1 into two different sub-groups. Accordingly, posts with a ship image lead to significantly higher re-sharing than those without a ship image. The last partition is done by passenger motivation, which splits those photo and gif posts without a cruise ship image.
The decision tree of the number of re-sharing has created two parent nodes (Node 1 and Node 4) and five child nodes (Node 2, 3, 5, 6, and 7). Among child nodes, Node 2 has the highest number of re-sharing. This node (n = 105) consists of videos and is not further partitioned into sub-groups. The second-highest number of re-sharing is Node 7, which includes photo and gif posts without a ship image and convenience motivation. However, this group of posts’ population is also the smallest, having only 2.4% of all samples. Node 3, on the other hand, is the largest child node having a total of 207 posts (32.8% of the sample) and has the third-highest number of re-sharing with a mean score of 402. This node consists of photo and gif posts with a cruise chip image. The lowest re-sharing score is Node 6, consisting of photo and gif posts without a ship image and fun and loyalty motivations.
5. Discussion
This paper indicates that cruise lines’ SC building through SNSs is significantly affected by post characteristics. The majority of our assumptions are approved as a total of three independent variables successfully partitioned the total dataset. These variables are MT, passenger motivation, and the existence of a ship image. CT, on the other hand, only partitions the dataset in the number of likes. The length of the message does not have any influence on BOSC or BRSC.
According to results, the number of liking has more partitioning independent variables compared to the number of re-sharing. The tree of liking is also a lot larger than the tree of re-sharing, the former has nine child nodes while the latter has five. In other words, there are more distinct sub-groups of Facebook posts while forming BRSC. This result indicates that the liking attitude of followers is more heterogeneous than the re-sharing attitude. This result in building social capital reflects that Facebook posts’ characteristics affect BRSC more than BOSC. This result makes sense because in BRSC, weak ties occur between followers and the cruise line. Instead of liking the post regardless of their characteristics, followers’ liking attitude is more determined by post characteristics. Post characteristics also determine the re-sharing attitude; however, since stronger ties occur between followers and the cruise line, posts’ characteristics have less impact on re-sharing attitude. These assumptions, of course, need further validation.
Although similar independent variables partition both liking and re-sharing of posts, the significant level of these variables vary in liking and re-sharing. The first significant splitting variable in liking is passenger motivation, while it is MT in re-sharing. According to CHAID results, posts that include relaxation motivators play a vital role in establishing BRSC compared to other motivators, such as exploring fun, socializing, loyalty, and cost. As Park et al. (Citation2016) found that motivation-related posts receive more interaction, we expected this result. Since relaxation is one of the primary motivators of cruising, posts with a relaxation motive receive more engagement and form BRSC.
CHAID results demonstrate that convenience motivator leads to establishing both BRSC and BOSC. Unlike other types of tourism, cruise tourism offers many opportunities such as transportation, accommodation, entertainment, etc., at the same time. This convenience is an important factor while preferring cruise tourism, and the results showed that the followers also interact more when they see such posts.
The MT of the posts also significantly partitioned the posts regardless of the type of motives. In both cases, photo and video posts boost the number of likes more than the posts with GIFs. In other words, posts that include photos and videos can be utilized to form BRSC. This result is consistent with Kucukusta et al.'s (Citation2019) findings, suggesting that embedding visual content increases engagement. Followers can like and move on to the next post after glimpsing at the photo or briefly browsing the video. The purpose of such action is to show their support to the company. Furthermore, since the number of likes mirrors weak ties, this result is quite logical.
Regarding BOSC, CHAID results show that video posts receive more shares than photo and gif posts. To put it in another way, cruise lines must share posts, including videos, to create BOSC. This result concurs with the study of Satta et al. (Citation2018), who also found that video posts increase the number of shares. Our results also support the findings of Villamediana-Pedrosa et al. (Citation2019), who found that posts that include video receive more share action.
The fact that video posts receive more shares is quite logical because the follower shares the video only when he/she finds something of himself or has a similar experience, which is shown in the video. Posts embedded video transmit the message more quickly. Video posts tend to be more entertaining, informative, and have emotional content, while transmitting the message takes longer. Re-sharing the video post means that the follower watches the video, receives the message, and has similar experiences or feelings, and that is why he/she decides to share it on their Facebook wall. Thus, sharing video posts reinforces the ties between cruise lines and followers.
Among the photo and video posts that embedded relaxation and convenience motivators, the CT has a parting effect on posts. According to CHAID results, emotional posts receive more likes than functional posts; in other words, emotional posts can be used to establish BRSC. Similar to the findings of Pino et al. (Citation2019) and Satta et al. (Citation2018), CHAID results revealed that emotional posts positively influence BRSC. One possible explanation for this finding might be that messages with emotions trigger followers’ attention, leading to liking posts. However, the CT does not create any sub-group of posts in re-sharing, or the CT does not make any difference while establishing BOSC.
Among the photo and video posts that embedded exploring, fun, socializing, loyalty, and cost motivators, the image of ship splits the dataset. Accordingly, posts that include ship images help to establish BRSC. Furthermore, among the posts with photos and GIFs, having a ship image partition the received number of likes. Thus, posts that include a ship image are more shared than posts that do not have a ship image. Hence, based on the study results, posts with ship images help establish BRSC and BOSC. Our results validate Lobo's (Citation2008) statement, which suggests that cruise passengers started to pay more significant emphasis on their cruise ship experience rather than those destinations the ship calls. Lobo's (Citation2008) suggestion probably explains that passengers like and share posts with cruise ship images. These results show that customized solutions are needed for these two types of SC tools through SNSs. Thus, SNSs or marketing managers of cruise lines are suggested to follow a differentiated posting strategy for BRSC and BOSC.
Length of post message does not affect user reactions in our dataset. This result is similar to Villamediana-Pedrosa et al. (Citation2019), who found that message length does not matter. However, the result contradicts the findings of Pino et al. (Citation2019) and Satta et al. (Citation2018). This result shows that the literature does not reach a consensus regarding the effect of message length. The conflicting results may occur due to differences in investigated SNS platforms, the context studies, and the language of posts. However, the available data and results do not suffice a comprehending justification for a conclusion.
Compared to previous SNS studies in cruise travel, our study differs from Satta et al. (Citation2018) as we perform a different method and use more diverse set of post contents, which result in more granulated results. For instance, the ship plays a major role in cruise traveller’s perception (Kwortnik, Citation2008) and our results validated it. However, this important element of CT is not measured in their studies. Some of our results also contrast to their findings. The length of message does not impact the number of likes or re-shares whereas Satta et al. (Citation2018) state the opposite. The difference may result from differences in the sampling in which our study focused global posts in English while their study focused on Italian pages of cruise lines. This assumption requires a validation by a further study. Our paper also differs from Roth-Cohen and Lahav (Citation2021) as we analyze Facebook posts of a cruise line quantitatively with a SC perspective while they examine CT Facebook groups qualitatively with an netnography perspective. While our results present characteristics of posts that lead to higher BRSC and BOSC, they classified messages shared by users based on their content such as information sharing and solidarity between cruise lovers.
6. Theoretical and practical implications
This study contributes to the literature in several aspects. First, this paper contributes to SCT by investigating it within the SNS context. SC helps organizations in various ways, such as resilience achievement and customer retention (Ali et al., Citation2019). In recent years, the importance of SC in organizations is particularly recognized by academia (Kim et al., Citation2019). Our study adopts different types of SC to the SNS context and finds out whether different characteristics of SNS posts influence BRSC and BOSC. Results of our study enrich the literature investigating SNSs and SC.
This study can be considered as one of the pioneering studies which investigate the cruise line SNS context. This study is the first to utilize a cruise ship and cruising motivator in a SNS context. Our study results indicate that cruise travel-specific variables such as cruise motivation and a ship image's existence significantly impact the number of likes and re-sharing. This result encourages tourism literature to use travel-specific variables while investigating SNS studies in addition to those generic variables such as CT and MT. This also calls for a more in-depth investigation of the type of holiday and potential unique variables.
In addition to travel-specific variables, our paper also provides methodological implications to SNS studies in the tourism literature. Although the CHAID method has been used in survey-based tourism studies (do Valle et al., Citation2012; Legohérel et al., Citation2015; and Díaz-Pérez et al., Citation2020), it has not been utilized adequately despite its superiority in terms of capability in handling large datasets and ability to use both categorical and continuous variables. Significant results of our study confirm that CHAID can be successfully used in tourism SNS studies as well. The cruise travel industry is recently facing unprecedented challenges (Pan et al., Citation2021; Roth-Cohen & Lahav, Citation2021), and SC seems to be one of the methods to cope with these challenges. However, very few papers investigate the role of SC in cruise travel literature. As the first study investigating the Facebook posts’ impact on establishing SC efforts of cruise lines, we expect our study to drive more research in the relationship between SC and cruise travel.
The results of this paper also present several implications for the practice. The most prominent issue cruise lines are recently dealing with is the COVID-19 pandemic. The negative impacts of COVID-19 on tourists and cruise travellers, particularly tourist perception and psychology, are well documented in the literature (Kock et al., Citation2020; Pan et al., Citation2021; Roth-Cohen & Lahav, Citation2021). In such an environment where travellers’ perception is negatively affected, managers in cruise lines should be well-connected to travellers through SNS and create a positive image about cruise travelling during and post-COVID periods. While creating a positive image in SNS, possibly by ensuring travellers with COVID measures, managers are suggested to use cruise ship images and videos as they positively influence SC building, according to our results. Moreover, cruise ship images in SNS posts will help travellers build nostalgia, which may help in positive perceptions (Roth-Cohen & Lahav, Citation2021). Since creating BOSC requires a more extended period, we suggest managers focus more on creating BRSC to manage SNS in regard to COVID-19 issues that demand swift actions. Hence, besides sharing COVID-19 posts by including ship images, we suggest managers combine relaxation and convenience motivators with COVID-19-related positive messages to attract more BRSC.
Our results warn managers in cruise lines that not all posts lead to the same level of engagement with followers on Facebook. Targeting BRSC, we suggest cruise lines share posts that drive relaxation and convenient motivations of passengers. While doing this, cruise lines should prefer posts with photos or videos that involve emotional content rather than functional ones. These types of posts trigger the highest number of likes. However, it would not be practical to suggest that cruise lines only share these posts. An assortment of posts should be posted to avoid repetition. Moreover, cruise lines must also share functional content such as CSR and company information, although emotional ones receive higher likes. In such cases, we suggest cruise lines include ship images to posts as much as possible.
Cruise vessels are a distinguishing feature of cruise travel in comparison to other holiday options. Thus, it is no surprise that ship images split a total of three-parent nodes in BRSC tree, and each time posts with ship images resulted in a higher number of likes. Despite its significant role in building BOSC and BRSC in Facebook, our sampled dataset illustrates that over 60% of posts do not include any ship image. Thus, we encourage cruise lines to include more ship images while sharing a Facebook post.
Regarding BOSC, cruise lines should create more video content to drive a re-sharing attitude. When posting a video is not possible, cruise lines are suggested to include their cruise vessels’ images to ensure more re-sharing. If that is also not possible, then they are recommended to involve posts with convenience motivation. Cruise lines can also share posts that stimulate relaxation, socializing, cost, and exploring motivations alongside fun and loyalty motivations. Our final recommendation is that cruise lines should avoid gif posts, resulting in significantly lower reactions in both liking and re-sharing.
7. Conclusion
This paper investigates how cruise lines can build SC through the utilization of SNSs. BRSC is mirrored as liking a post by followers while BOSC is mirrored as re-sharing a post. To do this, CHAID analyses are conducted on a global cruise line’s Facebook posts to find out predictors of liking and re-sharing behaviour of followers and reveal characteristics of most liked and re-shared post groups. Results revealed that MT, passenger motivation, and the existence of a ship image help to establish both BRSC and BOSC, while CT helps to form BRSC.
One of the limitations of this study is that it focuses on one SNS that is Facebook. However, different post characteristics may be more prominent to establish BRSC and BOSC on different SNSs. It is important to determine the characters required to create BRSC and BOSC in different SNS. Thus, a similar study can be carried out to determine the post characteristics that help establish bringing and BOSC in different SNSs such as Twitter or Instagram. Another limitation of the study is that the results should be carefully interpreted in some essential cruise shipping markets, such as China, where there is no access to Facebook. Therefore, it is vital to conduct similar studies investigating SC building through SNSs in these markets’ popular SNSs such as WeChat or Sina Weibo.
In this study, we only focused on one cruise line’s official Facebook page because of the significant differences in the number of followers. Focusing on a single cruise line’s Facebook page gave us a chance to compare the number of likes and shares more accurately. However, the same situation prevented us from making comparisons between companies and generalize results. Thus, a further study can be conducted with cruise lines’ Facebook accounts with similar follower numbers.
Disclosure statement
No potential conflict of interest was reported by the author(s).
References
- Abuljadail, M., & Ha, L. (2019). Engagement and brand loyalty through SC in SM. International Journal of Internet Marketing and Advertising, 13(3), 197–217. https://doi.org/10.1504/ijima.2019.102557
- Alexa. (2020). The top 500 sites on the web. https://www.alexa.com/topsites (Accessed Date: 17 October 2020).
- Ali, M., Azab, N., Sorour, M. K., & Dora, M. (2019). Integration v. Polarisation among social media users: Perspectives through social capital theory on the recent Egyptian political landscape. Technological Forecasting and Social Change, 145, 461–473. https://doi.org/10.1016/j.techfore.2019.01.001
- Arasli, H., Saydam, M. B., & Kilic, H. (2020). Cruise travelers’ service perceptions: A critical content analysis. Sustainability, 12(17), 6702. https://doi.org/10.3390/su12176702
- Barnes, N. G., Mazzola, A., & Killeen, M. (2020). Oversaturation and disengagement: The 2019 Fortune 500 SM dance. Center for Marketing Research. https://www.umassd.edu/cmr/research/2019-fortune-500.html (Accessed Date: 21 November 2020).
- Choquet, A., & Sam-Lefebvre, A. (2021). Ports closed to cruise ships in the context of COVID-19: What choices are there for coastal states? Annals of Tourism Research, 86, 103066. https://doi.org/10.1016/j.annals.2020.103066
- Coleman, J. S. (1988). Social capital in the creation of human capital. American Journal of Sociology, 94, S95–S120. https://doi.org/10.1086/228943
- Cruise Lines International Association (CLIA). (2019). https://cruising.org/-/media/research-updates/research/clia-2019-state-of-the-industry-presentation-(1).ashx.
- De Vries, L., Gensler, S., & Leeflang, P. S. (2012). Popularity of brand posts on brand Fan pages: An investigation of the effects of social media marketing. Journal of Interactive Marketing, 26(2), 83–91. https://doi.org/10.1016/j.intmar.2012.01.003
- Denktaş-Şakar, G., & Sürücü, E. (2020). Stakeholder engagement via social media: An analysis of third-party logistics companies. The Service Industries Journal, 40(11-12), 866–889. https://doi.org/10.1080/02642069.2018.1561874
- Díaz-Pérez, F. M., & Bethencourt-Cejas, M. (2016). Chaid algorithm as an appropriate analytical method for tourism market segmentation. Journal of Destination Marketing & Management, 5(3), 275–282. https://doi.org/10.1016/j.jdmm.2016.01.006
- Díaz-Pérez, F. M., Fu, X., Fyall, A., Deel, G., & García-González, C. G. (2020). Florida state parks: A CHAID approach to market segmentation. Anatolia, 32(2), 246–261. https://doi.org/10.1080/13032917.2020.1856158.
- do Valle, P. O., Pintassilgo, P., Matias, A., & André, F. (2012). Tourist attitudes towards an accommodation tax earmarked for environmental protection: A survey in the algarve. Tourism Management, 33(6), 1408–1416. https://doi.org/10.1016/j.tourman.2012.01.003
- Dolan, R., Conduit, J., Fahy, J., & Goodman, S. (2016). Social media engagement behaviour: A uses and gratifications perspective. Journal of Strategic Marketing, 24(3-4), 261–277. https://doi.org/10.1080/0965254X.2015.1095222
- Ellison, N. B., Steinfield, C., & Lampe, C. (2007). The benefits of Facebook “friends:” social capital and college students’ Use of online social network sites. Journal of Computer-Mediated Communication, 12(4), 1143–1168. https://doi.org/10.1111/j.1083-6101.2007.00367.x
- Gon, M. (2020). Local experiences on Instagram: SM data as source of evidence for experience design. Journal of Destination Marketing & Management, 100435. https://doi.org/10.1016/j.jdmm.2020.100435
- Horng, S. M., & Wu, C. L. (2020). How behaviors on social network sites and online social capital influence social commerce intentions. Information & Management, 57(2), 103176. https://doi.org/10.1016/j.im.2019.103176
- Hung, K., & Petrick, J. F. (2011). Why do you cruise? Exploring the motivations for taking cruise holidays, and the construction of a cruising motivation scale. Tourism Management, 32(2), 386–393. https://doi.org/10.1016/j.tourman.2010.03.008
- Kass, G. V. (1980). An exploratory technique for investigating large quantities of categorical data. Journal of the Royal Statistical Society: Series C (Applied Statistics), 29(2), 119–127. https://doi.org/10.2307/2986296
- Kim, H., & Yang, S. U. (2017). Like, comment and share on Facebook: How each behavior differs from the other. Public Relations Review, 43(2), 441–449. https://doi.org/10.1016/j.pubrev.2017.02.006
- Kim, M., Cichy, R. F., Zhang, L., & Yu, J. (2019). Antecedents of SC and its impact on satisfaction and loyalty. Journal of Hospitality Marketing & Management, 28(2), 263–284. https://doi.org/10.1080/19368623.2018.1510798
- Kim, N., & Shim, C. (2018). Social capital, knowledge sharing and innovation of small- and medium-sized enterprises in a tourism cluster. International Journal of Contemporary Hospitality Management, 30(6), 2417–2437. https://doi.org/10.1108/IJCHM-07-2016-0392
- Kock, F., Nørfelt, A., Josiassen, A., Assaf, A. G., & Tsionas, M. G. (2020). Understanding the COVID-19 tourist psyche: The evolutionary tourism paradigm. Annals of Tourism Research, 85, 103053. https://doi.org/10.1016/j.annals.2020.103053
- Kucukusta, D., Perelygina, M., & Lam, W. S. (2019). Csr communication strategies and stakeholder engagement of upscale hotels in SM. International journal of contemporary hospitality management, 31(5), 2129–2148. https://doi.org/10.1108/IJCHM-06-2018-0484
- Kwortnik, R. J. (2008). Shipscape influence on the leisure cruise experience. International Journal of Culture, Tourism and Hospitality Research, 2(4), 289–311. https://doi.org/10.1108/17506180810908961
- Lee, S. Y., Hansen, S. S., & Lee, J. K. (2016). What makes us click “like” on Facebook? Examining psychological, technological, and motivational factors on virtual endorsement. Computer Communications, 73, 332–341. https://doi.org/10.1016/j.comcom.2015.08.002
- Legohérel, P., Hsu, C. H., & Daucé, B. (2015). Variety-seeking: Using the CHAID segmentation approach in analyzing the international traveler market. Tourism Management, 46, 359–366. https://doi.org/10.1016/j.tourman.2014.07.011
- Lin, N. (2017). Building a network theory of social capital. In N. Lin, K. Cook, & R. S. Burt (Eds.), Social capital (pp. 3–28). Routledge.
- Lobo, A. C. (2008). Enhancing luxury cruise liner operators’ competitive advantage: A study aimed at improving customer loyalty and future patronage. Journal of Travel & Tourism Marketing, 25(1), 1–12. https://doi.org/10.1080/10548400802157867
- Luarn, P., Lin, Y. F., & Chiu, Y. P. (2015). Influence of Facebook brand-page posts on online engagement. Online Information Review, 39(4), 505–519. https://doi.org/10.1108/OIR-01-2015-0029
- McGehee, N. G., Lee, S., O’Bannon, T. L., & Perdue, R. R. (2010). Tourism-related social capital and Its relationship with other forms of capital: An exploratory study. Journal of Travel Research, 49(4), 486–500. https://doi.org/10.1177/0047287509349271
- Morstatter, F., & Liu, H. (2017). Discovering, assessing, and mitigating data bias in social media. Online Social Networks and Media, 1, 1–13. https://doi.org/10.1016/j.osnem.2017.01.001
- Narangajavana, Y., Fiol, L. J. C., Tena, MÁM, Artola, R. M. R., & García, J. S. (2017). The influence of SM in creating expectations. Annals of tourism research, 65, 60–70. https://doi.org/10.1016/j.annals.2017.05.002
- Niavis, S., & Tsiotas, D. (2018). Decomposing the price of the cruise product into tourism and transport attributes: Evidence from the Mediterranean market. Tourism Management, 67, 98–110. https://doi.org/10.1016/j.tourman.2018.01.004
- Pan, T., Shu, F., Kitterlin-Lynch, M., & Beckman, E. (2021). Perceptions of cruise travel during the COVID-19 pandemic: Market recovery strategies for cruise businesses in North America. Tourism Management, 85, 104275. https://doi.org/10.1016/j.tourman.2020.104275
- Park, S. B., Ok, C. M., & Chae, B. K. (2016). Using twitter data for cruise tourism marketing and research. Journal of Travel & Tourism Marketing, 33(6), 885–898. https://doi.org/10.1080/10548408.2015.1071688
- Perreault, W. D., & Leigh, L. E. (1989). Reliability of nominal data based on qualitative judgments. Journal of Marketing Research, 26(2), 135–148. https://doi.org/10.1177/002224378902600201
- Pino, G., Peluso, A. M., Del Vecchio, P., Ndou, V., Passiante, G., & Guido, G. (2019). A methodological framework to assess SM strategies of event and destination management organizations. Journal of Hospitality Marketing & Management, 28(2), 189–216. https://doi.org/10.1080/19368623.2018.1516590
- Putnam, R. D. (2000). Bowling alone: The collapse and revival of American community. Simon & Schuster.
- Rodrigue, J. P., & Wang, G. W. (2021). Cruise shipping supply chains and the impacts of disruptions: The case of the Caribbean. Research in Transportation Business & Management, 100551. https://doi.org/10.1016/j.rtbm.2020.100551
- Roth-Cohen, O., & Lahav, T. (2021). Cruising to nowhere: COVID-19 crisis discourse in cruise tourism Facebook groups. Current Issues in Tourism, 1–17. https://doi.org/10.1080/13683500.2021.1940106
- Satta, G., Parola, F., Buratti, N., Persico, L., & Viviani, R. (2018). Sm and customer engagement in tourism: Evidence from Facebook corporate pages of leading cruise companies. 21st excellence in services International conference. 30-31 August 2018, Paris, France.
- Seraphin, H., Sheeran, P., & Pilato, M. (2018). Over-tourism and the fall of venice as a destination. Journal of Destination Marketing & Management, 9, 374–376. https://doi.org/10.1016/j.jdmm.2018.01.011
- Shen, B., & Bissell, K. (2013). Social media, social Me: A content analysis of beauty companies’ Use of Facebook in marketing and branding. Journal of Promotion Management, 19(5), 629–651. https://doi.org/10.1080/10496491.2013.829160
- Sias, P. M., & Duncan, K. L. (2020). Not just for customers anymore: Organization Facebook, employee SC, and organizational identification. International Journal of Business Communication, 57(4), 431–451. https://doi.org/10.1177/2329488418765930
- Song, S., Park, S. B., & Park, K. (2020). Thematic analysis of destination images for SM engagement marketing. Industrial Management & Data Systems, 1375–1397. https://doi.org/10.1108/IMDS-12-2019-0667
- Statista. (2020). Number of monthly active Facebook users worldwide as of 2nd quarter 2020. https://www.statista.com/statistics/264810/number-of-monthly-active-facebook-users-worldwide/#:~:text=How%20many%20users%20does%20Facebook,the%20biggest%20social%20network%20worldwide (Accessed Date: 17 October 2020).
- Steinfield, C., DiMicco, J. M., Ellison, N. B., & Lampe, C. (2009, June). Bowling online: Social networking and SC within the organization. Proceedings of the fourth international conference on communities and technologies (pp. 245–254). ACM.
- Su, N., Reynolds, D., & Sun, B. (2015). How to make your Facebook posts attractive: A case study of a leading budget hotel brand fan page. International Journal of Contemporary Hospitality Management, 27(8), 1772–1790. https://doi.org/10.1108/IJCHM-06-2014-0302
- Sun, X., Jiao, Y., & Tian, P. (2011). Marketing research and revenue optimization for the cruise industry: A concise review. International Journal of Hospitality Management, 30(3), 746–755. https://doi.org/10.1016/j.ijhm.2010.11.007
- Surucu-Balci, E., Balci, G., & Yuen, K. F. (2020). Social media engagement of stakeholders: A decision tree approach in container shipping. Computers in Industry, 115, 103152. https://doi.org/10.1016/j.compind.2019.103152
- Swani, K., & Labrecque, L. I. (2020). Like, comment, or share? Self-presentation vs. Brand relationships as drivers of social media engagement choices. Marketing Letters, 31(2-3), 279–298. https://doi.org/10.1007/s11002-020-09518-8
- Swani, K., Milne, G. R., Brown, B. P., Assaf, G. A., & Donthu, N. (2017). What messages to post? Evaluating the popularity of social media communications in business versus consumer markets. Industrial Marketing Management, 62, 77–87. https://doi.org/10.1016/j.indmarman.2016.07.006
- Teng, C. I. (2018). Managing gamer relationships to enhance online gamer loyalty: The perspectives of social capital theory and self-perception theory. Computers in Human Behavior, 79, 59–67. https://doi.org/10.1016/j.chb.2017.10.024
- Villamediana-Pedrosa, J. D., Vila-Lopez, N., & Küster-Boluda, I. (2019). Secrets to design an effective message on Facebook: An application to a touristic destination based on big data analysis. Current Issues in Tourism, 22(15), 1841–1861. https://doi.org/10.1080/13683500.2018.1554625
- Wang, Z., Yu, Z., Fan, R., & Guo, B. (2020). Correcting biases in online social media data based on target distributions in the physical world. IEEE Access, 8, 15256–15264. https://doi.org/10.1109/ACCESS.2020.2966790
- Williams, D. (2006). On and Off the 'Net: Scales for social capital in an online Era. Journal of Computer-Mediated Communication, 11(2), 593–628. https://doi.org/10.1111/j.1083-6101.2006.00029.x
- Yost, E., Zhang, T., & Qi, R. (2021). The power of engagement: Understanding active SM engagement and the impact on sales in the hospitality industry. Journal of Hospitality and Tourism Management, 46, 83–95. https://doi.org/10.1016/j.jhtm.2020.10.008
- Zhao, W., Ritchie, J. R. B., & Echtner, C. M. (2011). Social capital and tourism entrepreneurship. Annals of Tourism Research, 38(4), 1570–1593. https://doi.org/10.1016/j.annals.2011.02.006