
ABSTRACT
Visitor attractions are a primary tourism product. Yet, little is known about the interrelationships between attractions’ spatial characteristics, their thematic similarities, and product complementarities, and inter-attractions’ compatibility. Furthermore, at the intra-attraction level, the relationships between thematic diversity, complementarities and attraction's appeal remain overlooked. This paper suggests a conceptual framework and empirical approach to explore these relationships econometrically while controlling for tourism cluster density. Based on the conceptual model, several hypotheses were drawn and tested via empirical models by using the primary data from 300 visiting tracks of a random sample of visitors to attractions, surveyed in-situ during a single trip. These observations created the secondary data for 161 combinations (bundles) of attractions. Employing a negative-binomial regression to explain compatibility, we found that intra-level thematic diversity decreases compatibility between attractions and that visitors preferred to visit fewer attractions with more thematic diversity, than visiting more attractions that are less diversified. The paper concludes with policy implications and provides insights into bundling in the context of tourism diversification.
1. Introduction
Strategic tourism product development and assembly are based on the degree of clustering and diversification of tourism products at the micro business- and destination levels. Destinations respond to the dynamic demands of discerning customer prospects with the attempt to create varied and attractive bundles of tourism products. The underlying premise is that a more appealing range of product offerings should be provided in order to exploit their potential spatio-thematic synergies (Benur & Bramwell, Citation2015; George et al., Citation2016).
This study focuses on compatibility between visitor attractions. Visitor attraction is a primary tourism product that offers differentiated products and services to entice visitors. It is the raison d’etre for the existence of tourism destinations and a key pull factor for destination development (Connell et al., Citation2015; Paulino et al., Citation2019; Weidenfeld & Leask, Citation2013).
Tourists visit different attractions and display particular movement patterns. Such accumulative patterns eventually form clusters based on spatial proximity and compatibility (Weidenfeld et al., Citation2011). Destinations can benefit from developing a carefully designed and balanced bundle of attractions that accommodate visitors’ preferences in terms of needs and desires, economic rationale, travel mobility and time constraints (Caldeira & Kastenholz, Citation2018, Citation2020). This is particularly pertinent to multi-attraction travel, which has become popular among travellers (Caldeira & Kastenholz, Citation2018; Park et al., Citation2019). This trend is reflected in the growing literature on multi-attraction in the context of travel behaviour in general and destination choice models in particular (Bo et al., Citation2017; Kang et al., Citation2018; Kim et al., Citation2018; Kim & Kang, Citation2020; Peng & Huang, Citation2017). Recent studies have used innovative analytical tools, such as social media analysis, tracing apps, global positioning systems and geotagging, to analyse this (see Zhou & Chen, Citation2021 for a comprehensive literature review).
However, little is known about how the patterns of multi-attraction travel differ across thematic diversities, complementarities, and spatial relationships (Weidenfeld et al., Citation2010). This knowledge gap may be reflected in a non-effective marketing strategy of visitor attractions that ignores potential synergies and could result in long-distance travel between potentially compatible attractions (Zhou & Chen, Citation2021).
The choice of attractions within multi-attraction travel made by individual visitors is a complex process. It depends on the interplay between the visitor's characteristics and preferences, the attractions’ attributes, and the spatial relationships between attractions (Volchek et al., Citation2019). These latter relationships include location, density, distance, the attractions’ complementarities (e.g. when both passive and active experiences are provided within different attractions), and thematic diversity (i.e. different themes, such as wildlife and agriculture, provided within different attractions) (Matthews et al., Citation2018). Therefore, insights into the composition of attractions in terms of theme diversity and complementarities can boost the attractiveness of bundled products (Zoltan & McKercher, Citation2015). This is further complicated by the existence of complementarities and thematic diversity at the intra-attraction level (e.g. a single attraction that offers diversified themes and complementarities), thereby affecting its appeal while simultaneously affecting compatibility with neighbouring attractions. There has been limited empirical evidence on the interrelationships between thematic diversity and complementarities, and the extent to which they determine both inter-attraction compatibility, and the appeal of individual attractions in tourism destinations. This is despite their importance for the management, planning and marketing of destinations (Weidenfeld et al., Citation2010; Xiao-Ting & Bi-Hu, Citation2012). This understanding is even more important in rural areas, suffering from poor accessibility, where tourism is an essential driver of regional development (Huang et al., Citation2016; Paulino et al., Citation2019).
This study examines how compatibility is associated with complementarities and thematic diversity at the inter-and intra-attraction levels while controlling for other pertinent variables. Additionally, this paper explores the compatibility between attraction visitors in tourism clusters at high and low levels of spatial density while considering other spatial aspects (i.e. location and distance) by taking into account the geographical perspective of destinations. This study addresses, using an econometric approach, an important question: do tourists prefer visiting (on the same trip) a few attractions offering multiple and complementary themes over visiting many (or more) attractions; each provides a different (single) theme with less intra-attraction complementarities. While previous studies have explored the interplay between attractions’ complementarities and thematic diversity at the inter-attraction levels, they used qualitative approaches backed up by limited empirical data. This study is novel as it is the first to offer an econometric approach based on an underlying conceptual framework to explore the interplay of the above characteristics and attributes between the inter and intra-attraction levels.
2. Literature review, conceptual framework and hypotheses
2.1. Attractions compatibility
According to Nelson’s (Citation1958) theory of cumulative attraction, multiple attractions in an area will draw more visitors than if such attractions were widely scattered (Hernández et al., Citation2021; Lue et al., Citation1993). A key component of cumulative attraction is the principle of compatibility, which is measured in terms of the number of shared visitors (Crompton & Gitelson, Citation1979; Weidenfeld & Bjork, Citation2016). Compatibility reflects travel behaviour and decision-making (Hernández et al., Citation2021; Kim & Kang, Citation2020) It emerges when visits to one attraction positively influence visits to another, thereby minimizing time and travel, and sustaining each attraction's appeal (Matthews et al., Citation2018). As noted by Hunt and Crompton (Citation2008) ‘ … the principle of compatibility is the measure of the effect that one business has upon an adjacent or proximate business … ’ (p. 238). Accordingly, inter-attraction synergies contribute to compatibility and increase the overall volume of visitors to tourism destinations.
Advanced tracking technologies and online user-generated content to study multi-attraction travel have indicated the effect of attractions’ popularity, distance, destination routes and tourist characteristics on compatibility (Hernández et al., Citation2021; Zhou & Chen, Citation2021). These studies mainly employed exploratory statistical analyses of the attraction network; however, these have been limited in their ability to identify whether the observed compatibility is random or a result of spatial and product-related aspects, such as popularity, category and complementarities.
Following Hunt and Crompton (Citation2008), Weidenfeld et al. (Citation2011) used qualitative methods and non-parametric tests to compare small samples of attractions in rural areas in the UK to study compatibility. They identified positive relationships between (1) collective compatibility and spatial density of attractions at the destination level and (2) proximity of individual attractions and their compatibility at the local scale, i.e. between individual neighbouring attractions. More recently, Hernández et al. (Citation2021) have also conceptually and empirically studied the nature of compatibility in urban destinations. They employed the exponential random network model to estimate the statistical significance of compatibility using an extensive set of attractions in the city of Madrid and showed that product similarity is positively related to compatibility, and that proximity endows urban destinations with a diversity of attractions.
Matthews et al. (Citation2018) studied the effect of compatibility on the choice to visit beaches on the Coromandel Peninsula of New Zealand. Employing hierarchical choice processes and accounting for spatial dependencies and substitution patterns, they found that similarity diminished the site's attractiveness. As noted, compatibility between neighbouring attractions enhances each attraction's appeal and creates synergies. Since visitors maximize their experience while minimizing travel time and costs, these constraints are less binding in tourism clusters with a higher density than those with a lower density. Therefore, synergies are more likely to occur among spatially denser tourism clusters (Hunt & Crompton, Citation2008). However, this argument is supported by limited quantitative evidence. We hypothesize that the density of visitor attractions is positively related to compatibility in the tourism cluster.
Hypothesis 1: Compatibility between visitor attractions is positively related to their geographical density within the boundaries of a destination region.
2.2. Complementarities, thematic diversity and their effect on inter-attraction compatibility
Many studies have demonstrated that multi-attraction trips are preferred over single-attraction ones (e.g. Kang et al., Citation2018; Lew & McKercher, Citation2006). However, the factors that make visitor attractions compatible are unclear. The next two subsections (2.2.1 and 2.2.2) clarify two of the most important determinants in shaping compatibility between attractions.
2.2.1. Inter-attraction complementarities
Attractions’ complementarities are specific differences between qualities and attributes that create a more attractive experience, thereby, compatibility between nearby attractions increases. These complementarities include free vs. admission fee attractions, indoor vs. outdoor facilities and passive vs. active experiences.
The distinction between passive versus active experience has received considerable attention in the tourism and leisure literatue. Passive tourism experience, such as relaxing or observing is inherently less physical and less interactive (Ito et al., Citation2022; Li & Kovacs, Citation2022). It varies from no interaction between visitors and staff/objects and non-participatory activities (e.g. guided tours) to mental or physical engagement such as smelling, tasting or encouraging cognitive mindfulness (see examples in Fyall et al., Citation2022). Active tourism practices refer to a wide range of physical actions performed by the visitor (e.g. fruit picking) and to mental engagement through thoughtfulness and learning practices (e.g. horse riding training) and undertaking creative activities (design, fashion, gastronomy).
Complementarities are stimulated by the spatial proximity of attractions at the destination level. Thus, the attractiveness of an attraction can be associated with that of its neighbours (Zhou & Chen, Citation2021). Consequently, several attractions can be bundled as a single tourism experience consisting of several facilities, services and other attributes, which jointly create a holistic experience and result in higher compatibility and external economies. A holistic experience is referred to here as one that consists of synergetic elements addressing visitors’ needs, wants and desires, given their time and budget constraints. Hence, diversifying tourism destination offerings may increase tourism demand (Yang et al., Citation2018). We, therefore, hypothesize that:
Hypothesis 2: Compatibility is positively related to attractions’ complementarity.
2.2.2. Inter thematic similarity
Any bundle of attractions can be categorized based on the similarity levels of their themes. For example, different types of Sealife attractions (swimming with dolphins nearby a shark observatory) can be considered thematically similar. Consistent with the principle of homophily (Hernández et al., Citation2021), compatibility is expected to be more prevalent between similar attractions than dissimilar ones. A different view argues that the integration of dissimilar products encourages an immersive experience (Benur & Bramwell, Citation2015) and that compatibility is positively related to thematic dissimilarity (Weidenfeld & Bjork, Citation2016).
The relevance of the relationships between thematic (dis)similarity and compatibility to the marketing of a single attraction or a cluster of attractions, have been only examined qualitatively at the inter-attraction level and have not been examined econometrically either at the inter-attraction or intra-attraction levels. We aim at closing these two gaps. Based on Benur and Bramwell (Citation2015) and Weidenfeld and Bjork (Citation2016) we hypothesize that thematic dissimilarity is positively related to compatibility between neighbouring attractions. Formally:
Hypothesis 3: Compatibility is positively associated with thematic dissimilarity.
Hypothesis 4: Inter thematic dissimilarity has stronger explanatory power for compatibility than inter-attraction complementarities do.
2.3. The interplay between inter and intra-attraction levels
2.3.1. Thematic dissimilarity at the intra-attraction level
A visitor attraction can be organized around a key theme (i.e. monothematic attraction) or around two or more themes (i.e. polythematic attraction), which in return, shapes its appeal and compatibility with nearby attractions (Weidenfeld et al., Citation2011, Citation2016; Weidenfeld & Leask, Citation2013). Given the ultimate negative impact of distance decay, which endows, for example, urban destinations with multifunctionality and diversity while minimizing travel distance (Hernández et al., Citation2021), we assume that, ceteris paribus, visitors prefer visiting fewer sites with more themes each (higher intra-thematic dissimilarity) than multiple sites with fewer themes each (lower intra-thematic dissimilarity) on their trip. That is, bundles of sites characterized by intra-attraction thematic dissimilarity are expected to be more popular than those without it.
Hypothesis 5: There is a negative relationship between intra-attraction thematic dissimilarity and compatibility with other attractions.
2.3.2. Complementarities at the intra-attraction level
According to Weidenfeld et al. (Citation2011, 2016) and Weidenfeld and Bjork (Citation2016), the individual attractions’ appeal is determined, among other aspects, by the combination of complementarities and thematic dissimilarity between neighbouring visitor attractions (other aspects, such as infrastructure are beyond the scope of this study). Assuming all else being equal, (including thematic (dis)similarity), intra-attraction complementarities is also associated with higher visitor attraction's appeal. Accordingly, and given that visiting fewer neighbouring attractions is less costly in terms of admission fees, travel time and travel costs, we argue that visiting fewer attractions with more product complementarities in each attraction (higher intra-complementarities) is more preferable than multiple attractions with fewer intra-attraction complementarities on the same trip. Therefore, we hypothesize that attractions with intra-level complementarities are less compatible with nearby attractions. That is, tourism clusters with bundles of fewer attractions and more intra-site complementarities in each attraction, are expected to be more popular than those with more attractions and inter-site complementarities, all else being equal. While these relationships have previously been studied at the inter-attraction level; this study examines them empirically at the intra-attraction level. Formally:
Hypothesis 6: There is a negative relationship between intra-attraction product complementarities and compatibility.
Weidenfeld and Bjork (Citation2016) noted that thematic complementarity can exist when two attractions which provide complementary, rather than entirely similar, themes (e.g. an Aquarium and underwater Observatory Park). While this is relevant for destination planning and development, thematic complementarity is beyond the scope of this study. We assume that themes are either similar or diversified.
illustrates the conceptual relationships hypothesized and emphasizes the complexity of the spatial relationships. For the ease of visualization, we illustrate a hypothetical tourism cluster with randomly scattered visitor attractions. Each attraction is characterized by two dimensions: thematic and complementarities. For simplicity we assume two compatible themes: Nature and Water, (such that each attraction can offer Water or Nature or both themes) and one complementarity, for example, an attraction can offer either Passive or Active experience or both. Accordingly, an attraction can be classified as one of the following nine combinations: 1. (nature + passive) 2. (nature + active) 3. (nature + active/passive) 4. (water + passive) 5. (water + active) 6. (water + active/passive) 7. (nature/water + passive) 8. (nature/water + active) and 9. (nature/water + active/passive). Based on our hypotheses, attractions of type 9 would be the least compatible with neighbouring attractions, whereas neighbouring attractions, such as 1 and 5 will be the most compatible.
Figure 1. Compatibility and spatial relationships between proximate attractions.
Finally, neighbouring attractions, such as 1 and 4, would be more compatible than attraction 1 and 2 since themes matter more than complementarities (H4). The strength of compatibilities between any two neighbouring attractions is based on the hypotheses and emphasized by the colour intensity on the grey-black spectrum.
3. Methodology and data collection
3.1. Identification of tourism clusters
Tourism clusters are defined as spatial concentrations of tourism businesses originating from linked industries that offer a holistic tourism experience and develop external economies of scale as well as increase the attractiveness of destinations (Capone & Boix, Citation2016; Wang & Fesenmaier, Citation2007). In line with Zhou and Chen (Citation2021), tourism clusters can be used to describe a group of tourism attractions, whose network establishing patterns constitute such clusters. This pattern, which determines tourist aggregation behaviours and common motivations to visit certain groups of attractions, is affected by factors such as compatibility, inter- and intra-attraction thematic (dis)similarity, and complementarities in clusters at varying levels of density. The effect of these factors on compatability remains overlooked in the literature. Given that tourism in rural/peripheral areas, is an important diversification strategy (Tchetchik et al., Citation2008), two rural areas in Israel were selected, each representing different levels of density, i.e. the Southern cluster with low density and the Northern cluster with high density (Weidenfeld et al., Citation2011).
The boundaries of the clusters were delineated based on evidence from primary and secondary data, including tourism association websites, tourism leaflets, advertisements, guidebooks and semi-structured in-depth interviews with nine key informants (i.e. tourism officers in regional councils and heads of tourism associations in both regions). Accordingly, the criteria for defining the clusters were:
Areas in which collaboration between businesses, supported by public actors, took place.
Maps showing how regional tourism networks delineate their boundaries on websites.
The clusters’ boundaries were delineated to reflect differences in the density of attractions between the two regions. This was measured using Google Drive and ArcGIS software, which indicated that the minimum average travel distance and time, by road, between each pair of attractions (average speed 80 km per hour) is shorter in the North (56 min, 70 km) than the South (70 min, 88 km).
Similarities between the two peripheral tourism clusters include: connectivity and accessibility, availability of public transport, market segments (i.e. families who use car with freedom of movement within and between destination), and ‘business environments’ which correspond to tourism clusters (Weidenfeld et al., Citation2011). However, there are some interregional differences, including climatic and landscape coverage, and uneven thematic distribution (i.e. more water and adventure attractions in the North compared to more natural and agricultural attractions in the South). delineates the two clusters. As shows, the Northern cluster encompasses the mountainous region in the eastern Galilee and the surrounding low land south of the sea of Galilee, excluding its western part and the city of Tiberius (total of 1542 sq/km). It is characterized by a Mediterranean climate, hot and dry summers, and moderate to cold and rainy winters. The Southern cluster in the Arava valley region (1512 sq/km) stretches between the Red Sea to the Dead Sea, a section of the Great Rift Valley along the Israeli Jordanian border. It is the driest region in Israel, characterized by desert tourism, including hiking, nature reserves and heritage.
Figure 2. The North and South tourism clusters.
3.2. Survey design
The design of the survey was guided by the conceptual framework in section 2. The attractions’ compatibility between any two or more sites is our dependent variables, and it is measured by the number of visitors these attractions share (Crompton & Gitelson, Citation1979; Weidenfeld & Bjork, Citation2016). Our independent variables include attractions’ attributes, including themes and type of activities/facilities, and visitors’ attributes and patterns of visits.
In each of the two clusters, the critical informants identified several ‘must visit’ attractions as anchoring sites for conducting the visitors’ survey. Nine such pivotal attractions (five in the North and four in the South) have granted us permission to conduct a visitor survey (given the reluctance to disclose the attractions’ annual numbers of tourists, it was hard to consider the representativeness of the samples).
Visitors were sampled in-situ at the end of their visit. A questionnaire was compiled, including the following inquiries: whether the visitor is a day tripper or overnight stayer, place of accommodation (if any), place of residence, and the primary means of travelling. Additionally, respondents were asked which attractions they have visited before the current attraction and which attractions they intend to visit afterward (see Appendix A1 for the questionnaire).
3.3. Sampling
For the empirical part of this study we adopted a working definition for visitor attraction. In line with Leask (Citation2018, P301) visitor attractions are ‘natural, cultural or built assets that have been created or converted into a permanent visitor experience, where visitor interpretation and engagement with the asset is a core purpose of the development and management of the site’. Given that in this research we focus on built attractions (even though some of them are based on natural assets), the working definition of a visitor attractions in this study is a natural, cultural or built asset in a defined, small-scale, geographical area that has been created or converted into a permanent visitor experience, where visitor interpretation and engagement with the asset is a core purpose of its development and management (Leask, Citation2018). Given that our study refers to attractions as a consumption unit and in line with other related scholarly works (e.g. Weidenfeld et al., Citation2016) and following the definition of Visit Britain in this study, only attractions that meet the following conditions were selected:
able to charge admission even for the sole purpose of sightseeing.
a permanently established excursion destination, a primary purpose of which is to allow access for entertainment, interest, or education, places of worship rather than being primarily a retail outlet or a venue for sporting, theatrical, or film performances;
must e open to the public, without prior booking, for published periods each year;
capable of attracting day visitors or tourists as well as local residents’ (VisitBritain).
The systematic sampling technique, with a sampling interval of one, was applied. Surveyors were positioned at the exit point of each attraction and were instructed to approach the first visitor who exited the attraction. The first visitor to give his/her consent to participate was regarded the first respondent. As soon as one questionnaire was complete, the surveyors approached the very next person to hand them a questionnaire. This sampling method is more convenient than the simple random sampling and often produces smaller standard errors than simple random sampling (Thompson, Citation2013). A total number of 300 visitors agreed to fulfil the questionnaire after a short introduction, with 296 questionnaires satisfactorily completed. Visitors completing the questionnaire received compensation for their time and effort.
3.4. Data description
Of the 296 visitors 146 were sampled in the Northern cluster and the rest of the 150 visitors, were sampled in the Southern cluster. The 296 visitors reported visiting 121 attractions, of which 71 attractions are located in the Northern cluster, and the rest in the South. The data collection process generated three datasets; the first is a dataset of the 296 visitors who visited single or multi attractions in the Northern and Southern clusters. The second dataset is the 121 attractions visited and planned to be visited by the 296 participants. The third dataset is of 161 combinations (bundles) of attractions visited by our participants. These datasets allowed us to analyse compatibility with respect to thematic dissimilarities, complementarities and spatial patterns. A short description of these three datasets is provided below.
3.4.1. Visitors data
describes the summary statistics of the visitors including their visiting patterns. Most of the visitors stayed overnight (two nights on average), had 16 years of education, and travelled in groups of two families. Among the visitors, 70% were repeat visitors to the area. Almost half stated that they had been to other sites prior to visiting the sampled attraction, and 32% stated that they would visit at least one more additional site on their current trip. The majority of visitors originated from Tel-Aviv metropolitan area, which has a similar travel time, of about two hours, to both clusters.
Table 1. Visitors’ descriptive statistics
Visitors’ Travel time and cost are a significant proportion of the total cost of visiting. We used Google Distance Matrix API to estimate the distance and total road travel time between each attraction in the bundle and between the attractions and the place of accommodation for overnight stayers. The average travel time between each site and the individual's accommodation was 39 min for the Northern cluster and 54 min for the Southern cluster. The average travel time between attractions’ sites was 56 min (North) and 70 min (South).
3.4.2. Attractions data
The attributes of each of the 121 attractions recorded in the visitors’ sample were retrieved from the attraction's website. These attributes include its theme/s, provision of indoor/outdoor experience and active/passive activities. The thematic classification was carried out by analysing the written and visual content that appears on the attraction's websites, as well as considering stereotypical and generic images of USP and their description (Paulino et al., Citation2019).
provides the descriptive statistics of the attractions. Since an attraction can have more than one theme, the theme's proportion sums up to more than 100%.
Table 2. Descriptive statistics of the attractions’ themes and attributes
As demonstrates, Nature is the most common theme, followed by Water and Wildlife. The average number of themes per site was 1.6; however, a high variation was observed (coefficient of variation equals 0.44%). About a third of the attractions were passive, somewhat less than a third were active, and 36% had both active and passive elements. 76.8% of the sites have outdoor facilities, whereas 20% have indoor and outdoor facilities. Most sites are targeted at families with children. Out of the 121 attractions, 39% were free of charge, which was evenly distributed across the clusters. There is considerable variation in prices. In general, prices are higher on weekends than weekdays. Attractions in the North are more thematically diversified, including more Water and Adventure themes and more facilities with indoor/outdoor intra-complementarities.
3.4.3. Attraction thematic dissimilarity
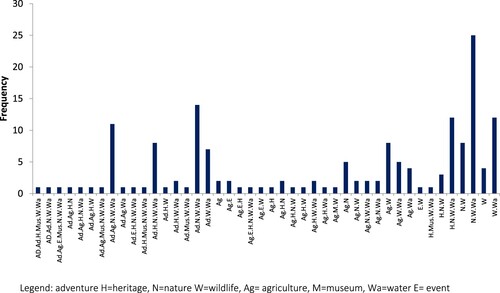
The 121 attractions visited created a unique set of 27 thematic combinations. illustrates these combinations and their frequencies. Mono-thematic attractions of Nature are the most common, followed by Water and Heritage. In total 50.4% of the attractions were monothematic, 35.5% had two themes, and the rest 14% had three themes.
Figure 3. Thematic classifications of the attractions, n = 121. Legend: Ad = adventure, H = heritage, N = nature, W = wildlife, Ag = agriculture, M = museum, Wa = water, E = event.
3.4.4. Bundles of attractions
The visit patterns of the 296 sampled visitors generated 161 unique bundles of visited attractions. Each bundle is represented by the themes of the attractions it includes, inter and intra-product complementarities, total admission fees, and the inter-site travel distance.
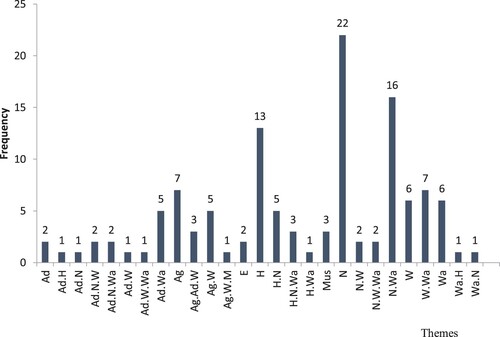
The average bundle consists of almost 2.9 attractions [SD = 1.2] with 3.3 themes in total [SD = 1.2]. Average compatibility was relatively low (about two visitors shared between any two sites). Most bundles represent both inter- and intra-complementarities in terms of active/passive (93% and 88%, respectively), whereas 51% of the bundles represent inter-complementarities in terms of outdoor/indoor. Only 13% have intra-complementarities in this respect (for the distribution of themes combination among the bundles visited, see Appendices A2 and A3).
4. Modelling and econometric framework
To understand the factors that affect compatibility, we used a count model where the dependent variable, i.e. compatibility, was calculated as the number of shared visitors to a combination of attractions. These combinations included every possible combination of 1–3 attractions within each cluster. Since the dispersion was greater than 1, we employed a negative-binomial regression to ascertain how well compatibility can be explained by site characteristics while distinguishing between the two agglomeration levels (Matthews et al., Citation2018). A zero-inflated model offered a slightly better model fit despite having twice as many parameters, so it was not preferred. For the estimation process we used Pandas Biogeme (Bierlaire, Citation2018). Two additional tests/calculations were used in order to test H1 and H4.
5. Results
5.1. Density and compatibility
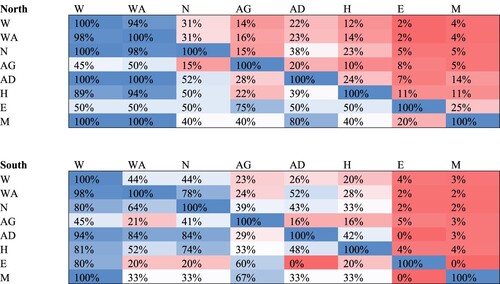
To test hypothesis 1, we calculated the compatibility between each two-way combination of attractions (). The Northern cluster was denser in terms of visitors’ attractions but had a lower average compatibility score between each pair of sites (3.4% compared to 5%). This difference is statistically significant (p < 0.01). This did not support hypothesis 1 ‘Compatibility between visitor attractions is positively related to their geographical density’. It can be explained by the fact that attractions in the North had 1.7 themes on average, whereas in the South, this figure was 1.4 (differences are statistically significant as portrays). This means that the more thematically dissimilar attractions in the North are associated with lower compatibility than in the South (this is in line with H5: ‘There is a negative relationship between intra-attraction thematic diversity and compatibility)’. Second, the share of attractions in the North with active/passive intra product complementarities was almost double compared to the South (40% vs. 23.8%, the difference is statistically significant, as shown in ), which might reduce compatibility with other attractions (this in line with H6: ‘There is a negative relationship between intra-attraction product complementarity and compatibility)’. Third, Northern attractions were twice as expensive as Southern ones, demonstrating that the visitors had more incentive to stay for a longer time in the attraction. A detailed description and discussion of thematic compatibility are provided in Appendix A4.
Table 3. Attraction compatibility per cluster.
5.2. Attraction combination visitor counts
presents the results of the negative binomial model for the entire sample.Footnote1 reaffirms that compatibility in the Northern cluster is lower (as shown in ) with a negative and significant coefficient. The estimation results reveal a positive impact of additional themes, thereby supporting H3: ‘Compatibility is positively related to thematic diversity’. However, the positive effect of additional themes (the coefficient of number of themes = 0.78) is smaller in absolute value than the (negative) impact of additional sites (the coefficient of number of attractions −2.58) (Wald test is significant). Therefore, it is suggested that people prefer fewer sites with more themes each, supporting H5: ‘There is a negative relationship between intra-attraction thematic dissimilarity and compatibility with other attractions’. The results show that the effect of complementarities (i.e. active/passive and indoor/outdoor) on computability is not monolithic. Inter-indoor/outdoor complementarities increase compatibility (the coefficient of Inter indoor outdoor is positively significant), yet the coefficient of inter-passive/active is not significant. Accordingly, H2, ‘Compatibility is positively related to attractions’ complementarity’, is supported only with respect to indoor/outdoor complementarities.
Table 4. Negative binomial model, entire sample.
As expected, the coefficient of travel between attractions is negative and significant. Note that the price coefficient is positive. This suggests that unobserved attraction quality variables are correlated with price. Popular and larger attractions with high quality and rich offerings might be more expensive due to higher operations costs. Moreover, all visitors used private cars to reach to the cluster and to move around its attractions (which is not surprising given the lack of accessible and efficient public transportation in peripheral Israel). Accounting for the high fuel prices in Israel (2.2 USD per litter), travel costs between sites and between accommodation facilities and the attractions account for a large component of the travel cost, thus, the negative coefficient of travel between sites offset the price coefficient. In case of high level, efficient, public transportation to and within both clusters, we would expect the price coefficient to become positive, which warrants further investigation.
5.3. Thematic similarities vs. complementarities
Finally, in order to test H4: ‘Inter thematic diversity has stronger explanatory power for compatibility than inter-attraction complementarities’, the amount of overall variance explained by these terms was tested. We ran two specifications of the MNL, where only one of the themes were added and in the second only the product complementarities were added. Appendix A5 presents the null and residual deviances for each specification, as well as the improvement accomplished in each step. The model including the number of themes explains 4% of variance whereas the model including product complementarities only explains 2% in total. These differences are statistically significant, thus supporting H4.
6. Discussion and concluding remarks
The study advances our understanding of the complex relationships between visitor attractions in a given tourism cluster that are defined by visitors’ travel behaviour patterns. More specifically, we examined how compatibility patterns are determined by inter- and intra-attraction thematic (dis)similarities as well as inter-and intra-attraction complementarities, in relation to their spatial relationships (distance, location, density).
The accumulated body of research has so far, addressed the relationships between thematic (dis)similarity, complementarities and compatibility, at the inter-attraction level, yet, it has mainly employed qualitative approaches with limited empirical data. Moreover, at the intra-attraction level, these relationships have not been addressed at all. Closing these two gaps is crucial for the marketing of a single attraction or a cluster of attractions. The study is novel for identifying that complementarities can also exist at the intra-attraction level and analysing how they shape the appeal of individual attractions.
This study addresses, using an econometric approach, an important question: do tourists prefer visiting a few attractions offering multiple and complementary themes over visiting many (or more) attractions; each provides a different (single) theme with less intra-attraction complementarities. As for the thematic offering, we find evidence that visitors prefer fewer attractions with more themes over multiple sites with fewer themes each on their trip. Regarding attraction's complementarities, we found that compatibility between attractions is negatively related to intra-attraction indoor/outdoor complementarity. This suggests that attractions offering both indoor and outdoor facilities/activities provide visitors with a more holistic experience. Unlike our hypothesis, similar relationships between compatibility and intra-attraction active/passive complementarity, were not identified. This can be explained by the significance of weather-related activities, and water and landscape-related activities that are more acute than man-made outdoor facilities, and thus, perceived as the ultimate outdoor experience. These results suggest that the complementarities indoor/outdoor and passive/active cannot be treated as monolithic with respect to their effect on compatibility.
We found compatibility in the Southern cluster to be slightly, yet significantly, higher than that in the North. Even though people visiting the Northern cluster stay more nights on average, they visit two attractions on average, versus 2.2 in the Southern cluster. This contradicts the assumption that visitors would prefer to minimize travel in less agglomerated clusters more than in more agglomerated ones. This may be explained by the fact that the Southern cluster offered fewer attractions that are less thematically diverse than those in the North; attractions in the North had 1.7 themes on average, whereas in the South, this figure was 1.4 (differences are statistically significant, ). Second, the share of attractions in the North with active/passive complementarity is almost double in the South (40% vs. 23.8%, the difference is significant, ), which reduces compatibility with other attractions. Third, the Northern attractions are twice as expensive as those in the South, implying that the visitors are incentivized to stay longer in the Northern attractions.
Finally, as expected distance between the attractions had a negative impact; the further attractions are from each other, the lower its compatibility.
Whereas external validity is limited given the unique characteristics of the case study regions, our contribution goes beyond the specific results of the econometric model by suggesting a generalizable conceptual model, and an econometric approach to study compatibility which applies to multi-attraction travel choices. This approach can be applied to other regions with different characteristics.
6.1. Policy implications
Our results show that thematic dissimilarity and complementarities at the inter-and intra-attraction level, may enhance synergies, compatibility and appeal of individual attraction (Benur & Bramwell, Citation2015). Our study addresses the nexus between density, dissimilarity, complementarities and compatibility in the visitor attraction sector, and suggests several implications for tourism practitioners and policymakers. We found 3.4% and 5% compatibility levels in the Northern and Southern clusters, respectively. Yet, counter to our prediction that compatibility would be higher in the denser Northern cluster, we found statistically significant higher compatibility in the Southern cluster. This is probably due to the higher thematic dissimilarity of attractions in the North, which coincides with visitors’ preferences to visit fewer sites with more themes than those in the South. This may suggest that the more appealing an attraction is, the less compatible it is with its neighbours. The policy implication is that dissimilarity between visitor attractions offering fewer themes in destination is likely to increase travel time and distance visitors spend on the same trip. It also suggests that destination regions aiming to spatially spread their visitors and their spending more evenly as well as reduce reducing environmental impacts due to seasonal overcrowiding by encouraging more dissimilarity and less intra attraction complementarity, which will increase compatibility. However, this of course depends on area size and travel time between locations within the destination region or cluster. Thus, thematic dissimilarity as well as complementarities at the inter and intra-attraction levels should be considered differently at different levels of clusters density. Clusters with low density of visitor attractions aiming to enhance their tourism experience by reducing average travel time between attractions should develop attractions offering thematically diverse experience engenedered by intra-complementarities which decreases compability with other attractions. Conversely, denser clusters aiming to increase visitor movement and spending in perhaps less visited parts of the region should encourage dissimilarity between visitor attractions and less intra complementarities that may encourage visitors to travel larger distance which will diversify their tourism experience.
These should not take place without considering improved coordination between nearby attractions and shared costs through joint marketing (e.g. joint selling, cross-referencing) while considering the above aspects that vary among regions and depend on the nature of individual attractions and their locations at varying levels of density of their clusters. In the studied clusters, visitor attractions should develop inter-site complementarities with their neighbours, particularly in terms of outdoor and indoor facilities, and activities. Future studies should examine the generalisability of this outcome to other tourism destinations in the world.
6.2. Limitations and suggestions for future research
This study focuses on the understudied relationships that effect compatibility. These relationships have an impact on cooperation, coordination and competition between tourism businesses (attractions) at lower and higher density level (Benur & Bramwell, Citation2015). These impacts, in turn, determine destinations’ competitiveness. The manner through which the relationships identified here could impact cooperation, coordination and competition should be explored in future studies.
The results of the study should be considered with caution. First, we sampled only two clusters, thus, we cannot exclude the possibility that the differences in compatibility between clusters are not due to unobserved variables. It is also possible that the results obtained are sensitive to the pre-determined definition of the clusters and delineation of their boundaries. Second, considering availability, permission to survey tourists, as well as time and financial constraints, it was impossible to assess the representativeness of the samples in terms of the actual visitor numbers. Future studies are therefore encouraged to pursue better representativeness. Finally, an insufficient number of observations did not allow for identifying thematic complementarities in this model, which should be examined in future studies.
Further, the spatio-temporal visitation patterns we observed were based on approaching the visitors at the attractions sampled, and it relies on their self-reporting of past and intended attraction choices. The proliferation of tracking technologies, most notably GPS sensors, allows researchers to embark on empirical investigations of the complex interactions between space and time among tourists (Shoval et al., Citation2018), and this may be utilized in future studies to generate more accurate data, including better measurements of time spent in each site. Despite these caveats, our approach suggests conceptual and methodological contributions to studying multi-attraction travel patterns considering the interrelationships between their different elements and offers new avenues to studying these in other tourism sub-sectors and beyond.
RCIT__2173055_Appendix_material
Download Zip (66.5 KB)Acknowledgements
We are grateful for the helpful critical comment of Professor Richard Butler. His comments and insight have greatly improved our paper.
Disclosure statement
No potential conflict of interest was reported by the author(s).
Additional information
Funding
Notes
1 Running the model for each of the two clusters separately, did not demonstrate significant differences between the coefficients.
References
- Benur, A. M., & Bramwell, B. (2015). Tourism product development and product diversification in destinations. Tourism Management, 50, 213–224. https://doi.org/10.1016/j.tourman.2015.02.005
- Bierlaire, M. (2018). Pandasbiogeme: A short introduction (technical report TRANSP-OR 181219). Transport and Mobility Laboratory, ENAC, EPFL, Bioegeme.
- Bo, Z., Bi, Y., Hengyun, L., & Hailin, Q. (2017). The spillover effect of attractions: Evidence from Eastern China. Tourism Economics, 23(4), 731–743. https://doi.org/10.5367/te.2016.0541
- Botha, E. (2016). Marketing experiences for visitor attractions: The contribution of theming. In The handbook of managing and marketing tourism experiences (pp. 343–362). Emerald Group Publishing Limited.
- Caldeira, A. M., & Kastenholz, E. (2018). Tourists’ spatial behaviour in urban destinations: The effect of prior destination experience. Journal of Vacation Marketing, 24(3), 247–260. https://doi.org/10.1177/1356766717706102
- Caldeira, A. M., & Kastenholz, E. (2020). Spatiotemporal tourist behaviour in urban destinations: A framework of analysis. Tourism Geographies, 22(1), 22–50. https://doi.org/10.1080/14616688.2019.1611909
- Capone, F., & Boix, R. (2016). Defining tourist clusters in Europe. In F. Capone (Ed.), Tourist clusters, destinations and competitiveness theoretical issues and empirical evidence (pp. 81–100). Routledge.
- Connell, J., Page, S. J., & Meyer, D. (2015). Visitor attractions and events: Responding to seasonality. Tourism Management, 46, 283–298. https://doi.org/10.1016/j.tourman.2014.06.013
- Crompton, J. L., & Gitelson, R. J. (1979). The theory of cumulative attraction and compatibility: A case study of two major commercial leisure enterprises. Baylor Business Studies, 10(1), 7.
- Fyall, A., Garrod, B., Leask, A., & Wanhill, S. (2022). Managing visitor attractions: New directions (3rd ed.). Routledge.
- George, B. P., Henthorne, T. L., & Williams, A. J. (2016). Attraction diversity index: The concept, measure, and its relation with tourism destination competitiveness. Revista Turismo: Estudos e Práticas, 5(2), 9–29.
- Hernández, J. M., Santana-Jiménez, Y., & González-Martel, C. (2021). Factors influencing the co-occurrence of visits to attractions: The case of Madrid, Spain. Tourism Management, 83, 104236. https://doi.org/10.1016/j.tourman.2020.104236
- Huang, W. J., Beeco, J. A., Hallo, J. C., & Norman, W. C. (2016). Bundling attractions for rural tourism development. Journal of Sustainable Tourism, 24(10), 1387–1402. https://doi.org/10.1080/09669582.2015.1115510
- Hunt, M. A., & Crompton, J. L. (2008). Investigating attraction compatibility in an East Texas City. International Journal of Tourism Research, 10(3), 237–246. https://doi.org/10.1002/jtr.652
- Ito, E., Kono, S., & Gui, J. (2022). Psychological consequences of tourism ideal affect. Current Issues in Tourism, 26(3), 1–12. https://doi.org/10.1080/13683500.2021.2023479
- Kang, S., Lee, G., Kim, J., & Park, D. (2018). Identifying the spatial structure of the tourist attraction system in South Korea using GIS and network analysis: An application of anchor-point theory. Journal of Destination Marketing and Management, 9, 358–370. https://doi.org/10.1016/j.jdmm.2018.04.001
- Kim, E. J., Jo, Y., & Kang, Y. (2018). Are touristic attractions well-connected in an Olympic host city? A network analysis measurement of visitor movement patterns in Gangneung, South Korea. Sustainability, 10(9), 3310. https://doi.org/10.3390/su10093310
- Kim, E. J., & Kang, Y. (2020). Spillover effects of mega-events: The influences of residence, transportation mode, and staying period on attraction networks during Olympic Games. Sustainability, 12(3), 1206. https://doi.org/10.3390/su12031206
- Leask, A. (2018). Contemporary perspectives on visitor attractions. In C. Cooper, S. Volo, W. C. Gartner, & N. Scott (Eds.), The SAGE handbook of tourism management (pp. 299–314). SAGE Publications Ltd.
- Lew, A., & McKercher, B. (2006). Modeling tourist movements. Annals of Tourism Research, 33(2), 403–423. https://doi.org/10.1016/j.annals.2005.12.002
- Li, P. Q., & Kovacs, J. F. (2022). Creative tourism and creative spaces in China. Leisure Studies, 41(2), 180–197. https://doi.org/10.1080/02614367.2021.1948596
- Lue, C. C., Crompton, J. L., & Fesenmaier, D. R. (1993). Conceptualization of multi-destination pleasure trips. Annals of Tourism Research, 20(2), 289–301. https://doi.org/10.1016/0160-7383(93)90056-9
- Matthews, Y., Scarpa, R., & Marsh, D. (2018). Cumulative attraction and spatial dependence in a destination choice model for beach recreation. Tourism Management, 66, 318–328. https://doi.org/10.1016/j.tourman.2017.12.009
- Mossberg, L. (2007). A marketing approach to the tourist experience. Scandinavian Journal of Hospitality and Tourism, 7(1), 59–74. https://doi.org/10.1080/15022250701231915
- Nelson, R. L. (1958). The selection of retail locations. FW Dodge Corporation.
- Park, D., Kim, J., Kim, W. G., & Park, H. (2019). Does distance matter? Examining the distance effect on tourists’ multi-attraction travel behaviors. Journal of Travel and Tourism Marketing, 36(6), 692–709. https://doi.org/10.1080/10548408.2019.1624243
- Paulino, I., Prats, L., & Schofield, P. (2019). Tourist hub consumption systems: Convenient flexibility versus administrative constraint. Journal of Hospitality and Tourism Management, 41, 69–79. https://doi.org/10.1016/j.jhtm.2019.09.006
- Peng, X., & Huang, Z. (2017). A novel popular tourist attraction discovering approach based on geo-tagged social media big data. ISPRS International Journal of Geo-Information, 6(7), 216. https://doi.org/10.3390/ijgi6070216
- Shoval, N., Schvimer, Y., & Tamir, M. (2018). Real-time measurement of tourists’ objective and subjective emotions in time and space. Journal of Travel Research, 57(1), 3–16. https://doi.org/10.1177/0047287517691155
- Tchetchik, A., Fleischer, A., & Finkelshtain, I. (2008). Differentiation and synergies in rural tourism: Estimation and simulation of the Israeli market. American Journal of Agricultural Economics, 90(2), 553–570. https://doi.org/10.1111/j.1467-8276.2007.01112.x
- Thompson, W. (ed.). (2013). Sampling rare or elusive species: Concepts, designs, and techniques for estimating population parameters. Island Press.
- Volchek, K., Liu, A., Song, H., & Buhalis, D. (2019). Forecasting tourist arrivals at attractions: Search engine empowered methodologies. Tourism Economics, 25(3), 425–447. https://doi.org/10.1177/1354816618811558
- Wang, Y., & Fesenmaier, D. R. (2007). Collaborative destination marketing: A case study of Elkhart County, Indiana. Tourism Management, 28(3), 863–875. https://doi.org/10.1016/j.tourman.2006.02.007
- Weidenfeld, A., & Bjork, P. (2016). Visitor attraction marketing and tourism destination branding: Implications for marketing practices. In R. B. A. Weidenfeld, & A. M. Williams (Eds.), Visitor attractions and events: Locations and linkages (pp. 208–225). Routledge.
- Weidenfeld, A., Butler, R. (2016). Visitor Attractions and Events Locations and linkages. Abingdon, UK: Routledge.
- Weidenfeld, A., Butler, R., & Williams, A. W. (2011). The role of clustering, cooperation and complementarities in the visitor attraction sector. Current Issues in Tourism, 14(7), 595–629. https://doi.org/10.1080/13683500.2010.517312
- Weidenfeld, A., Butler, R. W., & Williams, A. M. (2010). Clustering and compatibility between tourism attractions. International Journal of Tourism Research, 12(1), 1–16. https://doi.org/10.1002/jtr.732
- Weidenfeld, A., & Leask, A. (2013). Exploring the relationship between visitor attractions and events: Definitions and management factors. Current Issues in Tourism, 16(6), 552–569. https://doi.org/10.1080/13683500.2012.702736
- Xiao-Ting, H., & Bi-Hu, W. (2012). Intra-attraction tourist spatial-temporal behaviour patterns. Tourism Geographies, 14(4), 625–645. https://doi.org/10.1080/14616688.2012.647322
- Yang, Y., Liu, H., Li, X. R., & Harrill, R. (2018). A shrinking world for tourists? Examining the changing role of distance factors in understanding destination choices. Journal of Business Research, 92, 350–359. https://doi.org/10.1016/j.jbusres.2018.08.001
- Zhou, X., & Chen, Z. (2021). Destination attraction clustering: Segmenting tourist movement patterns with geotagged information. Tourism Geographies, 1–21. https://doi.org/10.1080/14616688.2021.2006769
- Zoltan, J., & McKercher, B. (2015). Analysing intra-destination movements and activity participation of tourists through destination card consumption. Tourism Geographies, 17(1), 19–35. https://doi.org/10.1080/14616688.2014.927523