
ABSTRACT
This study addresses the methodological gap in tourism research regarding the long-term monitoring of tourism activities in urban settings. We propose an analytical framework that uses data from location-based social networks (LBSN) to derive tourists’ digital footprints resulting in a sustained, yet partial, overview of tourist activity and mobility in urban destinations. Significantly, we found that LBSN data might signal changes in the geography of city tourism over time. This study pioneers the use of LBSN data to gain knowledge about city tourism in the longer run, thereby providing a means to review the development of tourism cities. The proposed framework abstracts the geographic dimension of tourism cities and extends spatial analysis to the study of tourism destinations. Moreover, the materials and methods used can be reproduced in other case studies, offering spatial measurements for comparative study, and potentially informing urban planning and design in tourism destinations.
Introduction
The early adoption of novel data sources in the urban sensing paradigm reinforces urban analytics and the rise of data-intensive approaches for the analysis of city tourism. Location-based social network (LBSN) data have been associated with recent research (Chen et al., Citation2021b; Li et al., Citation2018b; Lu & Stepchenkova, Citation2015) promoting the key role of user-generated content (UGC) in understanding tourists’ space–time consumption at different scales of analysis (Batista e Silva et al., Citation2018; Chen et al., Citation2021a; Yuan & Medel, Citation2016). The spatial and temporal signatures embedded in LBSN data (e.g. geotagged photos and tweets) enable the recognition of travel preferences and activity patterns through which practitioners and researchers can access the pulse of tourist cities.
Cross-sectional analysis of tourism cities, based on data from LBSNs (García-Palomares et al., Citation2015) and Airbnb (Adamiak, Citation2018), or by combining conventional statistics with big data sources (Adamiak & Szyda, Citation2022) have demonstrated the increasing usefulness of such alternative data sources for re-examining tourism in urban destinations. Nevertheless, the longitudinal basis of the analysis of urban tourism remains vague, and research on the tourism-related transition dynamics in time and space has been limited. This is a critical issue, particularly in tourism research as well as in urban planning and design, where there is a need to study the changes in tourist destinations (e.g. tourism districts, tourist cities), for instance, to understand the interplay between tourism and urban transformation that fosters changes in certain neighbourhoods.
Tourism statistical yearbooks (e.g. destination-wide tourist numbers, tourist arrivals, and bed nights) have long been the basic channel for interpreting the evolution of tourism destinations in research. Tourism statistics rely heavily on data aggregated at the city level, and the spatial resolution of such data does not provide enough information for detailed analysis at a finer scale (e.g. neighbourhood-level). The aggregated information corresponds to administrative cities, rather than at the intra-destination level. The level of geographic generalization resulting from data availability hinders the ability to draw conclusions about local properties from different spatial locales. A few studies have highlighted the limitations of using such data in the study of destination evolution (McKercher & Wong, Citation2021) as well as in the context of destination design and planning (Beritelli et al., Citation2020; Koens et al., Citation2021), including the choice of spatial units as tourism areas (Hernández-Martín et al., Citation2017). Issues associated with data quality and comparability between units of analysis (e.g. cities, countries) due to the different methodologies and data collection practices by statistical agencies have been discussed. In urban geography, yearbook data have also been criticized, mainly for their temporal and spatial resolution and lack of informational richness (Long et al., Citation2018).
Ongoing scholarly debate in tourism research (Assaf et al., Citation2022; Shoval, Citation2018) suggests the need to develop materials and methods for monitoring urban destinations. An unexplored approach is using digital footprints from LBSN to provide a sustained overview of city tourism. LBSN data covers longer periods and can capture long-term patterns (Huang & Wong, Citation2015), for it includes user activities, as well as continuous motion, and for relatively long periods compared to more conventional data collection procedures. These kinds of data preserve their real-time structure, but their temporal frequency is beyond real-time actions and motion (Batty, Citation2013; González-Bailón, Citation2013; Kitchin, Citation2014). Many photo-sharing services (e.g. Flickr, Weibo, Instagram, etc.) and micro-blogging platforms (e.g. Twitter) have already led to massive repositories of community-contributed geotagged data that include users’ digital footprints for years. Likewise, LBSN data have contributed to the study of tourism-related activities and venues outside tourism districts (see e.g. Encalada et al., Citation2017; Salas-Olmedo et al., Citation2018), which overlap with the everyday urban experience (Ba et al., Citation2021).
There is a growing body of research exploring the temporal heterogeneity of tourist behaviour in different settings (Jin et al., Citation2018; Vu et al., Citation2015; Vu et al., Citation2018). Other studies are merely engaged in assessing the spatial patterns of tourism consumption, mostly supported by data-driven applications to identify areas of tourist concentration and related points-of-interest (Casado-Díaz et al., Citation2021; Encalada et al., Citation2017; Salas-Olmedo et al., Citation2018) and to differentiate the mobility patterns from that of locals (Li et al., Citation2018a; Liu et al., Citation2018; Paldino et al., Citation2016). Several authors have validated the usefulness of using LBSN data to delineate tourism districts (Shao et al., Citation2017; Zhou et al., Citation2015) and to render large-scale destination systems (Kádár & Gede, Citation2021). More recently, datasets consisting of LBSN data were used to explore structuring patterns in destination systems and to demonstrate how urban tourism was organized spatially over time (Encalada-Abarca et al., Citation2022). However, studies that process LBSN data for periods longer than a few years are scarce.
The use of LBSN data to generate insights into the long-standing nature of urban tourism in many cities has been relatively limited to date. In this study, we address the need for a more detailed analysis focused on city tourism from the perspective of tourism demand. Furthermore, we elaborate on the value of using LBSN data to reflect on city tourism in the longer run.
Our contribution presents research conducted in Lisbon and proposes an application of the use of LBSN for conducting a long-term overview of tourism cities. We champion the idea that LBSN provides long-term data suitable for tourism research. To illustrate this in the analysis of city tourism, we introduce yearly data from tourists’ digital footprints for an extended period. First, we used geotagged data from Flickr and Twitter to derive a long array of spatial signatures from tourism-related activities and tourist flows. Then, we conducted a multitemporal analysis to evaluate changes in the spatial distribution of city tourism and, more precisely, to understand how the geographic dimension of city tourism changes over time, thereby providing the means to assess tourism development in cities.
An exploratory analysis was conducted on several years of data using Flickr (2007-2017) and Twitter (2018-2019) datasets. LBSN data from Flickr and Twitter have been previously used as proxies to reflect on tourism demand and the spatial concentration/dispersal of city tourism to explore, for example, the overall attractiveness of tourist destinations (Giglio et al., Citation2019; Paldino et al., Citation2015; Preis et al., Citation2020). This study demonstrates that LBSN data can facilitate long-term measurements and model applications of tourism-related activities in complex urban settings, including mobility patterns, with implications for deepening research on tourism development and destination evolution as key topics in the fields of tourism geography and urban studies.
Materials and methods
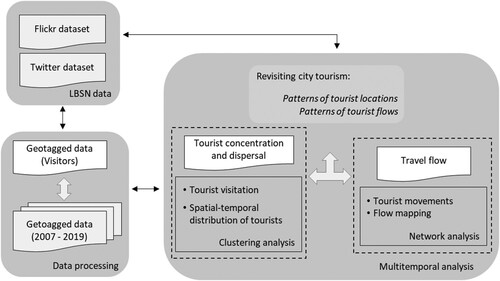
shows the analytical framework adopted in this study. First, we conduct a comparative analysis of the Flickr-based dataset and the hotel occupancy rates retrieved from the City Tourism Observatory (Observatório Turismo de Lisboa, Citation2018) and present the preliminary results, including statistical tests of correlation to determine consistency with respect to the monthly statistics of in-bound (city) tourists. Second, we illustrate the expansion of urban tourism over space based on an analysis of the physical dimension of tourist hot spots. A spatiotemporal clustering analysis was applied to identify meaningful areas of tourist concentration and their changes over time. Third, we evaluated the changes in tourist flows across the urban space using flow networks that were reconstructed based on tourist movement between parish areas. To assess flow patterns, we computed a set of centrality measures on the tourist flow networks from which we derived an interpretation of tourism destinations (e.g. the tourist city) based on the spatial interaction of distinct urban areas with touristic appeal.
Figure 1. Analytical framework to interpret changes in tourism destinations based on data from LBSN.
Flickr data
Flickr data was retrieved using Flickr API. The dataset contained more than 300,000 geotagged photos, including attributes such as photo title, user ID, photo ID, geolocation coordinates, and timestamps. The information related to the photos’ timestamps (i.e. the date when the picture was created) guided the segmentation of photos taken by either locals or visitors. For each user, the number of days between the first and last uploaded photo was computed. All photos associated with users who remained active within the city boundaries for a maximum of three days were considered as belonging to visitors. Otherwise, the photos were considered as belonging to locals and were not included in the analysis. The number of days between photos served as an indication of user activity, while the limit of days corresponded to the average length of stay for international tourists in Lisbon. According to Statistics Portugal, the average length of stay for international guests has not changed significantly between 2012 and 2017 and corresponds to approximately 2.6 nights (Instituto Nacional de Estatística [INE], Citation2017). Repeat users with photos in more than one year were removed from the dataset. This approach based on photo timestamps may include some local users who uploaded photos just once. Additionally, it excluded visitors who stayed for a longer period and other temporary city users. Nonetheless, as demonstrated by previous research (Encalada et al., Citation2017; Kádár, Citation2014), time-based classification is useful when user profile information is unavailable.
After segmentation, approximately 83,000 photos belonging to 10,300 visitors from 2007 to 2017 were included in the analysis.
Twitter data
Twitter data was retrieved using Twitter API. The dataset contained more than 43,000 geotagged tweets, including attributes like user ID, tweet ID, geolocation coordinates, tweet text, and timestamps. After the filtering process, the Twitter dataset included 17,880 geotagged tweets, corresponding to 3,887 and 2,380 users considered as visitors in 2018 and 2019, respectively. Visitors were designated based on the information availability of the user profiles, including the time zone and country and, therefore, data filtering excluded local users and their tweets. Tweets from users with no location information available in their profiles were excluded from the analysis.
Temporal analysis of the Flickr-based estimates of city tourists
We tested whether the monthly estimates from LBSN users matched the temporal trends of tourist visits to Lisbon. A correlation analysis was conducted between the visitor counts derived from Flickr, and the hotel occupancy rates retrieved from the City Tourism Observatory (Observatório Turismo de Lisboa, Citation2018). The number of Flickr users tagged as visitors were aggregated monthly and by year, using data from 2012 to 2017. Pearson correlation coefficients were used for statistical significance, quantified separately for each year. The Pearson correlations were also tested using linear regressions and F-tests.
Evaluating city tourism based on tourist location patterns
Spatiotemporal clustering analysis
Point features, representing the geolocation of visitors, were aggregated into a space–time cube, using a regular grid with areal units of ∼8500 m2, and a 12-month time window for each bin (i.e. space–time cube units). The value assigned to each bin corresponded to the number of visitors within its temporal and spatial extents. Data aggregation was built on the number of visitors instead of the number of photographs in a specific bin. This was done to mitigate the bias in locations having a high rate of photographs per user. The spatiotemporal clustering analysis was based on Flickr data from January 2007 to December 2017. In total, 11 time-step intervals were included in the space–time cube. For each time-step, 2740 bins covered the spatial distribution of visitors across the Lisbon area. The number of bins remained the same for all time-step intervals, even if a bin was empty in a given time-step. This approach also facilitated the visualization of descriptive statistics.
To determine the global temporal pattern in the aggregated dataset, a Mann–Kendall (MK) test (Kendall, Citation1970) was performed to assess whether there was a monotonic ascending or descending statistical trend of visit frequencies over time. Moreover, the analysis of visitors’ digital footprints from 2007 to 2017 was based on a space–time implementation of the Local Moran statistic (Anselin, Citation1995), using the ArcGIS Pro 2.5 emerging hot spot analysis toolbox. This method analyzes the spatial autocorrelation of a given bin, including its space–time neighbours. The parameters for the spatial and temporal neighbourhood define the number of neighbours for each bin. Therefore, to determine whether a bin is part of a cluster, the bin is evaluated together with its space–time neighbours. The neighbouring area indicated by a distance threshold d was set to 200 m. This cut-off distance (d) spatially excludes some isolated units (e.g. for the 10th time-step, 3.5% of the total units have < 1 neighbour), but also avoids having many neighbours and thus a loss of variability. Neighbours within a temporal frame of three time-step intervals were considered to run the analysis. The clusters and outliers were considered statistically significant at a (pseudo) p–value = 0.001. For instance, spatially agglomerated features with similar high or low values are denominated as high–high (HH) or low–low (LL) clusters, respectively. It also allowed for the identification of outliers, such as bins with high values surrounded by bins with low values, denominated as high–low (HL).
For the visual representation, the resulting clusters were classified into five categories. Locations with HH patterns in more than 70% of the time-step intervals were called consecutive. Mid-term consecutive clusters are locations demonstrating a significant HH trend for 50%–60% of the overall time-steps (aligned with the recent years). Clusters with no previous significant pattern but with a recent HH clustering trend in at least two of the four recent years are denominated as new. The intensifying clusters correspond to locations with a previous trend (e.g. LL and HL) that became HH in the last two years. The sporadic spots represent mixed patterns throughout the years. This category refers to locations that were identified as LL, HL, or LH in approximately 50% of the overall time-steps.
Evaluating city tourism based on tourist flow patterns
Mapping tourist flows and network analysis
Tourist flows can be explored by mapping individual movements between nodes, such as administrative areas (e.g. parish areas, census blocks, etc.), or any other reference grid. The tracks depicting tourist movements from one parish to another were systematically aggregated using an OD matrix that evaluated the volume and direction of movements between parishes (Li et al., Citation2021). The city of Lisbon encompasses 24 parishes. The flow mapping between parishes is based on the temporal references of user photos, and user trips were aggregated based on parish areas. Visitor movements within a single parish were not considered to feed the OD matrix, since these traces did not represent inter-parish movements. Only visitors whose photos were located in at least two parishes were included in the analysis. The flow mapping encompasses user movements between parish areas that correspond to 2,697 and 788 visitors from Flickr and Twitter, respectively.
Next, flow networks between parish areas were reconstructed using the OD matrix. The network structure depends on the spatial interactions between nodes, where the nodes are practically significant in the overall tourist flow reflected in their corresponding statistical indicators. In the networks, parishes are represented as nodes linked by bidirectional tourist flow (otherwise referred to as edges). The edges were weighted by the flow of tourists between parish areas. The following network metrics (Borgatti, Citation2005) were calculated for each node: degree centrality, betweenness, and eigenvector centrality. Degree centrality corresponds to the number of nodes that an individual node relates to. Further, it measures the total connections a node has. Betweenness consists of the number of shortest paths that flow through a node, providing a measure of its importance in the flow moving from one part of the network to another. Finally, eigenvector centrality quantifies the importance of a node, while also considering the importance of its neighbours, and provides a measure of a node’s influence in a network. Flow mapping and network analysis rely on data from Flickr and Twitter. To grasp the evolution of each node throughout the years, centrality measures were separately applied to the flow networks for 2010, 2013, 2017, 2018, and 2019.
Results
Temporal variation in the Flickr-based estimates of visitors and visitor photos
The yearly variation of the photos is irregular, with a high standard deviation. The average number of photos per year is approximately 7,865. The number of photos for each month varies significantly along the time-series (e.g. for February, May, and June), as shown by the interquartile range (). At a yearly timescale, the number of visitors shows smaller variation compared to the number of user photos (mostly evidenced from 2011 to 2016). There is an increasing trend in the number of visitors until 2014, while the last year’s value is below the annual average (907 users). The monthly values show three peaks in May, August, and September (). In general, the density distribution (violin plots) shows greater amplitude in recent years and is stronger for these three months.
Figure 2. Monthly distribution (ln) along the time-series for tourists (left) and tourists' photos (right). Black dots correspond to the monthly values by year, and the red dots refer to the mean values.
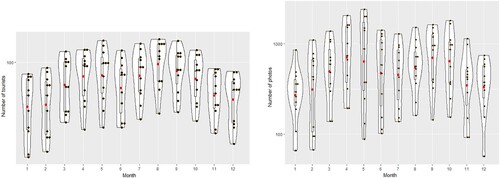
The differences in the distribution of photos and visitors illustrate that the total number of photos may vary regardless of the number of visitors. Considering the overall count of visitors and photos, the ratio of photos per tourist is around 8.6. When calculated for each year, the results indicate an upward trend (interrupted in 2013), ranging from 4.5–14.3.
A similar trend is observed between the seasonal patterns of visitors and hotel occupancy rates. Visitors estimates from Flickr show the same peaks in the two semesters (in May, August, and September) following tourism seasonality as evidenced by accommodation rates (Observatório Turismo de Lisboa, Citation2018). Roughly, there appears to be a significant positive correlation between the two time-series (). Although the resulting correlation coefficients in 2012 and 2015 are not as high as in the other years, there is evidence that the estimates correlate strongly with powerful significance at a level of p < 0.001. The linear regressions used to test the Pearson correlations show medium and high coefficients of determination with high statistical significance for four of the six years. Additionally, the results from the F-test and its low statistical significance values () suggest insufficient evidence to reject H0 (ratio of variances is equal to 1). Therefore, the data distributions for both time-series regarding monthly tourist visitation within the destination show similar variances.
Table 1. Pearson correlation (r), coefficients of determination, F-test, and significance level between monthly visitor counts from Flickr and monthly hotel occupancy rates from 2012 to 2017.
Tourism expansion and intensification in urban settings
The observed pattern in the space–time cube reveals an ascending trend for the visitor frequencies (MK Test = 6.311) in accordance with the statistics that consider users as visitors ( and ). The overall clusters represent agglomerations rooted in three main areas ( and ) and overlap the major attractions located in the following neighbourhoods and urban places: Belém (southwest); Terreiro do Paço, Bairro Alto, and Castelo (city centre); and Parque das Nações (northeast). The number of adjacent clusters suggests that there is a greater spatial agglomeration of tourist activities in the city centre and southern areas of Lisbon, where a long-lasting trend of HH clustering was detected. In contrast, sporadic clusters appear as satellites, revealing a relatively smaller area that strictly overlaps the target places, such as those located in Alcântara (e.g. LxFactory) or within inner-city districts (e.g. Ajuda Botanical Garden, Campo Pequeno Square, Lisbon Zoo). Moreover, other places with a defined functional use, such as transport facilities, major avenues, and neighbourhoods primarily composed of commercial buildings can be clearly identified (e.g. Saldanha, Sete Rios Station, Almirante Reis Avenue, and Alcântara-Mar Station). The identification of such areas is remarkable because they represent target areas disconnected from mainstream tourism cores, which are also embedded in the city’s tourism system.
Figure 3. Spatial distribution of city tourists in Lisbon based on Flickr data. The figure shows Flickr-based estimates of visitors in each specific area (grid cell) by year (2007, 2010, 2014, and 2017).
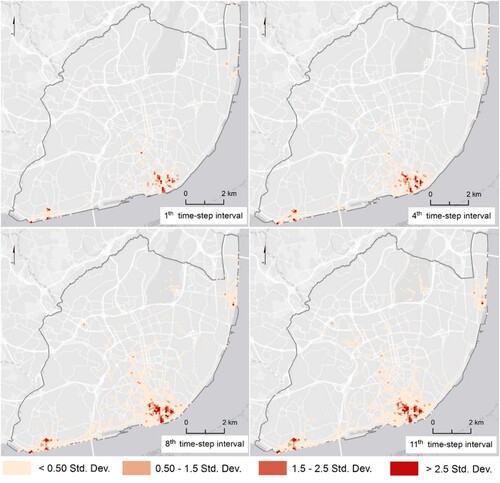
Figure 4. Group categories from spatiotemporal clustering.
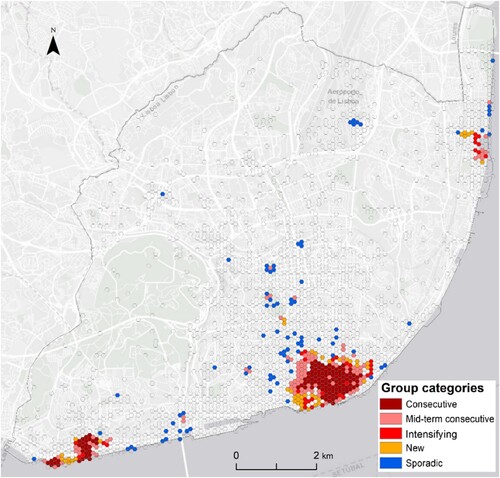
Table 2. Descriptive statistics of aggregated data with reference to the space–time cube.
Digital footprints from Flickr offer evidence of visitor pressure among different urban areas, and the spreading of visitors to ‘new’ urban destinations was verified. Some new HH clusters joined the São Vicente neighbourhood (e.g. overlapping the National Pantheon) next to the Graça and Alfama neighbourhoods, suggesting an expansion of tourist activities and tourists’ space–time consumption of the urban space in the city centre. Some descriptive statistics for the group categories regarding the frequency of visits throughout the analysis years are shown in .
Table 3. Descriptive statistics of the group categories from spatiotemporal clustering.
The temporal trend in most clusters reveals a consecutive pattern over time (i.e. the visit frequencies seem to be uninterrupted within those locations). Accordingly, some regularity along the time-step intervals is verifiable in touristic areas (e.g. Belém Tower, Rossio and Restauradores Squares, Santa Justa Lift, and Saint George Castle) where the strength of the spatial concentration of city tourists is relatively high compared to that in the neighbouring areas (). Furthermore, the HH clusters identified in the peripheral areas prove the emergence of novel areas of tourist attractiveness. For instance, the results suggest the development of some urban areas with touristic appeal, located near the Benfica and Avenidas Novas neighbourhoods, where some changes in land-use configuration may have taken place during this period, such as the introduction of transportation modes, attractions and accommodation.
While we primarily focused on the alleged tourism cores, the areas featuring a mid-term consecutive pattern are equally noteworthy. These clusters serve as evidence of the fuzzy transition (in time and space) of city tourism across the urban fabric. Those features, categorized as mid-term consecutive spots, surround the boundaries of larger clusters and act as a transitional zone from a consecutive pattern to a more sporadic one. Additionally, the spatial distribution of clusters featuring an intensifying trend, as well as those categorized as new, implies that tourist activity is not only spatially constrained to the alleged tourism districts (). Instead, these clusters illustrate a process of tourism expansion towards areas adjacent to the tourism cores in the most recent years.
Visitor flows in tourism cities
shows the spatial and temporal distribution of the tourist flows based on data from Flickr and Twitter. Flow mapping indicates that parishes overlapping the neighbourhoods of Baixa–Chiado, Alfama–Castelo–Mouraria, and Belém depict a stronger spatial interaction with each other than with the remaining parishes. The greater visitor flows between these parish areas may be influenced by several key factors, such as the availability of transport and accommodation facilities, and by the spatial concentration of tourist attractions near the southern riverside. As expected, the tourist movement is more concentrated in the city centre. Empirical evidence indicates an increasing flow passing by the Marquês de Pombal-Historic nucleus axis proceeding to the southwest part of the city.
Figure 5. Tourist flows between parish areas in Lisbon, based on movement data derived from Flickr (2010, 2013, and 2017), and Twitter (2018, and 2019). The figure shows the resulting scores from centrality measures computed for each parish area.
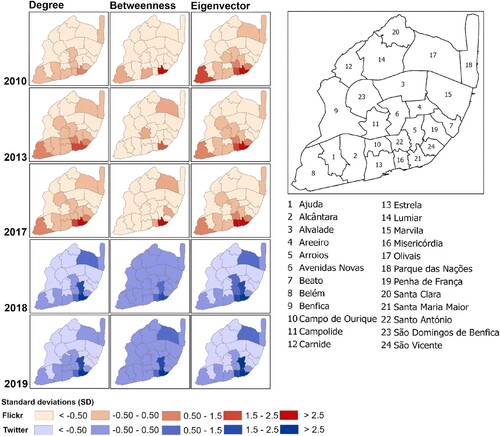
While broad distributions of tourism flows have been observed at the intra-urban level, we could highlight the similarities and differences in the most recent years by evaluating the yearly comparison. The historical tourist nucleus is an anchor for the city system of tourist flows (). The Santa Maria Maior, Misericórdia, and São Vicente parishes are the top central nodes, becoming the core parishes of the tourist flow networks, and play an important role in the integration and distribution of tourist flows. Centrality measure scores and their comparison over years confirm their strategic role in intra-destination mobility. Significantly, the outcomes from the network metrics suggest a tendency towards the homogenization of tourist flows in which parishes in the city centre and Belém seem to be more connected and attractive, whereas the northeast parishes possess a secondary and complementary role.
Discussion
The social media-based data feed has proved useful for monitoring tourist activities at a destination. LBSN data have yielded several advantages for the quantitative interpretation of tourist activity and mobility and tourist place consumption at different scales of analysis—from tourist sites to tourism districts— as well as for determining city-wide and regional patterns (Batista e Silva et al., Citation2018; Encalada-Abarca et al., Citation2022; Hamstead et al., Citation2018). However, few studies offer a longitudinal overview of how city tourism is situated in space (and time). Here, we argue that LBSN data is an important tool to analyze city tourism in the longer run. This study offers an alternative approach to revisit city tourism using a multitemporal analysis of LBSN data derived from Flickr and Twitter.
Together with previous empirical research, our findings show that LBSN data can support the assessment of tourist activity in urban settings (Encalada et al., Citation2017; Jin et al., Citation2018; Li et al., Citation2018a; Martí et al., Citation2021). This study demonstrates that the spatial distribution of city tourists reflects a long-lasting trend that alternates patterns of continuity—that often portray spatial concentration with varying intensity— and fragmentation. Tourism places act as continuous foci for visitors over a lengthy time span, displaying consistently higher frequencies of tourist visits. Non-locals are abundantly present within these cores, whereas their vicinities experience lower but steady tourist activity. The spatial distribution patterns of city tourism in Lisbon obtained from LBSN data seem to be consistent with the results from previous studies (Barata-Salgueiro et al., Citation2017; Sequera & Nofre, Citation2020), showing an increase in tourist space–time consumption in central neighbourhoods. Accordingly, our results support earlier empirical research suggesting a high concentration of tourism-driven activities (e.g. local lodging) in urban areas located in downtown Lisbon near the Alfama neighbourhood (Amore et al., Citation2022; Cocola-Gant & Gago, Citation2021). Similarly, Encalada-Abarca et al. (Citation2022) provide evidence of the expansion of tourism-related activities across several urban areas in Lisbon city, in line with the results obtained from evaluating city tourism based on LBSN data.
Significantly, the multitemporal analysis of city tourism demonstrates that tourist hot spots and distinct urban places within their proximities operate under a long–term—though not always continuous—relationship, even when spatially disconnected. This enables us to highlight some consolidated urban areas rooted in the geographies of city tourism as well as the fuzzy expansion of tourism activities across the urban fabric. Based on the analysis of long-term data derived from LBSN, this study underlines that the intensification of tourist activity is not completely spatially constrained to discrete areas (e.g. tourism districts). The identification of latent areas beyond the boundaries of the alleged tourism cores, generally associated with other functional land uses, is also important, demonstrating that eligible areas with tourist-like appeal may emerge on the periphery and near marginalized urban areas. Future studies on tourism-induced urban changes at the neighbourhood scale may focus on urban areas where LBSN data indicates an increase in visitor pressure over time.
Reconstructing visitor trajectories enables us to map the city system of tourist flows. By quantifying tourist movements between parishes, we could identify tourist flow patterns. A descriptive analysis of the network metrics shows that the parishes located downtown are more strongly connected with the urban areas located in the south than in the north. More broadly, the results indicate a homogeneous pattern over time, suggesting that tourism is consolidated into three main cores, thus indicating a polycentric structure. The findings also provide insights into new dynamics in the pulse of tourist cities, revealing venues and places that overlap with the everyday urban experience, some of which are particularly popular among tourists and locals alike (Ba et al., Citation2021). Tourist mobility and activities embedded in the urban experience reconfigure the spatial relationship between tourism centres and peripheral areas, as well as the spatial configuration of tourist destinations and the geographies of tourism in cities (Encalada-Abarca et al., Citation2022). The advent of city tourists and other temporary city users have shaped the way cities have evolved together with tourism mobilities (Milano et al., Citation2023).
LBSN data partially represents tourism demand; we are aware of over-representation of specific groups of people among the total tourist population. LBSN data is biased by platform popularity among users, and the volume of data may vary by country, year, and demographic. Furthermore, bias associated with highly engaged users can lead to the overrepresentation of such a population. Thus, concerns about underestimating or overestimating certain demographics in social media data (Jiang et al., Citation2019; Niu & Silva, Citation2023) and the unequal digital representation of places (Ferreira et al., Citation2021) remain. Ongoing scholarly debates on the digital divide assert the need to explore this divide’s implications (H. Huang et al., Citation2021; Xu et al., Citation2020).
There are several methods for differentiating LBSN users between tourists and locals, as well as for deriving LBSN-based estimates of the number of tourists visiting a destination while providing a reliable proxy for empirical visitation rates (Chen et al., Citation2021b; Mor et al., Citation2023). Some studies have tested data from Flickr, Twitter, and Instagram to derive urban park visitation rates and explore the local popularity of city parks (Hamstead et al., Citation2018; Song et al., Citation2020), and estimate the actual tourist numbers at the city level (Önder et al., Citation2016). Flickr-based estimates from international users showed a positive correlation with the statistics of overnight stays in 16 European cities, including Lisbon (Kádár, Citation2014), with official statistics of international tourists in China (Su et al., Citation2016), and with official visitor arrival statistics for the G7 countries (Preis et al., Citation2020). In our study, Flickr-based visitor estimates are positively correlated with the monthly hotel occupancy rates from the City Tourism Observatory. Our results suggest that this correlation remains positive throughout all years assessed. These findings indicate that Flickr data serve to evaluate the monthly distribution of city tourists; however, future studies should confirm whether this relationship applies to other (urban) destinations. Exploring this correlation is a likely first step towards more robust tourism estimates derived from novel data sources (see e.g. Adamiak & Szyda, Citation2022). Moreover, these studies contribute to demonstrating how LBSN data can inform on tourist activity, complementarily to traditional statistical sources that are unsuitable for fine–grained spatiotemporal analysis of city tourism.
The massive repository offered by photo-sharing, instant messaging, and micro–blogging services has a unique potential, for it maps digital footprints that go back several years. It is crucial to map the popularity of LBSN as a possible source of bias, and how it may have compromised the reliability of Flickr/Twitter-based estimates as signals of tourist spatial–temporal behaviour. However, as shown by the space–time cube, tourists’ digital footprints (from Flickr) over the years were not influenced by a likely decline in users. The usability of LBSN data as a proxy for visitation depends on temporal granularity; this study shows that LBSN data perform fairly well on a monthly basis. This conclusion was also validated for nature–based tourism destinations (see e.g. Barros et al., Citation2020; Mancini et al., Citation2018). However, the scarce usage of Flickr or Twitter in a given destination may limit the conclusions drawn from these datasets. This study provides an analytic framework, reproducible for multiple sources of LBSN, including different platforms that are more popular in other tourist destinations. One of the positive aspects of the social media ecosystem is the opportunity to gather data from different LBSNs possessing digital footprints with equivalent spatial and temporal resolution. Future attempts should consider the use of mixed data from related sources (such as Instagram, Foursquare, and Weibo), which have been proven to be valuable information sources, to understand tourist activities in many destinations (Liu et al., Citation2018; Tenkanen et al., Citation2017; Vu et al., Citation2020). Drawing on multiple data sources in parallel diminishes reliance on a single service, and data overlap from several LBSNs provides further granularity for the analysis of city tourism (Encalada-Abarca et al., Citation2022; Salas-Olmedo et al., Citation2018).
This study explored the suitability of LBSN data for the long-term monitoring of tourism activities in urban settings, with implications for advancing the study of the spatial organization of tourism in cities, the nature of tourist (spatiotemporal) behaviour and tourist flows, and the spatial association between destinations. A broader generalization of these results may be possible by comparing the space–time patterns of tourists in different cities and other urban destinations. While (as mentioned earlier) shortcomings in using such data (Haklay, Citation2013; Niu & Silva, Citation2023; Steiger et al., Citation2015) remain, it is important to look beyond UGC on social media, even when it is the focus of a given study (Crampton et al., Citation2013; L. Li et al., Citation2013). Our view does not suggest that monitoring city tourism must rely on a single data source or on LBSN data alone. Instead, we advocate for the benefits of revisiting tourist space–time consumption and tourist activity and mobility by analyzing digital footprints from social media. Our study promotes the use of LBSN data to obtain a sustained, yet partial, overview of city tourism and its (often) geographical biases. Nonetheless, this study only provides an early contribution to understanding the generalized patterns of tourism and (urban) space consumption over time.
Conclusion
The findings of this study are twofold. First, we addressed a methodological gap in current applications of LBSN data, providing an alternative research avenue to generate insights about city tourism over space and time. The use of LBSN data was suitable for exploring tourism geographies and understanding tourism intensification, ‘touristification’ and ‘over-tourism’ in cities. Although using such data for tourism research calls for the careful consideration of data quality, digital footprints derived from LBSN data capture meaningful features and fine-grained attributes of the geographic dimension of tourism cities. We proposed an analytical framework that used LBSN data as an alternative tool to evaluate changes in tourism places (e.g. tourism districts) and in urban systems, therefore articulating LBSN data’s potential in urban sensing. Individual and contextual data embedded in UGC and social media, and the spatial and temporal resolution from information on such datasets, opened the prospect for a more in-depth urban tourism analysis in the longer run. It was suggested that the LBSN data volume should be retained and summarized so that they may form assets for tourism research. This study advances the current framing of LBSN data applications, mainly in terms of how tourists’ digital footprints translate into spatial and temporal signatures for the study of tourism dynamics over the long term. Second, the proposed framework abstracted the geographic dimension of tourism cities and extended some methods of spatial analysis to the study of tourism destinations. Our findings revealed some transition dynamics that had been long sought after in urban tourism research. Based on LBSN data analysis, an empirical interpretation was developed of i) the spatial agglomeration of tourism-related activities in urban settings, including the consolidation of tourist hot spots; ii) the expansion of tourism activities over urban space; and iii) the homogenization of tourist flows in tourism cities. Thus far, by observing the digital footprints describing visitors’ itineraries, we could verify the uneven spatial distribution of city tourism and how it differed over time (e.g. changes in the spatial concentration of tourism-related activities and tourist flows over the years).
A drawback in implementing this analytical framework relates to the segmentation of digital footprints between international and domestic tourists. The current framework presents a classification scheme based on tourists and locals, but it would be valuable to extend the classification to three classes of users (e.g. international tourists, domestic tourists, and locals). An additional limitation of this kind of data is that there is no detailed information on the socio-economic and demographic profile of the tourists. Furthermore, the reconstruction of visitor trajectories and itineraries based on LBSN data is much coarser than tracking trajectories obtained by positioning loggers, since the photos taken and shared by the users may not be continuous in time.
The potential applications of this analytical framework are aligned with research practices focused on data mining, pattern detection, and computational models such as machine learning, simulation, and prediction. Further applications should broaden the focus of urban tourism study in novel ways, taking advantage of the detail offered by such datasets. It may include studying the interplay between long–range and short–range tourism dynamics in urban settings. The data that inform about tourism demand and its context may help operationalize models and core concepts in tourism research that describe the evolution of tourist destinations (see e.g. Tourism Area Life Cycle). The LBSN data analysis depicts regular or systematic activity patterns relevant to many planning decisions and policy formulations. Alternative applications of long-term data include the collection of evidence and ex-post evaluations of specific policy interventions in tourist destinations. The methods used in this research are likely to be replicated in other case studies, using different datasets and periods.
Future research should investigate how LBSN data can be combined with large-scale survey data, along with other long-lasting material measures of the urban spatial structure, such as population, employment, and housing, as well as with traditional tourism statistics to revisit city tourism in the longer run. The multiple data integration and analysis contributes to the validation and quality assurance of the data and analytical results. With careful adaptation, mobile phone network data, and other transaction data generated by online operations, including that of web search, booking, and shopping, could be incorporated in similar formats for city tourism analysis.
Acknowledgements
The GEOMODLAB (Laboratory for Remote Sensing, Geographical Analysis and Modelling) of the Centre of Geographical Studies/ Institute of Geography and Spatial Planning provided the computational infrastructure support for this research.
Disclosure statement
No potential conflict of interest was reported by the author(s).
Correction Statement
This article has been corrected with minor changes. These changes do not impact the academic content of the article.
Additional information
Funding
References
- Adamiak, C. (2018). Mapping Airbnb supply in European cities. Annals of Tourism Research, 71, 67–71. https://doi.org/10.1016/j.annals.2018.02.008
- Adamiak, C., & Szyda, B. (2022). Combining conventional statistics and big data to map global tourism destinations before COVID-19. Journal of Travel Research, 61(8), 1848–1871. https://doi.org/10.1177/00472875211051418
- Amore, A., de Bernardi, C., & Arvanitis, P. (2022). The impacts of Airbnb in Athens, Lisbon and Milan: A rent gap theory perspective. Current Issues in Tourism, 25(20), 3329–3342. https://doi.org/10.1080/13683500.2020.1742674
- Anselin, L. (1995). Local indicators of spatial association-LISA. Geographical Analysis, 27(2), 93–115. https://doi.org/10.1111/j.1538-4632.1995.tb00338.x
- Assaf, A. G., Kock, F., & Tsionas, M. (2022). Tourism during and after COVID-19: An expert-informed agenda for future research. Journal of Travel Research, 61(2), 454–457. https://doi.org/10.1177/00472875211017237
- Ba, C., Frank, S., Müller, C., Laura Raschke, A., Wellner, K., & Zecher, A. (2021). The power of new urban tourism: Spaces, representations and contestations (1st ed.). Routledge.
- Barata-Salgueiro, T., Mendes, L., & Guimarães, P. (2017). Tourism and urban changes: Lessons from Lisbon. In M. Gravari-Barbas & S. Guinand (Eds.), Tourism and gentrification in contemporary metropolises: International perspectives (pp. 255–275). Routledge.
- Barros, C., Moya-Gómez, B., & Gutiérrez, J. (2020). Using geotagged photographs and GPS tracks from social networks to analyse visitor behaviour in national parks. Current Issues in Tourism, 23(10), 1291–1310. https://doi.org/10.1080/13683500.2019.1619674
- Batista e Silva, F., Marín Herrera, M. A., Rosina, K., Ribeiro Barranco, R., Freire, S., & Schiavina, M. (2018). Analysing spatiotemporal patterns of tourism in Europe at high-resolution with conventional and big data sources. Tourism Management, 68, 101–115. https://doi.org/10.1016/j.tourman.2018.02.020
- Batty, M. (2013). Big data, smart cities and city planning. Dialogues in Human Geography, 3(3), 274–279. https://doi.org/10.1177/2043820613513390
- Beritelli, P., Reinhold, S., & Laesser, C. (2020). Visitor flows, trajectories and corridors: Planning and designing places from the traveler’s point of view. Annals of Tourism Research, 82, 102936. https://doi.org/10.1016/j.annals.2020.102936
- Borgatti, S. P. (2005). Centrality and network flow. Social Networks, 27(1), 55–71. https://doi.org/10.1016/j.socnet.2004.11.008
- Casado-Díaz, A. B., Navarro-Ruiz, S., Nicolau, J. L., & Ivars-Baidal, J. (2021). Expanding our understanding of cruise visitors’ expenditure at destinations: The role of spatial patterns, onshore visit choice and cruise category. Tourism Management, 83, 104199. https://doi.org/10.1016/j.tourman.2020.104199
- Chen, J., Becken, S., & Stantic, B. (2021a). Harnessing social media to understand tourist mobility: The role of information technology and big data. Tourism Review, 77(4), 1219–1233. https://doi.org/10.1108/TR-02-2021-0090
- Chen, J., Becken, S., & Stantic, B. (2021b). Using Weibo to track global mobility of Chinese visitors. Annals of Tourism Research, 89, 103078. https://doi.org/10.1016/j.annals.2020.103078
- Cocola-Gant, A., & Gago, A. (2021). Airbnb, buy-to-let investment and tourism-driven displacement: A case study in Lisbon. Environment and Planning A: Economy and Space, 53(7), 1671–1688. https://doi.org/10.1177/0308518X19869012
- Crampton, J. W., Graham, M., Poorthuis, A., Shelton, T., Stephens, M., Wilson, M. W., & Zook, M. (2013). Beyond the geotag: Situating ‘big data’ and leveraging the potential of the geoweb. Cartography and Geographic Information Science, 40(2), 130–139. https://doi.org/10.1080/15230406.2013.777137
- Encalada, L., Boavida-Portugal, I., Cardoso Ferreira, C., & Rocha, J. (2017). Identifying tourist places of interest based on digital imprints: Towards a sustainable smart city. Sustainability, 9(12), 2317. https://doi.org/10.3390/su9122317
- Encalada-Abarca, L., Ferreira, C. C., & Rocha, J. (2022). Measuring tourism intensification in urban destinations: An approach based on fractal analysis. Journal of Travel Research, 61(2), 394–413. https://doi.org/10.1177/0047287520987627
- Ferreira, D., Vale, M., Miguel Carmo, R., Encalada-Abarca, L., & Marcolin, C. (2021). The three levels of the urban digital divide: Bridging issues of coverage, usage and its outcomes in VGI platforms. Geoforum; Journal of Physical, Human, and Regional Geosciences, 124, 195–206. https://doi.org/10.1016/j.geoforum.2021.05.002
- García-Palomares, J. C., Gutiérrez, J., & Mínguez, C. (2015). Identification of tourist hot spots based on social networks: A comparative analysis of European metropolises using photo-sharing services and GIS. Applied Geography, 63, 408–417. https://doi.org/10.1016/j.apgeog.2015.08.002
- Giglio, S., Bertacchini, F., Bilotta, E., & Pantano, P. (2019). Using social media to identify tourism attractiveness in six Italian cities. Tourism Management, 72, 306–312. https://doi.org/10.1016/j.tourman.2018.12.007
- González-Bailón, S. (2013). Big data and the fabric of human geography. Dialogues in Human Geography, 3(3), 292–296. https://doi.org/10.1177/2043820613515379
- Haklay, M. (Muki). (2013). Neogeography and the delusion of democratisation. Environment and Planning A: Economy and Space, 45(1), 55–69. https://doi.org/10.1068/a45184
- Hamstead, Z. A., Fisher, D., Ilieva, R. T., Wood, S. A., McPhearson, T., & Kremer, P. (2018). Geolocated social media as a rapid indicator of park visitation and equitable park access. Computers, Environment and Urban Systems, 72, 38–50. https://doi.org/10.1016/j.compenvurbsys.2018.01.007
- Hernández-Martín, R., Rodríguez-Rodríguez, Y., & Gahr, D. (2017). Functional zoning for smart destination management. European Journal of Tourism Research, 17, 43–58. https://doi.org/10.54055/ejtr.v17i.293
- Huang, H., Yao, X. A., Krisp, J. M., & Jiang, B. (2021). Analytics of location-based big data for smart cities: Opportunities, challenges, and future directions. Computers, Environment and Urban Systems, 90, 101712. https://doi.org/10.1016/j.compenvurbsys.2021.101712
- Huang, Q., & Wong, D. W. S. (2015). Modeling and visualizing regular human mobility patterns with uncertainty: An example using twitter data. Annals of the Association of American Geographers, 105(6), 1179–1197. https://doi.org/10.1080/00045608.2015.1081120
- Instituto Nacional de Estatística [INE]. (2017). Statistical Yearbook of Área Metropolitana de Lisboa Region 2017. https://www.ine.pt/xportal/xmain?xpid=INE&xpgid=ine_publicacoes&PUBLICACOESpub_boui=320468753&PUBLICACOESmodo=2.
- Jiang, Y., Li, Z., & Ye, X. (2019). Understanding demographic and socioeconomic biases of geotagged Twitter users at the county level. Cartography and Geographic Information Science, 46(3), 228–242. https://doi.org/10.1080/15230406.2018.1434834
- Jin, C., Cheng, J., & Xu, J. (2018). Using user-generated content to explore the temporal heterogeneity in tourist mobility. Journal of Travel Research, 57(6), 779–791. https://doi.org/10.1177/0047287517714906
- Kádár, B. (2014). Measuring tourist activities in cities using geotagged photography. Tourism Geographies, 16(1), 88–104. https://doi.org/10.1080/14616688.2013.868029
- Kádár, B., & Gede, M. (2021). Tourism flows in large-scale destination systems. Annals of Tourism Research, 87, 103113. https://doi.org/10.1016/j.annals.2020.103113
- Kendall, M. G. (1970). Rank correlation methods (4th ed.). London: Charles Griffin.
- Kitchin, R. (2014). The real-time city? Big data and smart urbanism. GeoJournal, 79(1), 1–14. https://doi.org/10.1007/s10708-013-9516-8
- Koens, K., Smit, B., & Melissen, F. (2021). Designing destinations for good: Using design roadmapping to support pro-active destination development. Annals of Tourism Research, 89, 103233. https://doi.org/10.1016/j.annals.2021.103233
- Li, D., Zhou, X., & Wang, M. (2018a). Analyzing and visualizing the spatial interactions between tourists and locals: A Flickr study in ten US cities. Cities, 74, 249–258. https://doi.org/10.1016/j.cities.2017.12.012
- Li, J., Xu, L., Tang, L., Wang, S., & Li, L. (2018b). Big data in tourism research: A literature review. Tourism Management, 68, 301–323. https://doi.org/10.1016/j.tourman.2018.03.009
- Li, L., Goodchild, M. F., & Xu, B. (2013). Spatial, temporal, and socioeconomic patterns in the use of Twitter and Flickr. Cartography and Geographic Information Science, 40(2), 61–77. https://doi.org/10.1080/15230406.2013.777139
- Li, Z., Huang, X., Hu, T., Ning, H., Ye, X., Huang, B., & Li, X. (2021). ODT flow: Extracting, analyzing, and sharing multi-source multi-scale human mobility. PLOS ONE, 16(8), e0255259. https://doi.org/10.1371/journal.pone.0255259
- Liu, Q., Wang, Z., & Ye, X. (2018). Comparing mobility patterns between residents and visitors using geo-tagged social media data. Transactions in GIS, 22(6), 1372–1389. https://doi.org/10.1111/tgis.12478
- Long, Y., Zhai, W., Shen, Y., & Ye, X. (2018). Understanding uneven urban expansion with natural cities using open data. Landscape and Urban Planning, 177, 281–293. https://doi.org/10.1016/j.landurbplan.2017.05.008
- Lu, W., & Stepchenkova, S. (2015). User-generated content as a research mode in tourism and hospitality applications: Topics, methods, and software. Journal of Hospitality Marketing & Management, 24(2), 119–154. https://doi.org/10.1080/19368623.2014.907758
- Mancini, F., Coghill, G. M., & Lusseau, D. (2018). Using social media to quantify spatial and temporal dynamics of nature-based recreational activities. PLOS ONE, 13(7), e0200565. https://doi.org/10.1371/journal.pone.0200565
- Martí, P., García-Mayor, C., & Serrano-Estrada, L. (2021). Taking the urban tourist activity pulse through digital footprints. Current Issues in Tourism, 157–176. https://doi.org/10.1080/13683500.2019.1706458
- McKercher, B., & Wong, I. A. (2021). Do destinations have multiple lifecycles? Tourism Management, 83, 104232. https://doi.org/10.1016/j.tourman.2020.104232
- Milano, C., González-Reverté, F., & Benet Mòdico, A. (2023). The social construction of touristification. Residents’ perspectives on mobilities and moorings. Tourism Geographies, 1–19. https://doi.org/10.1080/14616688.2022.2150785
- Mor, M., Dalyot, S., & Ram, Y. (2023). Who is a tourist? Classifying international urban tourists using machine learning. Tourism Management, 95, 104689. https://doi.org/10.1016/j.tourman.2022.104689
- Niu, H., & Silva, E. A. (2023). Understanding temporal and spatial patterns of urban activities across demographic groups through geotagged social media data. Computers, Environment and Urban Systems, 100, 101934. https://doi.org/10.1016/j.compenvurbsys.2022.101934
- Observatório Turismo de Lisboa. (2018). Hotel information by area. https://www.visitlisboa.com/about-turismo-de-lisboa/observatório.
- Önder, I., Koerbitz, W., & Hubmann-Haidvogel, A. (2016). Tracing tourists by their digital footprints. Journal of Travel Research, 55(5), 566–573. https://doi.org/10.1177/0047287514563985
- Paldino, S., Bojic, I., Sobolevsky, S., Ratti, C., & González, M. C. (2015). Urban magnetism through the lens of geo-tagged photography. EPJ Data Science, 4(1), 5. https://doi.org/10.1140/epjds/s13688-015-0043-3
- Paldino, S., Kondor, D., Bojic, I., Sobolevsky, S., González, M. C., & Ratti, C. (2016). Uncovering urban temporal patterns from geo-tagged photography. Plos One, 11(12), e0165753. https://doi.org/10.1371/journal.pone.0165753
- Preis, T., Botta, F., & Moat, H. S. (2020). Sensing global tourism numbers with millions of publicly shared online photographs. Environment and Planning A: Economy and Space, 52(3), 471–477. https://doi.org/10.1177/0308518X19872772
- Salas-Olmedo, M. H., Moya-Gómez, B., García-Palomares, J. C., & Gutiérrez, J. (2018). Tourists’ digital footprint in cities: Comparing big data sources. Tourism Management, 66, 13–25. https://doi.org/10.1016/j.tourman.2017.11.001
- Sequera, J., & Nofre, J. (2020). Touristification, transnational gentrification and urban change in Lisbon: The neighbourhood of Alfama. Urban Studies, 57(15), 3169–3189. https://doi.org/10.1177/0042098019883734
- Shao, H., Zhang, Y., & Li, W. (2017). Extraction and analysis of city’s tourism districts based on social media data. Computers, Environment and Urban Systems, 65, 66–78. https://doi.org/10.1016/j.compenvurbsys.2017.04.010
- Shoval, N. (2018). Urban planning and tourism in European cities. Tourism Geographies, 20(3), 371–376. https://doi.org/10.1080/14616688.2018.1457078
- Song, X. P., Richards, D. R., He, P., & Tan, P. Y. (2020). Does geo-located social media reflect the visit frequency of urban parks? A city-wide analysis using the count and content of photographs. Landscape and Urban Planning, 203, 103908. https://doi.org/10.1016/j.landurbplan.2020.103908
- Steiger, E., Westerholt, R., Resch, B., & Zipf, A. (2015). Twitter as an indicator for whereabouts of people? Correlating Twitter with UK census data. Computers, Environment and Urban Systems, 54, 255–265. https://doi.org/10.1016/j.compenvurbsys.2015.09.007
- Su, S., Wan, C., Hu, Y., & Cai, Z. (2016). Characterizing geographical preferences of international tourists and the local influential factors in China using geo-tagged photos on social media. Applied Geography, 73, 26–37. https://doi.org/10.1016/j.apgeog.2016.06.001
- Tenkanen, H., Di Minin, E., Heikinheimo, V., Hausmann, A., Herbst, M., Kajala, L., & Toivonen, T. (2017). Instagram, Flickr, or Twitter: Assessing the usability of social media data for visitor monitoring in protected areas. Scientific Reports, 7(1), 17615. https://doi.org/10.1038/s41598-017-18007-4
- Vu, H. Q., Li, G., & Law, R. (2020). Cross-country analysis of tourist activities based on venue-referenced social media data. Journal of Travel Research, 59(1), 90–106. https://doi.org/10.1177/0047287518820194
- Vu, H. Q., Li, G., Law, R., & Ye, B. H. (2015). Exploring the travel behaviors of inbound tourists to Hong Kong using geotagged photos. Tourism Management, 46, 222–232. https://doi.org/10.1016/j.tourman.2014.07.003
- Vu, H. Q., Li, G., Law, R., & Zhang, Y. (2018). Tourist activity analysis by leveraging mobile social media data. Journal of Travel Research, 57(7), 883–898. https://doi.org/10.1177/0047287517722232
- Xu, F., Nash, N., & Whitmarsh, L. (2020). Big data or small data? A methodological review of sustainable tourism. Journal of Sustainable Tourism, 28(2), 144–163. https://doi.org/10.1080/09669582.2019.1631318
- Yuan, Y., & Medel, M. (2016). Characterizing international travel behavior from geotagged photos: A case study of Flickr. PLOS ONE, 11(5), e0154885. https://doi.org/10.1371/journal.pone.0154885
- Zhou, X., Xu, C., & Kimmons, B. (2015). Detecting tourism destinations using scalable geospatial analysis based on cloud computing platform. Computers, Environment and Urban Systems, 54(Supplement C), 144–153. https://doi.org/10.1016/j.compenvurbsys.2015.07.006