Abstract
Objective. To determine the prevalence of osteoporosis at the distal forearm in a male cohort referred for bone density testing and to compare it to published data of Bulgarian women.
Design and subjects. 315 consecutive Bulgarian men aged 20 to 84 years were included (mean age 53.74 ± 14.67 years). 59% of them were self-referrals. The comparative female group consisted of 8869 Bulgarian women whose forearm bone mineral density (BMD) was measured in another study.
Measurements. BMD was measured by single X-ray absorptiometry at the distal forearm (distal and ultradistal sites) in all men. T-scores were calculated from manufacturer-provided Danish male reference data.
Results. The ratio of female to male patients was 28.2 (8869 to 315). Peak BMD was observed in men aged 30 to 39 years: 0.560 ± 0.065 g/cm2 (distal site) and 0.490 ± 0.070 g/cm2 (ultradistal site). A steady BMD decline followed reaching 0.492 ± 0.064 g/cm2 at the distal and 0.412 ± 0.069 g/cm2 at the ultradistal site in age group >70. Age had a rather weak negative impact on forearm BMD described by a linear model. In men aged over 50 years the prevalence of osteoporosis at the distal site was 21.19%, compared to 20.45% in women. Low bone mass was seen in 48.77% of men and 32.50% of women. Normal BMD was more frequent in women (47.05%) than in men (30.04%).
Conclusions. We found a high prevalence of forearm osteoporosis in Bulgarian men which is comparable to that already known in women.
Introduction
Osteoporosis is traditionally thought to represent a major health problem in women. Recent population-based studies have shown that men are also affected by the ‘silent epidemic’Citation[1],Citation[2]. The epidemiological data on male osteoporosis are still scarce. The life-time risk of osteoporotic fracture is estimated at 13% in men Citation[3]. Approximately 27% of hip fractures occur in men and are associated with a higher mortality than in women Citation[4-8]. Low trauma hip fracture in men significantly increases morbidity and reduces the quality of life Citation[8].
Low bone mass is one of the key components of the WHO definition of osteoporosis. Bone mineral density (BMD) is the most reliable clinical tool for fracture risk prediction in both men and women Citation[9],Citation[10]. Traditionally, the definition of osteoporosis is based on BMD measurements of the spine and proximal femur Citation[11],Citation[12]. The forearm site, however, represents a good example for bone loss in the peripheral skeleton. As a cortical-rich site the forearm would be prone to senile bone changes in men and would be an interesting model for studying involutional bone changes.
There are scarce epidemiological data available on forearm BMD measurements in Bulgaria, except for some in a large group of female referrals for bone densitometry Citation[13]. Very little is known about osteoporosis in Bulgarian men. A pilot study using dual-energy X-ray absorptiometry of the lumbar spine and proximal femur produced preliminary data based on a group of 200 men referred for bone densitometry Citation[14]. A local study tried to establish local reference data of forearm BMD in healthy Bulgarian men Citation[15]. A direct comparison of osteoporosis prevalence in male and female referrals for forearm bone densitometry has not been made yet.
The objective of our study was 1) to determine the age-related BMD changes and the prevalence of osteopenia and osteoporosis at the forearm in a male cohort referred for bone density testing, and 2) to make a comparison with the female patients whose BMD was measured at the same clinical setting in the same period of time.
Subjects and methods
Subjects
This study extended over a 6-year period (Feb 1998–March 2004). A total of 315 consecutive Bulgarian men aged 20 to 84 years were included (mean age 53.74 ± 14.67 years). They were recruited by advertising the need for large-scale bone density screening in the general population. Of the participants 59% were self-referrals to our osteoporosis centre and 41% were referred by medical practitioners. The only inclusion criterion was the patient's informed consent for bone densitometry. Age (years), height (cm), weight (kg) were recorded before BMD testing. Body mass index (BMI) was calculated from weight and height in kg × m−2. The participants' clinical data are summarized in .
Table I. Age-stratified clinical data of the whole study group (n = 305 men).
Data on major risk factors for osteoporosis were collected using a self-administered questionnaire and are shown in . We did not establish subgroups based on risk factors but examined the group as a whole in the belief that it would represent a true referral population.
Table II. Reported major risk factors for osteoporosis as a percentage of the total male study sample.
BMD measurements
BMD of the dominant forearm was measured in g/cm2 by single X-ray absorptiometry (SXA) using a DTX-100 Unit (Osteometer Meditech A/S, Rodovre, Denmark). According to the manufacturer's procedure manual BMD was measured at the so called 8-mm distal site including both radius and ulna and at the ultradistal site including only radius Citation[16]. On this specific bone densitometer the distal region of interest begins at the 8-mm separation point between radius and ulna and then continues proximally for a distance of 24 mm. The ultradistal region of interest extends from the radial endplate proximally to the 8-mm point. All scans were reviewed and those with motion artefacts or other technical problems were excluded from further analysis.
The BMD of the different sites was additionally expressed in terms of t-scores, compared to the young-adult mean in men according to the WHO criteria Citation[11]. The manufacturer's Danish male reference database was used Citation[16]. T-scores were calculated only in men over the age of 50 as recommended by the ISCD Citation[12], and the age-adjusted prevalence of osteoporosis was determined.
Precision
Quality control was performed on a daily basis with the aluminium phantom provided by the manufacturer. Long-term in vitro precision of the DTX-100 instrument expressed in %CV was 0.60%. The in vivo precision study done in this 6-year period was reported elsewhere Citation[13]. Short-term precision in vivo at the distal site for one operator was 1.65% and for two operators −1.86%. Long-term in vivo precision was 2.13%.
Statistical analysis
An SPSS 9.0 package for Windows was used for processing anthropometric and bone density data. The Statsoft package for Windows (1993, version 4.3, StatSoft Inc., Tulsa, OK) was used for regression plot creation. Statistical significance was set as p ≤ 0.05. The data were first tested for normal distribution followed by tests for homogeneity of variance, ANOVA and non-paired Student's t-tests. Regression analysis was performed with age and weight as the independent and forearm BMD as the dependent variable. To exclude the possible effect of weight changes with age on mean BMD in the different decades, weight was plotted versus age.
For the purpose of comparing female versus male osteoporosis a group of female referrals for forearm bone densitometry at the same clinical setting in the same time-period was used. This group included 8869 consecutive 20–87-year-old Bulgarian women. The results of that epidemiological study were published elsewhere Citation[13].
Results
All anthropometric variables and BMD values had a normal Gaussian distribution. The anthropometric differences between each two consecutive age groups were negligible and allowed comparisons of BMD data.
The mean BMD data of the male group as a whole are presented in .
The age-stratified forearm BMD and t-scores in the studied men are presented in . Peak BMD was observed in the age group 30 to 39 years with a steady decrease thereafter. The mean t-scores at the distal site were constantly lower than those at the ultradistal site. The osteoporosis threshold of t-score ≤−2.5 was never reached.
Table III. Age-stratified forearm BMD and t-scores in the studied men are shown. Data are presented as means ± standard deviations.
BMD plotted against age is presented in and separately for the distal and ultradistal sites. Age had a rather weak negative impact on forearm BMD. The best fitting regression model was the cubic one. The linear model yielded a similar performance and was preferred for its simplicity. The linear equations for BMD of both forearm sites regressed on age are shown in and (both p-values < 0.001). Ultradistal BMD showed a stronger dependence on age than distal BMD.
Figure 1. (a) Mean distal site BMD (g/cm2) plotted on age (years) – linear regression; (b) Mean distal site BMD (g/cm2) plotted on weight (kg) – linear regression.
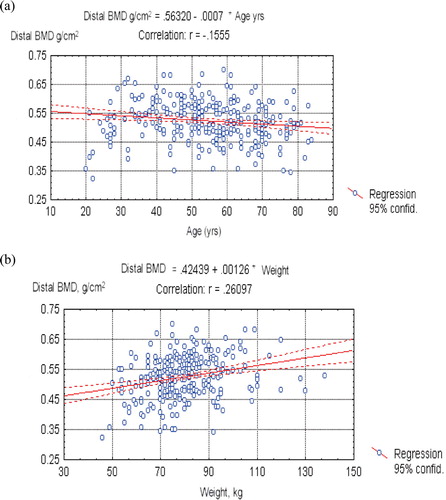
Figure 2. (a) Mean ultradistal site BMD (g/cm2) plotted on age (years) – linear regression; (b) Mean ultradistal site BMD (g/cm2) plotted on weight (kg) – linear regression.
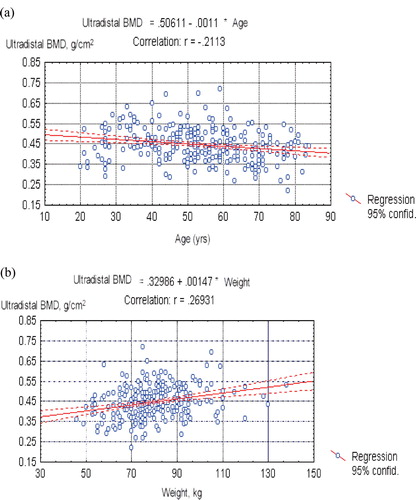
BMD plotted against weight is presented in and separately for the distal and ultradistal sites. Weight had a rather stronger impact on forearm BMD than age. The linear equations of BMD regressed on weight are shown in and (both p-values < 0.001).
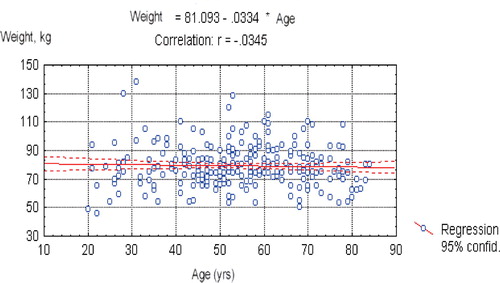
Weight plotted against age is shown in . Mean weight did not change with increasing age, so the impact of age on forearm BMD seemed unaffected by weight.
Figure 3. Mean weight (kg) plotted on age (years) – linear regression.
All age groups had negative t-scores of forearm BMD decreasing with age. The age-adjusted prevalence of low bone density and osteoporosis is presented in and in the men aged 50 years and older. As expected, advancing age was marked by an increase in the proportions of osteoporosis and osteopenia and a decrease in the proportion of normal bone density. The prevalence of osteoporosis was higher at the distal site.
Figure 4. Age-stratified prevalence of forearm low bone mass and osteoporosis in men aged over 50 years based on the distal site (n = 203).
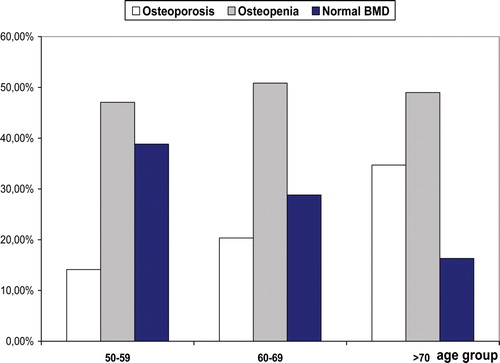
Figure 5. Age-stratified prevalence of forearm low bone mass and osteoporosis in men aged over 50 years based on the ultradistal site (n = 203).
The prevalence of osteoporosis and low bone density in the male group compared to a similar female population group is presented in . Surprisingly men had higher proportions of osteoporosis and low bone density than women. This table shows also that the female-male referral ratio at our osteoporosis centre was 28.2 (8869 to 315).
Table IV. Prevalence of osteoporosis and low bone density of the forearm in the male study group aged 50 and older compared to a previous publication from the same clinical setting in women aged 50 and older Citation[13]. The data are based on the distal forearm site.
Discussion
Bone mineral density in men is predictive for future fractures and for cardiovascular and overall mortality risk Citation[6],Citation[7]. Osteoporotic fractures, particularly hip fractures lead to higher mortality and disability in men than in women Citation[4],Citation[17]. Men are prone to senile bone changes affecting both cortical and trabecular bone Citation[18]. This makes the cortical-rich forearm site an interesting object for research.
This study is one of the first referral population-based cross-sectional examinations of forearm BMD in Bulgarian men. Our peak BMD data showed by 9.2% lower absolute values than the Danish reference ranges at the distal site and by 3.9% lower values at the ultradistal site. The participating men attended a hospital-based osteoporosis centre, which may account for some bias towards lower BMD. On the other hand, this discrepancy may also reflect ethnic differences. A similar trend for lower peak forearm BMD was seen in a previous study in Bulgarian women Citation[13]. The importance of ethnic and possibly genetic differences in BMD has been underlined in a number of studies Citation[19-22].
The analysis of major risk factors for osteoporosis in our male referrals revealed a much higher proportion of secondary causes for low BMD than in women. Osteoporosis and fractures in men are often secondary to causes such as hypogonadism, alcohol excess, oral corticosteroid and anti-convulsant treatment and others, as shown in previous studies Citation[23],Citation[24]. We also found a rather high low-trauma fracture rate of 22.2%. It is logical to expect that if a high proportion had sustained fractures then the numbers of osteoporotic subjects would be increased. Approximately 40% of men with distal forearm fractures, 50% with vertebral, and 80% with hip fractures are osteoporotic Citation[8],Citation[24],Citation[25].
Age-adjusted forearm BMD in our subjects showed a constant and stable decrease with advancing age at both distal and ultradistal sites. Falling BMD with age in men has previously been demonstrated by peripheral quantitative computed tomography (pQCT) and SXA Citation[26],Citation[27]. While the pQCT study described a linear decline of volumetric BMD with age Citation[26], SXA found a complex nonlinear association between areal BMD and age, with a change of slope around 50 to 54 years at both forearm sites, more distinct at the distal site Citation[27]. The ultradistal BMD by age curve could alternatively be viewed as linear from the highest BMD level in subjects aged 30 to 34 years into older age groups Citation[27]. Both pQCT and SXA studies reported peak values of BMD at the ages 30 to 34 years in men. Butz et al. also found in their pQCT study that the distribution of trabecular BMD of the distal radius was shifted to lower values compared with the reference ranges provided by the manufacturer Citation[26]. All these findings are in line with our results.
When considering our data one must keep in mind the limitations of cross-sectional versus longitudinal BMD change. The cross-sectional estimates of BMD by age associations are not true measures of longitudinal BMD change. They are vulnerable to both cohort effects and selection bias, and patterns of individual BMD change cannot be clearly identified.
T-scores of the distal site were constantly lower than those of the ultradistal site. The opposite trend was found in women, where the ultradistal region of interest tended to diagnose more subjects with osteoporosis than the distal one Citation[28]. This discrepancy might be due to the lack of an equivalent to the menopause in men and the predominance of senile bone changes. Senile bone changes occur at an older age and affect cortical stronger than trabecular bone Citation[18],Citation[29]. It is now believed that the 8-mm distal forearm site contains approximately 85% cortical bone, whereas the ultradistal site contains 45% cortical and 55% trabecular bone Citation[30]. In a previous study in women we were able to show a significant heterogeneity of bone changes in both forearm sites resulting in 19.3% diagnostic disagreement Citation[28]. This may be partly explained by the different rates of bone loss from these sites. In addition, men have greater periosteal apposition in cortical bone with age than women Citation[31-33]. The net amount of bone lost during aging is determined by the difference between the amount of bone removed from the endocortical, trabecular and intracortical components of its endosteal envelope and formed beneath its periosteal envelope. Net bone loss is less in men than women because men form more periosteal bone during ageing than do women. So periosteal apposition offsets endosteal bone loss more in men than in women, and net bone loss is less in men than women Citation[31-33]. Trabecular bone does undergo thinning of trabeculae, but tends to retain connectivity. Thus, the stress on the bone decreases more and the strength of the bone decreases less in men than in women, accounting for the lower incidence of spine fractures in men than in women Citation[24].
We conducted the first study comparing male to female bone density data in a Bulgarian population sample. Our data suggest that men very rarely visit osteoporosis centres. Those who undergo bone density screening show a relatively high prevalence of osteoporosis and low bone density. These data underline the scope of the problem ‘male osteoporosis’ and the failure of the present health policy to involve men in the fight against the ‘silent epidemic’.
The prevalence of osteoporosis and low bone mass in men is still being investigated. It was first believed that the prevalence of femoral neck osteoporosis is between 6 and 22% in US men over the age of 50 years Citation[1]. Using male-specific hip BMD cut-offs, approximately 3 to 6% of US men 50 years of age and older were estimated to have osteoporosis and 28 to 47% to have osteopenia Citation[2]. Several other studies addressing the prevalence issue in men have provided a variety of epidemiological data reflecting ethnic and geographic differences Citation[20-22],Citation[29],Citation[34],Citation[35].
In a previous study we investigated the prevalence of central osteoporosis in 200 Bulgarian men referred for bone densitometry Citation[13]. In men aged over 50 years the mean prevalence of osteoporosis at the spine was 24.59%, compared to 5.88% and 9.41% at the total hip and femoral neck respectively. There was normal BMD at the spinal site in 40.16%, compared to 52.94% at the total hip and 40.0% at the femoral neck. Our forearm data are much similar to those obtained at the lumbar spine.
Osteoporosis in men is expected to involve increasing health costs Citation[17]. Male osteoporosis will therefore play an important role in society. Our study underlines some aspects of the diagnosis of osteoporosis in the male population. It may be regarded as a pilot one, investigating the need for large-scale epidemiological work in the field of male osteoporosis.
References
- Looker A, Orwoll E S, Johnston C C, Jr, Lindsay R L, Wahner H W, Dunn W L, Calvo M S, Harris T B, Heyse S P. Prevalence of low femoral bone density in older U.S. adults from NHANES III. J Bone Miner Res 1997; 12: 1761–1768
- Melton L J, 3rd. The prevalence of osteoporosis: gender and racial comparison. Calcif Tissue Int 2001; 69: 179–181
- Cummings S R, Melton L J. Epidemiology and outcomes of osteoporotic fractures. Lancet 2002; 539: 1761–1767
- Center J R, Nguyen T V, Schneider D, Sambrook P N, Eisman J A. Mortality after all major types of osteoporotic fracture in men and women: an observational study. Lancet 1999; 353(9156)878–882
- National Osteoporosis Foundation. America's Bone Health: the state of osteoporosis and low bone mass. National Osteoporosis Foundation, Washington DCUSA 2002
- Trivedi D P, Khaw K T. Bone mineral density at the hip predicts mortality in elderly men. Osteoporos Int 2001; 12: 259–265
- Van der Klift M, Pols H A, Geleijnse J M, Van Der Kuip D A, Hofman A, de Laet C E. Bone mineral density and mortality in elderly men and women: the Rotterdam Study. Bone 2002; 30: 643–648
- Pande I, Scott D L, O'Neill T W, Pritchard C, Woolf A D, Davis M J. Quality of life, morbidity, and mortality after low trauma hip fracture in men. Ann Rheum Dis 2006; 65: 87–92
- Marshall D, Johnell O, Wedel H. Meta-analysis of how well measures of bone mineral density predict occurrence of osteoporotic fractures. BMJ 1996; 312: 1254–1259
- Schuit S C, van der Klift M, Weel A E, de Laet C E, Burger H, Seeman E, et al. Fracture incidence and association with bone mineral density in elderly men and women: the Rotterdam Study. Bone 2004; 34: 195–202
- The WHO Study Group. Assessment of fracture risk and its application to screening for postmenopausal osteoporosis. Report of a WHO Study Group, WHO Technical Report Series 843. World Health Organization, Geneva 1994
- The Writing Group for the ISCD Position Development Conference. Diagnosis of osteoporosis in men, premenopausal women, and children. J Clin Densitometry 2004; 7: 17–26
- Boyanov M, Popivanov P. Prevalence of low forearm bone density in a Bulgarian female referral population. Osteoporos Int 2002; 13: 288–295
- Boyanov M, Christov V. Prevalence of low central bone mineral density in Bulgarian males. Journal of Men's Health 2005; 2: 318–324
- Hristozov K, Koeva L, Gospodinova N. Parameters of peripheral bone mineral density in men (Bulgarian). Osteoporoza 2000; 1: 21–23
- Osteometer DTX-100. 1994 Product Documentation and Reference Material. Osteometer A/S, RodovreDenmark
- Levy P, Levy E, Audran M, Cohen Solal M, Fardellone P, Le Parc J M. The cost of osteoporosis in men: the French situation. Bone 2002; 30: 631–636
- Lombardi A, Ross P D. The assessment of bone mass in men. Calcif Tissue Int 2001; 69: 222–224
- Richy F, Gourlay M L, Garrett J, Hanson L, Reginster J Y. Osteoporosis prevalence in men varies by the normative reference. J Clin Densitometry 2004; 7: 127–133
- Holt G, Khaw K T, Reid D M, Compston J E, Bhalla A, Woolf A D, et al. Prevalence of osteoporotic bone mineral density at the hip in Britain differs substantially from the US over 50 years of age: implications for clinical densitometry. Br J Radiol 2002; 75: 736–742
- Rogucka E, Jankowska E A, Welon Z, Medras M, Bielicki T. Bone mineral status of Polish men in the course of normal ageing. Andrologia 2001; 33: 287–292
- Krassas G E, Papadopoulou F G, Doukidis D, Konstantinidis T H, Kalothetou K. Age-related changes in bone density among healthy Greek males. J Endocrinol Invest 2001; 24: 326–333
- Scane A C, Sutcliffe A M, Francis R M. Osteoporosis in men. Baillieres Clin Rheumatol 1993; 7: 589–601
- Scane A C, Francis R M, Sutcliffe A M, Francis M J, Rawlings D J, Chapple C L. Case-control study of the pathogenesis and sequelae of symptomatic vertebral fractures in men. Osteoporos Int 1999; 9: 91–97
- Tuck S P, Raj N, Summers G D. Is distal forearm fracture in men due to osteoporosis?. Osteoporos Int 2002; 13: 630–636
- Butz S, Wuster C, Scheidt-Nave C, Gotz M, Ziegler R. Forearm BMD as measured by peripheral quantitative computed tomography (pQCT) in a German reference population. Osteoporos Int 1994; 4: 179–184
- Bernsten G KR, Fønebø V, Tollan A, Søgaard A J, Magnus J H. Forearm bone mineral density by age in 7620 men and women. The Tromsø Study, a population-based study. Am J Epidemiol 2001; 153: 465–473
- Boyanov M. Diagnostic discrepancies between two closely related forearm bone density measurement sites. J Clin Densitometry 2001; 4: 63–71
- Szulc P, Marchand F, Duboeuf F, Delmas P D. Cross-sectional assessment of age-related bone loss in men: the MINOS study. Bone 2000; 26: 123–129
- Nilas L, Norgaard H, Podenphant J, Gotfredsen A. Bone composition in the distal forearm. Scand J Clin Lab Invest 1987; 47: 41–46
- Duan Y, Turner C H, Kim B T, Seeman E. Sexual dimorphism in vertebral fragility is more the result of gender differences in age-related bone gain than bone loss. J Bone Miner Res 2001; 16: 2267–2275
- Seeman E. During aging, men lose less bone than women because they gain more periosteal bone, not because they resorb less endosteal bone. Calcif Tissue Int 2001; 69: 205–208
- Seeman E. Reduced bone formation and increased bone resorption: rational targets for the treatment of osteoporosis. Osteoporos Int 2003; 14((Suppl);3)S2–8
- Tenenhouse A, Joseph L, Kreiger N, Poliquin S, Murray T M, Blondeau L, et al. Estimation of the prevalence of low bone density in Canadian women and men using a population-specific DXA reference standard: the Canadian Multicentre Osteoporosis Study (CaMos). Osteoporos Int 2000; 11: 897–904
- Zerbini C A, Latorre M R, Jaime P C, Tanaka T, Pippa M G. Bone mineral density in Brazilian men 50 years and older. Braz J Med Biol Res 2000; 33: 1429–1435