
Abstract
This study aimed to analyze the effects of caloric restriction on aged femoral articular cartilage of Wistar rats. Three groups of eight animals each were considered: young (YC) and old (OC) control groups fed with a normal diet and old caloric restriction group (OCR) composed of 18-month-old animals fed with a 31% less caloric diet from 6-months of age. Articular cartilage was studied through morphometry and immunohistochemistry. Body mass was 12% less in the OCR group than in the OC group. The articular cartilage from OC rats show thinner medial condyles, fewer chondrocytes, smaller chondrocytes nuclear volume and, in both condyles, a predominance of collagen type II and less collagen density compared to both YC and OCR groups (p < .001). In contrast, OCR articular cartilage show thicker medial condyles, larger chondrocytes nuclear volume and increased collagen density compared to OC group (p < 0.001). We concluded that caloric restriction minimizes the effects of aging on medial condyles of the femoral articular cartilage.
Introduction
Articular cartilage is a highly specialized tissue that supports forces and reduces friction during movement in the synovial joints [Citation1,Citation2]. Structurally, it consists of chondrocytes and extracellular matrix [Citation3–5].
During aging, occurs chondrocytes loss [Citation1,Citation6] with associated changes in the matrix density, composition, and organization of type II collagen and proteoglycans [Citation2,Citation5,Citation7–9] thus causing significant reduction of the cartilage thickness [Citation10–12].
Studies have shown that the level of caloric intake (CR) could influences the aging of many tissues [Citation13,Citation14]. Caloric restriction, characterized by reduced caloric intake below usual ad libitum without malnutrition [Citation15], was shown to slow aging effects and increase longevity by preventing the onset of chronic diseases [Citation16–19]. Given the degeneration of the articular cartilage during aging and the beneficial effects of CR reported in the literature, the present study aimed to analyze the influence of CR on structural modifications of femoral articular cartilage of aging Wistar rats.
Materials and methods
Twenty-four male Wistar rats were divided into groups: YC (6 months-old fed with a normal diet, from weaning until six months of age, n = 8), OC (18 months-old fed with normal diet from weaning until 18 months of age, n = 8) and OCR (18 months-old fed with a diet containing fewer calories, beginning at six months of age, n = 8). Animals were individually housed in polypropylene boxes, provided with food and water ad libitum and environment-controlled temperature and lighting.
To determine the daily amount of chow provided during experimental period, all animals passed through a 7-day adaptation process. During this process, the animals were given a normal diet and water ad libitum. The same amount of chow consumed per day during the adaptation phase was administered throughout the duration of the first month of the experiment. Thereafter, the amount of chow supplied to the animals in the OCR group was adjusted monthly based on the average consumption of the animals in the OC group. This procedure was necessary to prevent the animals of the OCR group from compensating for the reduced-calorie feed by increasing their consumption to maintain the same caloric intake. After the adjustment period, the animals in the OC group were fed with a normal diet with a chemical composition based on the dietary recommendations for laboratory animals. Data about diet ingredients are published elsewhere [Citation20].
Animals in the OCR group were fed with a diet in which the raw energy was reduced by 31% (). The animals in the OC and ORC groups began the experiment at 6 months of age and completed the experiment at 18 months of age. The animals were weighted monthly until euthanasia.
Table 1. Data of articular cartilage thickness and chondrocytes numerical density and nuclear volume of the young control (YC), old control (OC), and old restricted groups (OCR).
Euthanasia and tissue preparation
At the end of the experimental period, animals were fasted for 12 h and euthanized using a lethal, intravenous dose (tail vein) of anesthetic (Thiopental® 40 mg/kg of body weight). The euthanasia protocol of the animals was submitted to the Committee of Bioethics of the College of Veterinary Medicine and Zootechny of the University of São Paulo (Protocol n° 2477/2011).
Subsequently, types of collagen were assessed by immunohistochemistry and picrosirius staining. Morphometric study was carried out, using histological sections of femoral articular cartilage stained with picrosirius and hematoxylin–eosin.
For immunohistochemical analysis of cartilage matrix, collagen type II was used as six sections of each animal’s tissue. This type of collagen was chosen by being predominantly in articular cartilage [Citation21,Citation22]. The cuts in silanized slides were unmasked in a water bath in borate buffer at 80° C for 30 min. Then, the sections were submitted to the blocking of peroxidase in 3% H2O2 solution, diluted in methanol for 5 min. After washing, the antigenic blocking of the slides was performed in acid5-thio-2-nitrobenzoic acid (TNB) for 30 min. Subsequently, the sections were washed and incubated in a humidified chamber overnight at 4 °C with mouse anti-human collagen II [2150–0040 (Serotec) Oxford, England]. Then, the slides were incubated with secondary antibodies [(Dako) Glostrup, Denmark] for 30 min in humid chamber. After washing, the revelation was performed using diamino benzidine (DAB). Subsequently, background staining was performed with Harris hematoxylin for 5 s. The slides were mounted and immediately photographed with a magnification of 400×. Negative controls were carried out to prevent the nonspecific markings by secondary antibody.
Picrosirius-stained histological sections were examined with polarizing filters in conventional light microscope. When analyzed by this method, type I collagen presents an orange or red color, while type III collagen presents a green color. The type II collagen in general, presents a yellow color, but can be found in varying colors; however, these colors are always clearly distinct from type I and III collagens [Citation23].
Quantitative analysis
Articular cartilage thickness, chondrocytes numerical density (number per area) and volume of nuclei, [Citation24] and volume density of collagen fibers were obtained by light microscopy, using the AxioVision 4.8 digital analyzing computer program (Zeiss, Germany).
Statistical analysis
Descriptive statistics were given as mean ± standard error of mean (SEM). Data were not normally distributed. The parameters of three groups of rats were compared using the ANOVA and post hoc Tukey’s test. When not specified, p ≤ .05 was considered as significant.
Results
Body mass
At six months of age, there was no difference between the OC and OCR groups (p > .05) ( and ). From 8 months of age, we observed an increase in body weight of the animals from the OC group and at 9 months of age in the OCR. In OCR group, there was weight loss at 8 months with gain by the end of the experiment. Nevertheless, this gain was significantly lower than that found in OC animals up to 18 months of age (p < .05).
Figure 1. Mean values of body mass (g) obtained monthly during the experimental period (12 months) for animals of OC group.
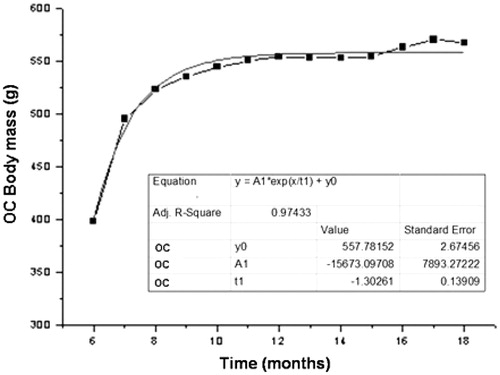
Figure 2. Mean values of body mass (g) obtained monthly during the experimental period (12 months) for animals of OCR group.
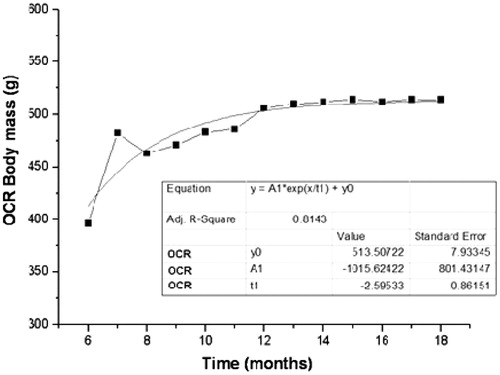
For the OC group, the exponential growth coefficient (e) and the coefficient of determination (R2) of body weight were and .97, respectively (p < .0001). For OCR, the exponential growth coefficient and the coefficient of determination were
e .81, respectively (p < .0001).
Articular cartilage thickness
Medial condyle of OC group was thinner than YC and OCR groups (p < .001).
Density of chondrocytes
The number of chondrocytes in the medial condyle was fewer in the OC compared to YC and OCR groups (p < .001).
Nuclear volume of chondrocytes
The chondrocyte nuclear volume was fewer in the medial condyle from OC group relative to YC (p < .001) and OCR groups (p < .05). Data are presented in .
Collagen
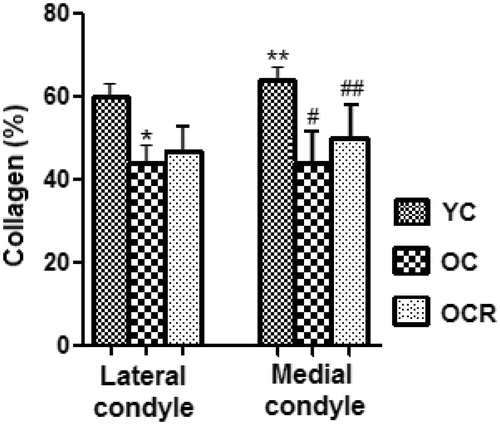
There was fewer volume of collagen in the OC group in relation to the YC in both femoral condyles (p < .01), while the OCR animals had larger collagen volume in relation to the OC only in the medial condyle of the femur (p < .05) ().
Figure 3. Volumetric proportion of collagen in the extracellular matrix (% by area) from the lateral and medial femoral condyle in the studied groups (YC, OC, OCR). *Significant in relation to the lateral condyle of YC group (p < .001); **Significant in relation to the lateral condyle of YC group (p < .05); #Significant in relation to the medial condyle of YC group (p < .001); ##Significant in relation to the medial condyle of OC group (p < .05).
Types of collagen
In the YC group, at both condyles, we note the presence of collagen type I fibers (orange) and type II (yellow and brown), with a predominance of type II collagen ()
Figure 4. Histological sections of the articular cartilage of the femur showing the distribution of collagen fibers (arrows) in the layers of cartilage in the three studied groups (YC, OC, OCR); SB: subchondral bone. Picrosirius staining.
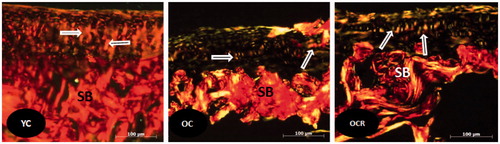
In the OC group, at both condyles, we note the presence of collagen type I fibers (red), type II (yellow and brown) and type III (green) with a predominance of type II collagen. In OCR group, we note the presence of collagen type I fibers (orange), type II (yellow and brown), and type III (green) with predominance of collagen type II. The type II collagen fibers predominated in both condyles of the YC group compared to OC. However, we found equilibrium in the presence of collagen type II fibers between OC and OCR groups.
Collagen type II immunohistochemistry
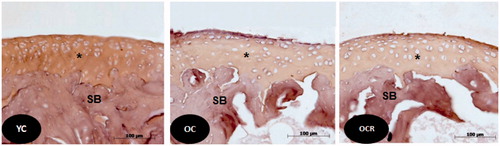
In the femoral articular cartilage, the YC group showed homogeneous labeling (++++/++++) of type II collagen while OC (+++/++++) and OCR groups (+++/++++) showed heterogenous labeling, with no difference between the condyles (.
Figure 5. Histological sections of the articular cartilage of the femur showing the labeling of type II collagen in beige color (*) by Immunohistochemistry, in the three groups studied (YC, OC, OCR). SB: subchondral bone.
Discussion
Several references demonstrated an increase of weight mass during the process of aging [Citation17,Citation25–27]. Here, we presented data showing that OC group was heavier than OCR. At eight months of experimentation, OCR group showed loss of mass, with subsequent regain by the end of the experiment. The coefficient of exponential growth was higher in the OC group, indicating that they gained weight faster than the OCR. The coefficient of determination indicates how much the data obtained had the same behavior. Thus, OC and OCR groups presented 97% and 81%, respectively, which are similar to the regression model.
Data for body weight obtained for the OCR group agreed with Athanasiou et al. [Citation17], which showed less body weight gain between 6 and 18 months with food restriction. Nevertheless, data diverge from Holloszy [Citation26] that demonstrated there was no significant difference in mass between 6 and 18 months in the animals subjected to food restriction. In addition, Bailey et al. [Citation25] noted an increase in mass up to 15 months in animals with restricted feeding, with subsequent loss up to 18 months. These differences may be due to the dietary restriction model, possibly using food restriction instead caloric restriction.
The reduction in body weight gain of rats between 8 and 18 months of age is a protective factor for the articular cartilage, once overweight and obesity are associated with inflammatory diseases such as osteoarthritis [Citation28–30]. Here, we observed a tuning of the cartilage as age progressed, which was most visible in the medial condyle. Contrary, Wang et al. [Citation27] and Stockwell [Citation31] demonstrated that the thickness of the cartilage of the distal femur did not change with advancing age. Probably, this setback is associated with the decrease in activity of chondrocytes with aging [Citation7,Citation32].
The asymmetry between the condyles may be due to mechanical factors [Citation7,Citation32]. According to Buckwalter and Mankin [Citation33], overloading the joint creates mechanical, electrical, physical, and chemical signals that stimulate the activity of synthesis or degradation of chondrocytes. Caloric restriction maintained cartilage thickness of the medial condyles showing that it is useful to prevent the reduction caused by aging.
In this work, the total number of chondrocytes was lower in the medial condyle than lateral, confirming the findings of Stockwell [Citation31] and Oda et al. [Citation5]. Possibly, this is due to the apoptosis related to inflammatory conditions [Citation10,Citation11]. The loss of chondrocytes leaves the cartilage more vulnerable to degenerative diseases, causing reduction of strength and matrix stiffness [Citation10,Citation34]. In turn, caloric restriction leads to increase in cell density in the medial condyle.
Perhaps, aging influence on chondrocytes nuclei volume of medial condyles indicates a reduction of their metabolic activity. Knowing that the metabolism of the chondrocytes is responsible for maintaining the matrix by a balance between anabolism and catabolism [Citation1,Citation2,Citation10,Citation22,Citation33,Citation35–38], our results agree with the Karvonen et al. [Citation32], Hudelmaier et al. [Citation7] and Martin and Buckwalter [Citation6]. Further, caloric restriction also influenced chondrocytes nuclei volume without any morphoquantitative differences between both condyles. Caloric restriction mitigated the effects of aging, which agrees with literature, showing that caloric intake surely alters cellular metabolic activity [Citation14,Citation39].
Collagen type II was chose being predominant in articular cartilage [Citation21,Citation22]. As known, changes occur in density, composition and/or organization of collagen during the aging process [Citation12,Citation17,Citation28]. Here, we found decreased density of collagen type II in the articular cartilage of the femur with aging.
The caloric restriction prevented the effects of aging on the medial condyle but not on the lateral. This difference may be seen in some pathological conditions such as osteoarthritis. According to Felson et al. [Citation40], patients with knee osteoarthritis tend to support progressively greater weight on the lateral condyle.
The results of polarization method and immunohistochemistry suggested that larger collagen content in the medial condyle is not predominantly type II. Changes of type II collagen observed in the experimental groups OC and OCR may be due to increased weight bearing on the joint, resulting in weight gain in these animals, especially the OC animals. In fact, Roth and Mow [Citation41] and Volpi and Katz [Citation42] quoted that changes in the cartilage collagen depend on the forces acting, which influence remodeling and reorientation of collagen fibers. In conclusion, the present study found that aging of femoral articular cartilage can be slowed down by caloric restriction.
Disclosure statement
None of the authors disclose any conflict of interest.
References
- Huber M, Trattnig S, Lintner F. Anatomy, biochemistry, and physiology of articular cartilage. Invest Radiol. 2000;35:573–580.
- Dudhia J. Aggrecan, aging and assembly in articular cartilage. Cell Mol Life Sci. 2005;62:2241–2256.
- Castano Oreja MT, Rodriguez MQ, Abelleira AC, et al. Variation in articular cartilage in rabbits between weeks six and eight. Anat Rec. 1995;241:34–38.
- Kim M. Unweighting accelerates tidemark advancement in articular cartilage at the knee joint of rats. J Bone Min Res. 1997;12:580–589.
- Oda JY, Maifrino LBM, Souza RR. Variation in articular cartilage in rats between 3 and 32 months old. A histomorphometric and scanning electron microscopy study. Biogerontology. 2007;8:345–352.
- Martin JA, Buckwalter JA. Human chondrocyte senescence and osteoarthritis. Biorheology. 2002;39:145–152.
- Hudelmaier M, Glaser C, Engelmeier KH, et al. Age-related changes in the morphology and deformational behavior of knee joint cartilage. Arthritis Rheum. 2001;44:2556–2561.
- Verzijl N, De Grrol J, Bem ZC, et al. Cross linking by advanced glycation and products increases the stiffness of the collagen network in human articular cartilage a possible mechanism through which age is a risk factor for osteoarthritis. Arth Rheum. 2002;46:114–123.
- Guerra MFM, Baeza ED, Hernández JJS, Ruiz JPG. Chondrocyte cloning in aging and osteoarthritis of the hip cartilage. Morphometric analysis in transgenic mice bovine growth hormone. Acta Orthop Scand. 2004;75:210–216.
- Horton JRWE, Bennion P, Yang L. Cellular, molecular, and matrix changes in cartilage during aging and osteoarthritis. J Musculoskelet Neuronal Interact. 2006;6:379–381.
- Aigner T, Haag J, Martin J, et al. Osteoarthritis: aging of matrix and cells-going for a remedy. Curr Drug Targets. 2007;8:325–331.
- Goldring MB, Goldring SR. Osteoarthritis. J Cell Physiol. 2007;213:626–634.
- Lutz WK. Endogenous genotoxic agents and processes as a basis of spontaneous carcinogenesis. Mutat Res. 1990;238:287–295.
- Hart RW, Dixit R, Turturo A, et al. Supplement. Adaptative role of caloric intake on the degenerative disease processes. Toxicol Sci. 1999;52:3–23.
- Fontana L, Klein S. Aging, adiposity and caloric restriction. JAMA. 2007;297:986–994.
- Weindruch R, Walford RL. Dietary restriction in mice beginning at 1 year of age: effect on life-span and spontaneous cancer incidence. Science. 1982;215:1415–1418.
- Athanasiou KA, Zhu CF, Wang X, et al. Effects of aging and dietary restriction on the structural integrity of rat articular cartilage. Ann Biomed Eng. 2000;28:143–149.
- Hursting SD, Lavigne JA, Berrigan D, et al. Calorie restriction, aging, and cancer prevention: mechanisms of action and applicability to humans. Annu Rev Med. 2003;54:131–152.
- Mattson MP. Energy intake, meal frequency, and health: a neurobiological perspective. Annu Rev Nutr. 2005;25:237–260.
- Porto GS, Pereira JNB, Tibúrcio VG, et al. Effect of caloric restriction on myenteric neuroplasticity in the rat duodenum during aging. Auton Neurosci. 2012;168:43–7.
- Hardingham T, Tew S, Murdoch A. Tissue engineering: chondrocytes and cartilage. Arthritis Res. 2002;4:63–68.
- Cairns DM, Lee PG, Uchimura T, et al. The role of muscle cells in regulating cartilage e matrix production. J Orthop Res. 2010;28:529–536.
- Junqueira LCU, Bignolas G, Brentani RR. Picrosirius staining plus polarization microscopy, a specific method for collagen detection in tissue sections. Histochem J. 1978;11:447–455.
- Kraus VB, Huebner JL, Groot J, Bendele A. The OARSI Histopathology Initiative - Recommendations for Histological Assessments of Osteoarthritis in the Guinea Pig. Osteoarthr Cartil. 2010;18:35–52.
- Bailey JM, Barker RL, Beauchene RR. Age-Related changes in rat adipose tissue cellularity are altered by dietary restriction and exercise. J Nutr. 1993;123:52–58.
- Holloszy JO. Mortality rate and longevity of food-restricted exercising male rats: a reevaluation. J Appl Physiol. 1997;82:399–403.
- Wang L, Kalu DN, Banu JM, et al. Effects of ageing on the biomechanical properties of rat articular cartilage. Proc Inst Mech Eng H. 2006;220:573–578.
- Kerin A, Patwari P, Kuettner K, et al. Molecular basis of osteoarthritis: biomechanical aspects. Cell Mol Life Sci. 2002;59:27–35.
- Sowers MR, Karvonen-Gutierrez CA. The evolving role of obesity in knee osteoarthritis. Curr Opin Rheumatol. 2010;22:533–537.
- Lee R, Kean WF. Obesity and knee osteoarthritis. Inflammopharmacology. 2012;20:53–58.
- Stockwell RA. The cell density of human articular and costal cartilage. J Anat. 1967;101:753–763.
- Karvonen RL, Negendank WG, Teige RA, et al. Factors affecting articular cartilage thickness in osteoarthritis and aging. J Rheumatol. 1994;21:1310–1318.
- Buckwalter JA, Mankin HJ. Articular cartilage: degeneration and osteoarthritis, repair, regeneration, and transplantation. Instr Course Lect. 1998;47:487–504.
- Adams CS, Horton WE, Jr. Chondrocyte apoptosis increases with age in the articular cartilage of adult animals. Anat Rec. 1998;250:418–425.
- Kuettner KE, Aydelotte MB, Thonar EJ. Articular cartilage matrix and structure: a minireview. J Rheumatol Suppl. 1991;27:46–48.
- Poole CA, Ayad C, Gilbert RT. Chondrons from articular cartilage. J Cell Sci. 1992;103:1101–1110.
- Corvol MT. The chondrocyte: from cell aging to osteoarthritis. Joint Bone Spine. 2000;67:557–560.
- Yang L, Carlson SG, McBerney D, et al. Multiple signals induce endoplasmic reticulum stress in both primary and immortalized chondrocytes resulting in loss of differentiation, impaired cell growth, and apoptosis. J Bio Chem. 2005;280:31156–31165.
- Duffy PH, Feuers RJ, Nakamura KD, et al. Effect of chronic caloric restriction on the synchronization of various physiological measures in old female fischer-344 rats. Chronobiol Int. 1990;7:113–214.
- Felson DT, Anderson JJ, Naimark A, et al. Obesity and knee osteoarthritis. Ann Intern Med. 1988;1:18–24.
- Roth V, Mow VC. The intrinsic tensile behavior of the matrix of bovine articular cartilage and its variation with age. J Bone Joint Surg Am. 1980;62:1102–1117.
- Volpi M, Katz EP. On the adaptive structures of the collagen fibrils of bone and cartilage. J Biomech. 1991;24:67–77.