
Abstract
Objective: To study the prevalence of bone mineral density (BMD) and osteoporosis in the distal forearm among Thai men over 40 years of age in Mae Chaem District, Chiang Mai Province, Thailand.
Methods: The subjects in this study were 194 Thai men, aged between 40 and 87 years who resided in Mae Chaem District, Chiang Mai Province, Thailand. Self-administered questionnaires were used for receiving the demographic characteristics information. BMD was measured by peripheral dual energy X-ray absorptiometry at the nondominant distal forearm in all men.
Results: The BMD was highest in the age-group 40–49 years and lowest in the age-group 70–87 years. The average T-score at the distal forearm was also highest in the age-group 40–49 years and lowest in the age-group 70–87 years. The BMD decreased as a function of age-group (p < .05). In contrast, the BMD increased as a function of weight (p < .05). Height had weak impact on the BMD in the distal forearm (p > .05). The percentage of osteopenia and osteoporosis are increased as a function of age-group in, while decreased in that of normal bone density.
Conclusions: We found the prevalence of osteoporosis in men who resided in Mae Chaem District, Chiang Mai Province, Thailand.
Introduction
Osteoporosis is a disease that progresses without symptoms until a fracture occurs. It is characterized by low bone mass and micro-architectural bone tissue deterioration resulting in an increase in bone fragility and fractures [Citation1]. Traditionally, osteoporosis is regarded as a post menopause disease in females. Recently, epidemiological data have shown osteoporosis can occur in men, as well [Citation2]. Four to six percent of men over 50 years have osteoporosis, and osteopenia occurs in 33–47% of similarly aged males [Citation3]. The risk of developing an osteoporotic fracture during the lifetime in men 50 years and 60 years is 13% and 29%, respectively [Citation3,Citation4]. Prevalence studies show that vertebral or hip fractures occur in approximately 5–6% of men, with wrist fractures occurring in 2.5% of all males [Citation5]. The low trauma hip fracture in men is related to significant increase in mortality, morbidity, and quality of life [Citation6]. Bone mineral density (BMD) is the most accurate diagnostic clinical tool for predicting the risk of fracture in both men and women. Although, osteoporosis is generally based on BMD scans at the spine, hip, and femur; the forearm is a good indicator of bone density loss in the peripheral skeleton [Citation7]. In addition, a distal radius fracture is a good predictor for the likelihood that fractures and osteoporosis will occur in the future [Citation8,Citation9].
The BMD in both men and women have been studied in different ethnicities and countries [Citation7,Citation10–17]. It may be possible that ethnicity is correlated with BMD [Citation18]. In Thailand, local studies have been published using BMD measurements of the spine, hip, and femur in Thai men and women [Citation19–22]. However, very little is published about BMD in the forearm site of Thai men. Moreover, men tend to have changes in the cortical and trabecular bones over time [Citation23]. Therefore, the cortical-rich forearm site is an interesting object for study. In addition, Tuck et al. [Citation24] demonstrated that low BMD and osteoporosis risks were higher in men with distal forearm fractures. The objective of this research was to study the prevalence of BMD and osteoporosis at the distal forearm in Thai men over 40 years in Mae Chaem District, Chiang Mai Province, Thailand.
Materials and methods
This was a retrospective study that was carried out by examining the demographic characteristics information and BMD data obtained from the Community Services Project at Mae Chaem District, Chiang Mai Province, Thailand. This project was conducted by the Department of Radiologic Technology, Faculty of Associated Medical Sciences, Chiang Mai University, Thailand.
Subjects and demographic characteristics information
The subjects in this study were 194 Thai men, aged between 40–87 years who reside in Mae Chaem District, Chiang Mai Province, Thailand. Self-administered questionnaires were used for receiving the demographic characteristics information. The questions related to risk factors for osteoporosis provided information on age, height, weight, parent’s history of osteoporosis, parent’s history of spinal deformity, coffee/tea intake, alcohol intake, smoking, milk intake, eating habits (fish, beans, and vegetable), and exercise. Weight (kg) and height (m) were used for calculating body mass index (BMI) using the following equation: BMI = kg/m2. The subject’s demographic characteristics information is summarized in and .
Table 1. Demographic characteristics information is shown.
Table 2. Risk factors for osteoporosis are shown.
BMD measurement
The BMD of non-dominant distal forearm of all subjects was measured using peripheral dual energy X-ray absorptiometry (pDEXA) scan (EXA 3000; Osteosys Corp, Seoul, Korea) according to standard protocol. All subjects undergoing BMD measurement were requested to remove all items (e.g. bracelet, wristwatch, etc.) from their non-dominant distal forearm. Positioning: All subjects were asked to place their non-dominant distal forearm with lateral position between the X-ray source and detector of pDEXA machine.
The World Health Organization (WHO) criterion for osteoporosis diagnostics was used to classify normal bone mass (T-score ≥−1), osteopenia (T-score between −1 and −2.5) and osteoporosis (T-score ≤ −2.5).
Statistical analysis
A Microsoft Excel program for Windows was used for processing demographic characteristics and bone density information. Linear correlation analysis was carried out using Pearson correlation. A p value of < .05 was considered as statistically significant.
Results
The demographic characteristics information is shown in . The variables including height, weight, and body mass index (BMI) were compared among the various age groups. As for the height, the difference was statistically significant (p < .05) among the 70–87 years old groups, as well as the 50–59 and 60–69 years old groups. The weight and BMI of the 70–87 years group was statistically significantly different (p < .05) than the 40–49, 50–59, and 60–69 years groups, the 50–59 and 60–69 years groups were statistically significantly different (p < .05) than the 40–49 years groups.
The age-group distal forearm BMD and T-scores in our studied men are shown in . The BMD was the highest in the 40–49 year age-group and lowest in the 70–87 year age-group. The average T-score at the distal forearm was also highest in the 40–49 year age-group and lowest in the 70–87 year age-group. In addition, the average T-score of 70–87 year olds (average T-score = −2.633 ± 1.517) was lower than the osteoporosis threshold (T-score ≤ −2.5). The BMD distal forearm plotted against age is shown in . The BMD at distal forearm decreased as a function of age-group (p < .05).
Figure 1. The BMD distal forearm plotted against age.
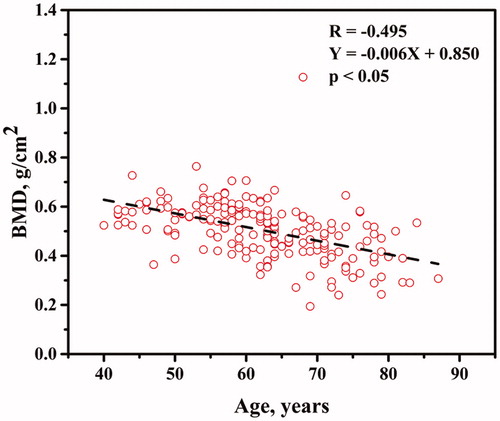
Table 3. Distal forearm BMD and t-scores for different age-groups are shown.
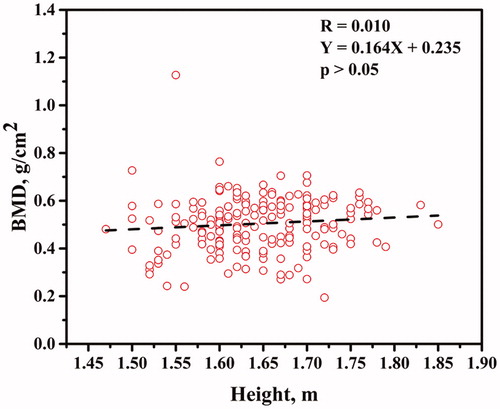
The BMD distal forearm plotted against weight is shown in . The BMD at distal forearm increased as a function of weight (p < .05). The BMD distal forearm plotted against height is shown in . Height had weak impact on the BMD at distal forearm (p > .05).
Figure 2. The BMD distal forearm plotted against weight.
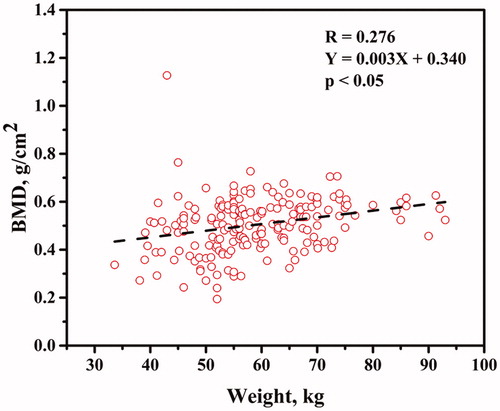
Figure 3. The BMD distal forearm plotted against height.
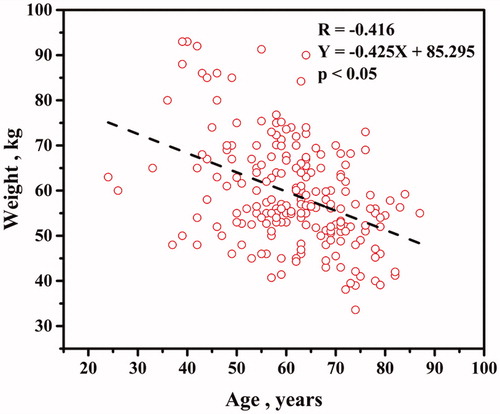
Age plotted against weight is shown in . The weight decreased as a function of age (p < .05). The impact of age on BMD at distal forearm seemed affected by weight.
Figure 4. Age plotted against weight.
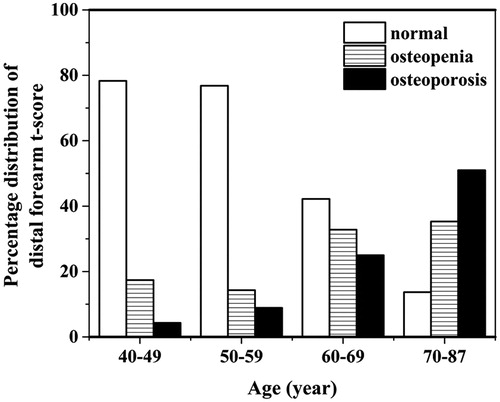
The percentage distribution of distal forearm T-score is shown in . The percentage of osteopenia and osteoporosis are increased as a function of age-group in, while decreased in that of normal bone density.
Figure 5. The percentage distribution of distal forearm T-score.
Discussion
Previous studies have shown that male osteoporosis is associated with morbidity and mortality [Citation6,Citation25]. The prevalence of BMD and osteoporosis in men is still being studied. Our study is focused on men over 40 years of age using a cohort-based cross-sectional study of the distal forearm BMD who reside in Mae Chaem District, Chiang Mai Province, Thailand. Subjects who have taken nutrition supplements (i.e. Calcium, Vitamin D, Vitamin K) were excluded in this study. Our study showed BMD in Thai men aged 40–49, 50–59, and 60–69 years were 0.571 ± 0.071, 0.560 ± 0.075, 0.500 ± 0.126 g/cm2, respectively. A similar study done by Boyanov et al. [Citation7] showed BMDs of the distal forearms in Bulgarian men. Those BMD in men aged 40–49, 50–59, and 60–69 years were 0.543 ± 0.064, 0.530 ± 0.065 and 0.520 ± 0.069 g/cm2, respectively. Although a number of studies have shown that ethnicity plays an important role in BMD, there are also several important risk factors (i.e. age, alcohol abuse, and smoking) for osteoporosis in men, as well [Citation2,Citation11,Citation12].
Not all the risk factors for osteoporosis in our study (i.e. parent history of osteoporosis or low-trauma fractures, parent history of spinal deformity, coffee/tea intake, alcohol intake, smoking, milk intake, eating habits, and exercise) were determined based on age-group, even though the groups as a whole were typical residents having similar lifestyles and histories [Citation7]. Interestingly, our data showed that the eating habits (i.e. fish, beans, and vegetables) (98.45%) had higher prevalence compared with the other risk factors. Iwasaki et al. [Citation19] showed the influence of lifestyle on BMD in Thai young women (age 23.4 ± 2.5 years). These authors demonstrated that milk intake, fish intake, vegetable intake, exercise experience, and family history of osteoporosis showed no significant differences between the low BMD and normal BMD groups. In contrast, the BMD in groups that had experienced fractures were significantly lower than non-fracture experience groups. In addition, other authors showed that there was a rather high prevalence of fracture experiences in the male population [Citation7,Citation24]. It seems reasonable that if a subject population who had experienced fractures had increased, then the occurrence of osteoporosis in the same population would also have increased. The prevalence of fracture experience in our study is rather low (9.79%). However, this fact might be due to recall bias data occurring from the elder subjects.
Age-dependent changes in BMD and osteoporosis occurrence in men have been shown in previous studies [Citation7,Citation10,Citation15,Citation16,Citation26]. Our results also showed that BMD decreased with age. In contrast, Goh et al. [Citation17] have shown that no age-dependent changes in BMD occurred in the spine and hip (L2-L4) of men. These findings demonstrate that it is clear that the BMD and risks for osteoporosis in men depend on various factors.
We believe that a notable strength in this study was that our sample well represented a cross-section of a typical population in Mae Chaem District, Chiang Mai Province, Thailand because these subjects all resided in each of the sub-districts (tambons) of Mae Chaem District. Limitations of the study were that a number of subjects were small in each of the sub-districts of Mae Chaem District. In addition, the questions on the questionnaires that inquired about past history possibly resulted in some recall bias information. Additional information regarding bone formation markers (i.e. Osteocalcine), bone absorption markers (i.e. type 1 collagen cross-linked N-telopeptide), bone turnover-related factors (i.e. Calcium, Vitamin D, Vitamin K) [Citation19] and hypogonadism or testosterone deficiency [Citation27] might be needed, as well.
Male osteoporosis occurrence is likely to be linked with increased health care expenditures [Citation28,Citation29]. Therefore, male osteoporosis has an impact on the economy and society. The diagnostic tools for osteoporosis risk in male populations play an important role in easing that impact. Our pilot study showed the prevalence of osteoporosis in men who resided in Mae Chaem District, Chiang Mai Province, Thailand. A large-scale study and risk factor-related assessment for osteoporosis in males may be needed for obtaining valuable information regarding osteoporosis prevention.
Acknowledgements
We are thankful for the support we received from the local government of Mae Chaem District, Chiang Mai Province, Thailand. We also want to thank all staff and students who participated in this study.
Disclosure statement
No potential conflict of interest was reported by the authors.
Additional information
Funding
References
- Bhardwaj A, Swe KM, Sinha NK, et al. Treatment for osteoporosis in people with ss-thalassaemia. Cochrane Database Syst Rev. 2016;3:CD010429.
- Benagiano G, Maggi S. Osteoporosis in men: an emerging problem. The Aging Male. 2000;3:59–64.
- Bilezikian JP. Osteoporosis in men. J Clin Endocrinol Metab. 1999;84:3431–3434.
- Jones G, Nguyen T, Sambrook PN, et al. Symptomatic fracture incidence in elderly men and women: the Dubbo Osteoporosis Epidemiology Study (DOES). Osteoporosis Int. 1994;4:277–282.
- Miller PD, Siris ES, Barrett-Connor E, et al. Prediction of fracture risk in postmenopausal white women with peripheral bone densitometry: evidence from the National Osteoporosis Risk Assessment. J Bone Miner Res. 2002;17:2222–2230.
- Pande I, Scott DL, O'Neill TW, et al. Quality of life, morbidity, and mortality after low trauma hip fracture in men. Ann Rheum Dis. 2006;65:87–92.
- Boyanov MA, Popivanov PR, Temelkova NL. Prevalence of low forearm bone mineral density in Bulgarian men: a pilot study. Aging Male. 2007;10:9–16.
- Daruwalla ZJ, Huq SS, Wong KL, et al. Hip fractures, preceding distal radius fractures and screening for osteoporosis: should we be screening earlier? A minimum 10-year retrospective cohort study at a single centre. Osteoporos Int. 2016;27:361–366.
- Oyen J, Brudvik C, Gjesdal CG, et al. Osteoporosis as a risk factor for distal radial fractures: a case-control study. J Bone Joint Surg Am. 2011;93:348–356.
- Marwaha RK, Tandon N, Garg MK, et al. Bone health in healthy Indian population aged 50 years and above. Osteoporos Int. 2011;22:2829–2836.
- Waterloo S, Nguyen T, Ahmed LA, et al. Important risk factors and attributable risk of vertebral fractures in the population-based Tromso study. BMC Musculoskelet Disord. 2012;13:163.
- Hoiberg MP, Rubin KH, Gram J, et al. Risk factors for osteoporosis and factors related to the use of DXA in Norway. Arch Osteoporos. 2015;10:16.
- Mgodi NM, Kelly C, Gati B, et al. Factors associated with bone mineral density in healthy African women. Arch Osteoporos. 2015;10:206.
- Wu XP, Liao EY, Zhang H, et al. Determination of age-specific bone mineral density and comparison of diagnosis and prevalence of primary osteoporosis in Chinese women based on both Chinese and World Health Organization criteria. J Bone Mineral Metab. 2004;22:382–391.
- Rogucka E, Jankowska EA, Welon Z, et al. Bone mineral status of Polish men in the course of normal ageing. Andrologia. 2001;33:287–292.
- Liu M, Zhang Y, Cheng X, et al. The effect of age on the changes in bone mineral density and osteoporosis detection rates in Han Chinese men over the age of 50. Aging Male. 2014;17:166–173.
- Goh VH, Tain CF, Tong TY, et al. Managing aging men in Asia: a strategic approach. Aging Male. 2004;7:144–154.
- Davis JW, Novotny R, Ross PD, et al. The peak bone mass of Hawaiian, Filipino, Japanese, and white women living in Hawaii. Calcif Tissue Int. 1994;55:249–252.
- Iwasaki E, Morakote N, Chaovistsaree S, et al. Bone mineral density and bone turnover among young women in Chiang Mai, Thailand. Kobe J Med Sci. 2014;59:E149–E156.
- Pongchaiyakul C, Nguyen TV, Kosulwat V, et al. Effect of urbanization on bone mineral density: a Thai epidemiological study. BMC Musculoskelet Disord. 2005;6:5.
- Malairungsakul O, Wiwatanadate P. Factors related to osteoporosis of postmenopausal women in Phayao, Thailand. Arch Osteoporos. 2013;8:154.
- Sritara C, Thakkinstian A, Ongphiphadhanakul B, et al. Work- and travel-related physical activity and alcohol consumption: relationship with bone mineral density and calcaneal quantitative ultrasonometry. J Clin Densitom. 2015;18:37–43.
- Lombardi A, Ross PD. The assessment of bone mass in men. Calcif Tissue Int. 2001;69:222–224.
- Tuck SP, Raj N, Summers GD. Is distal forearm fracture in men due to osteoporosis? Osteoporosis Int. 2002;13:630–636.
- Jain S, Bilori B, Gupta A, et al. Are men at high risk for osteoporosis underscreened? A quality improvement project. Perm J. 2016;20:60–64.
- Warming L, Hassager C, Christiansen C. Changes in bone mineral density with age in men and women: a longitudinal study. Osteoporosis Int. 2002;13:105–112.
- Lunenfeld B, Mskhalaya G, Zitzmann M, et al. Recommendations on the diagnosis, treatment and monitoring of hypogonadism in men. Aging Male. 2015;18:5–15.
- Levy P, Levy E, Audran M, et al. The cost of osteoporosis in men: the French situation. Bone. 2002;30:631–636.
- Tarride JE, Guo N, Hopkins R, et al. The burden of illness of osteoporosis in Canadian men. J Bone Miner Res. 2012;27:1830–1838.