
Abstract
Objective: Benign prostatic hyperplasia (BPH) and prostate cancer (PCa) are the most common benign and malignant diseases of the prostate gland. The clinical distinction between BPH and PCa should be determined to guide patients to appropriate treatment. We aimed to evaluate the value of PSA, prostate volume (PV) and associated parameters for the detection of PCa in patients with PSA levels of 2.5–30.0 ng/mL.
Materials and methods: A total of 211 men with a biopsy (≥10 cores) and a PSA of 2.5–30.0 ng/ml were included in the study. To evaluate the performance of PV in diagnosing PCa, subjects were divided into PSA 2.5–10.0 ng/ml and PSA 10.1–30.0 ng/ml groups. Age, BMI, PSA, PV, f/t PSA, PSAD, and biopsy Gleason score were included in the analysis.
Results: PCa was diagnosed in 74 (35.1%) of the 211 patients. The differences in f/t PSA, PV, and PSAD for patients with and without PCa were statistically significant. (p < .001). PV was a significantly better indicator of PCa than PSAD and f/t PSA ratio in both groups.
Conclusions: PV plays an active role in predicting PCa in patients with PSA in gray-zone as well as in patients with PSA 10.1–30 ng/mL.
Introduction
Benign prostatic hyperplasia (BPH) and prostate cancer (PCa) are the most common benign and malignant diseases of the prostate gland, respectively [Citation1]. PCa is the most frequent type of cancer in men in the United States and particularly in elderly men in Europe [Citation2,Citation3]. It is the second leading cause of cancer-related death in men [Citation2]. The clinical distinction between BPH and PCa should be determined to guide patients to appropriate treatment.
The prostate-specific antigen (PSA) was first described by Wang et al. [Citation4]. Initially used only in the diagnosis and treatment of prostate diseases due to its specificity, over time, PSA has also been increasingly employed for the differentiation between BPH and PCa. However, one disadvantage of PSA is that at 2.5–10 ng/mL, it has a low specificity for the diagnosis of cancer [Citation5]. Therefore, transrectal ultrasound-guided biopsy (TRUS-bx) is a safe and easily applicable method that remains the most important diagnostic tool in the diagnosis of PCa [Citation6]. However, despite the safety of this method, it is important to determine the patients for whom a biopsy is required and avoid unnecessary procedures to minimize possible complications, such as pain, infection, bleeding, and sepsis. For this reason, to increase the diagnostic value of PSA in the differential diagnosis of BPH and PCa in cases with high PSA values, various methods and parameters have been utilized, including patient age, digital rectal examination, prostate volume (PV), PSA density (PSAD), and the free/total PSA (f/tPSA) ratio [Citation7–9].
In 1995, Catalona et al. suggested that the f/tPSA ratio may help reduce unnecessary biopsy procedures and increase the detection of PCa in patients with a PSA value in the gray zone (4–10 ng/mL) [Citation10]. Another parameter, PSAD, was first defined by Benson et al. [Citation8] based on the idea that PCa secretes a greater amount of PSA into the circulation per unit of PV compared to BPH. Several studies have confirmed the importance of PSAD [Citation11–13]. However, there are also researchers suggesting that PSAD makes no contribution to the prediction of PCa [Citation14,Citation15]. It is known that PV is lower in patients with existing PCa than in those with BPH [Citation16,Citation17]. Nevertheless, the use of PV as a diagnostic tool in the process of biopsy decision-making for the prediction of PCa is limited in the literature. In the screening of 525 patients undertaken within the scope of European Randomized Study Of Screening For Prostate Cancer (ERSPC) in 2010 PV was found to be a high-level predictor of PCa [Citation18]. In addition, an ERSPC conducted in 2012 demonstrated the key role of PV in the prediction of PCa [Citation19].
In the current study, we investigated the relationship of PV with the f/tPSA ratio and PSAD in predicting PCa in patients found to have a PSA value of 2.5–30 ng/mL. Our hypothesis was that in all patients with a PSA of <30 ng/mL, PV is superior to PSA and other related parameters in predicting PCa.
Material and method
After obtaining the approval of the ethics committee of the university we evaluated a total of 269 patients that underwent TRUS-bx in our clinic between January 2015 and June 2018 due to having either a PSA value of greater than 4 or any PSA value but with suspicious rectal examination findings were retrospectively reviewed. Excluded from the study were patients older than 80 or younger than 40 years of age, those with a PSA value of over 30, those using 5-alpha-reductase inhibitors, and those with a history of prostate surgery due to BPH. Other exclusion criteria were a history of rectal intervention, cystoscopy, acute prostatitis and urinary retention within the past month. After applying the exclusion criteria, 211 patients were included in the study.
TRUS-bx was performed by two experienced urologists (AE, EK). After applying the periprostatic nerve block with 10 ml 1% lidocaine, the prostate biopsy was undertaken using a 20-gauge needle. The pre-biopsy PV was calculated on TRUS according to the ellipsoid formula (height × width × length × 0.52). The PSA levels were measured in ng/mL by electrochemiluminescence. The weight of the patients was recorded in kilograms and height in meters. The body mass index (BMI) was also calculated (kg/m2). According to the pathology results, the patients were divided into two groups as malignant (PCa) and benign (BPH). The patients’ age, PSA value, PV on TRUS, number of biopsy cores, biopsy pathology result, number of cancer-involved cores, and Gleason score were evaluated. For the PCa group, the number of positive focus areas was also noted. The success of PV, PSAD and f/tPSA ratio in predicting PCa was compared in all patients and between the lower PSA and higher PSA groups.
Statistical analysis
The data were analyzed using SPSS version 25.0 (SPSS®, IL, USA). The Shapiro–Wilk test was used to evaluate the conformance of the data to the normal distribution curve. The continuous and categorical data were compared using the Mann–Whitney U-test and the chi-square test, respectively. The relationship of biopsy results with age, BMI, PSA, PV, f/tPSA, PSAD, and the Gleason score was investigated by a univariate analysis using the Mann–Whitney U and chi-square tests for the groups with PSA levels of 2.5–10.0 and 10.1–30.0 ng/mL. Logistic regression multivariate analysis was performed to determine the independent predictive factors for positive prostate biopsy results. The receiver operating characteristic (ROC) curve was employed to evaluate and compare the efficacy of f/t PSA, PV, and PSAD for the diagnosis of PCa. p values of <.05 was considered statistically significant.
Results
The mean age of the 211 patients included in the study was 65.49 ± 6.8 (42–79) years. The mean total PSA of the patients was 9.55 ± 5.42 (2.04–29.9) ng/mL, the f/tPSA ratio 0.23 ± 0.09 (0.045–0.574), PV 63.8 ± 30.7 (20–200) mL, BMI 26.9 ± 3.28 (18.9–43.2) kg/m2, and the mean PSAD 0.118 ± 0.160 (0.029–1.197 ng/mL). PCa was detected in 74 patients (35.07%) ().
Table 1. Clinical characteristics of patients.
The PCa group was significantly older than the BPH group, but this significance was close to the threshold (67.0 ± 7.0 vs 64.6 ± 6.5; p = .044). The differences in f/t PSA, PV, and PSAD for patients with and without PCa were statistically significant. (p < .001) There were no significant differences between the groups for BMI and total PSA. (p = .976 and p = .963, respectively) ().
Table 2. Comparison of patients’age, bmi, total psa, prostate volume, PSAD between Cancer and non-cancer groups.
For patients with a PSA of 2.5–10 ng/ml, there were no statistically significant differences between the groups for age, BMI and total PSA. (p = .924, p = 1.000 and p = .101, respectively) The mean f/t PSA ratio and PV were statistically significantly lower in patients with PCa (p = .001 and p < .001, respectively). PSAD was statistically significantly higher in patients with PCa (p < .001) ().
Table 3. Comparison of patients’age, BMI, total PSA, F/T PSA, prostate volume and PSAD between cancer and non-cancer groups with PSA 2.5–10 ng/ml and PSA 10.1–30 ng/ml.
For patients with a PSA of 10.1–30 ng/ml, the mean age of 26 patients with prostate cancer was significantly higher than that of the 41 patients without prostate cancer (p = .001). There were no statistically significant differences between the groups for BMI and total PSA. (0.749 and p = .183, respectively) The mean f/t PSA ratio and PV were significantly lower in patients with PCa. (p = .009 and p < .001, respectively) PSAD was significantly higher in patients with PCa. (p < .001) ().
The AUCs for PSAD, PV and f/t PSA ratio for predicting PCa in patients with PSA values between 2.5–10 ng/mL and 10.1–30 ng/mL were 0.693, 0.773, 0.671 and 0.801, 0.816, 0.689, respectively. () PV was a significantly better indicator of PCa than PSAD and f/t PSA ratio in both groups. The order of AUC values to predict prostate cancer was determined as PV > PSAD > f/tPSA ( and and ).
Figure 1. The ROC analysis for F/T PSA, prostate volume and PSA density alone in predicting prostate cancer with a PSA of 2.5–10.0 ng/ml.
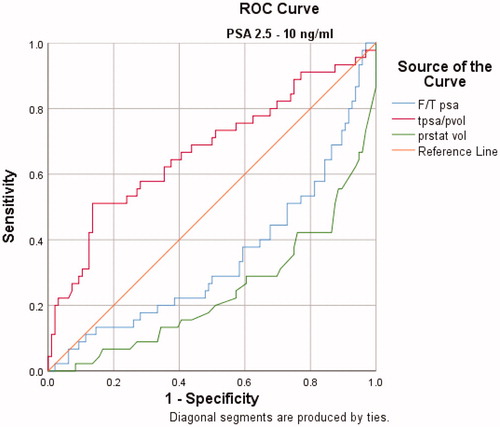
Figure 2. The ROC analysis for F/T PSA, prostate volume and PSA density alone in predicting prostate cancer with a PSA of 10.1–30.0 ng/ml
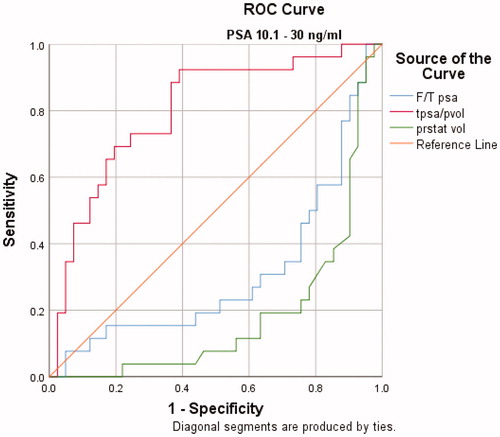
Table 4. The AUCs for F/T PSA, prostate volume and PSA density in predicting risk of prostate cancer stratified by PSA.
ROC analysis revealed a cutoff value of 43.5 cc for prostate volume in patients with PSA values between 2.5–10 ng/mL. At the cutoff value of 43.5 cc, the sensitivity and specificity were 60%, 76%, respectively. In patients with PSA values between 10.1–30 ng/mL, ROC analysis revealed a cutoff value of 61.5 cc for prostate volume. At this cutoff value, the sensitivity and specificity were 80%, 76%, respectively.
On multivariate analysis, PV (as either a continuous or categorical variable) was found to be an independent predictor of PCa. In patients with PSA values between 2.5–10 ng/mL, men with a PV of <43.5 cc were found to be at an increased risk of having PCa with an odds ratio of 0.135 when compared to those with a PV of >43.5 cc. Similarly, in patients with PSA values between 10.1–30 ng/mL, men with a PV of <61.5 cc were found to be at an increased risk of having PCa with an odds ratio of 0.114 when compared to those with a PV of >61.5 cc. ( and )
Table 5. Comparison of patients’age, BMI, total PSA, prostate volume, PSAD, biopsy result and Gleason score according to the cutoff value of prostate volume with PSA 2.5–10 ng/ml and PSA 10.1–30 ng/ml.
Table 6. Multivariate analyses for patients with PSA of PSA 2.5–10 ng/ml and PSA 10.1–30 ng/ml.
Discussion
It is known that PSA increases with the advancing age of the patients [Citation20]. It has been suggested that the age-related increase in PSA is associated with a greater PV for non-cancerous reasons and higher incidence of inflammation of the prostate gland. Arivazhagan et al. showed that IL-17, a proinflammatory cytokine, was significantly higher in the serum in patients with BPH compared to the control group, suggesting that there might be a relationship between increased PV and inflammatory events [Citation21]. In addition, Sreenivasulu et al. reported that the phosphatidylinositol 3-kinase pathway (PI3K-Akt), which plays an important role in the development of PCa, is also involved in the development of BPH and contributed to the molecular basis of increased PV by preventing apoptosis [Citation22].
It is estimated that ∼80% of prostate adenocarcinoma is caused by epithelial cells in the peripheral zone of the prostate gland [Citation23]. BPH emerges, in almost all cases, from the transitional zone and leads to a clinical symptomatology known as lower urinary tract symptoms (LUTS), with the severity and response to treatment varying according to genetic differences [Citation23,Citation24]. It is important to distinguish between PCa and BPH, which are commonly seen in men and have completely different treatment methods. When making this distinction, the aim is to identify PCa, which is of clinical significance, and to avoid unnecessary biopsies.
The relationship between PV and incidence of PCa has been evaluated in many studies. Ohwaki et al. reported that PV tended to be higher in cases with incidentally detected cancer after holmium laser enucleation, but the difference was not statistically significant [Citation25] in contrast to many other studies demonstrating that PV and PCa incidence are inversely correlated [Citation26,Citation27]. Kobayashi et al. found PV to be an independent factor in the detection of PCa in patients aged 70 years and over with a PSA of 2.5–10 ng/mL [Citation28]. In the current study, the PV values were significantly lower in the PCa group compared to the BPH group for both PSA levels examined irrespective of age. In the PSA 2.5-10 ng/ml group, 29 of the 42 patients (69%) with a PV of <43.5 ml had cancer, whereas 83 of 102 patients (81.4%) with a PV of >43.5 ml had benign biopsy results. Similarly, in the PSA 10.1–30 ng/mL group, 21 of 31 patients (67.7%) with a PV of <61.5 ml had cancer, while 31 of 36 patients (86.1%) with a PV of >61.5 ml did not have cancer. Based on these results, it is considered that PV was more helpful than PSAD and f/tPSA ratio in predicting cancer for both PSA levels. In a previous study evaluating the efficacy of PSAD, the authors determined that at the cutoff value of >0.015, PSAD provided significant results in the detection of PCa in cases with a PV of lower than 35 cc, but not for those with a PV of greater than 65 cc [Citation26].
When using biopsy as a diagnostic tool for cancer detection, the number of biopsy cores has been another subject of discussion. Some studies showed that the increased number of biopsy cores increases the cancer detection rate, and therefore a conventional sextant biopsy results in overlooking a significant number of cancer-involved cores [Citation29–31]. The hypothesis of these studies was based on the inability to detect the same volume of cancerous cores in increased PV. On the other hand, there are other reports indicating that increasing the number of biopsy cores does not improve the cancer detection rate [Citation32,Citation33]. Ung et al. demonstrated that cancer detection was not increased, especially in patients with increased PV or those who were older, despite the larger number of samples obtained through more biopsies [Citation33].
A tumor volume below 0.5 cc is often considered a clinically insignificant PCa volume. Chen et al. found that the volume of cancerous tissue detected in prostates with a large volume was lower compared to cases of high PV [Citation27]. Therefore, the lower rate of PCa in increased PV cannot be simply explained by a sampling error. These studies suggest that BPH and increased PV may have a preventive role against PCa development through various mechanisms. An example of these mechanisms is the higher level of insulin, insulin resistance, and insulin-like growth hormone-1 in patients with BPH compared to the PCa and control groups, as shown in the study by Grosman et al. [Citation34].
In recent years, the widespread use of MRI in the detection of PCa and targeted prostate biopsies has minimized the number of sampling errors in enlarged prostate glands [Citation17]. According to the study by Gorski et al., MR fusion and targeted prostate biopsy had a PCa detection rate of 77% in a PV below 30 cc while this rate is reduced to 34% for PVs of greater than 55 cc. The authors found no difference in the rate of cancer detection between MRI and TRUS-bx techniques at a PV of lower than 40 cc; however, 12 patients with a PV of greater than 40 cc were only diagnosed with PCa based on the MRI fusion findings. At the same time, despite the fewer sampling errors in MRI fusion, the PCa detection rate was lower at large PVs [Citation17]. Consistently, our results indicated lower diagnosis rates of PCa at higher PVs.
In a study prospectively evaluating 1042 patients who underwent MRI fusion and 12-core systemic prostate biopsies after MRI, an inverse correlation was reported between PV and clinically significant PCa with a Gleason score of 7 or above [Citation35]. In another study, a similar relationship was observed between small prostates and high-grade cancer [Citation16]. In addition to the higher detection of PCa in low-volume prostates, the higher clinical significance and grade of cancer compared to cases with larger PVs strengthens our hypothesis that low-volume prostates should be carefully evaluated.
The limitations of the current study can be considered as the relatively small sample size, retrospective design, and potential insufficiencies in the PV and Gleason score assessments due to the lack of radical prostatectomy specimens. However, considering previous studies, the current research has made a contribution to the literature by presenting that PV is one step ahead of other parameters in the detection of PCa.
According to the results of this study, PV plays an active role in predicting PCa in patients with a PSA value in the gray zone and those with a higher PSA (10.1–30 ng/mL). We suggest that patients with a low PV should be evaluated more carefully for malignancy and PV should be taken into consideration when making a biopsy decision.
Disclosure statement
No potential conflict of interest was reported by the authors.
References
- Bosch JL, Hop WC, Kirkels WJ, et al. The International Prostate Symptom Score in a community-based sample of men between 55 and 74 years of age: prevalence and correlation of symptoms with age, prostate volume, flow rate and residual urine volume. Br J Urol. 1995;75:622–630.
- Siegel R, Ma J, Zou Z, et al. Cancer statistics, 2014. CA Cancer J Clin. 2014;64:9–29.
- Arnold M, Karim-Kos HE, Coebergh JW, et al. Recenttrends in incidence of five common cancers in 26 European countries since 1988: analysis of the European cancer observatory. Eur J Cancer. 2013;51:1164–1187.
- Wang MC, Papsidero LD, Kuriyama M, et al. Prostate antigen: a new potential marker for prostatic cancer. Prostate. 1981;2:89–96.
- Yoshida K, Honda M, Sumi S, et al. Levels of free prostate-specificantigen (PSA) can be selectively measured by heat treatment of serum: free/ total-PSA ratios improve detection of prostate carcinoma. Clin Chim Acta. 1999;280:195–203.
- Taş M, Kaygısız O, Inal G, et al. Comparison of patient comfort and complications of transrectal ultrasonography guided prostate biopsies using 16 and 18 gaugeneedles. J Urol. 2005;31:119–122.
- Polascik TJ, Oesterling JE, Partin AW. Prostate specific antigen: a decade of discovery-what we have learned and where we are going. J Urol. 1999;162:293–306.
- Benson MC, Whang IS, Pantuck A, et al. Prostate specific antigen density: a means of distinguishing benign prostatic hypertrophy and prostate cancer. J Urol. 1992;147:815.
- Benson MC, Whang IS, Olsson CA, et al. The use of prostate specific antigen density to enhance the predictive value of intermediate levels of serum prostate specific antigen. J Urol. 1992;147:817–821.
- Catalona WJ, Smith DS, Wolfert RL, et al. Evaluation of percentage of free serum prostate-specific antigen to improve specificity of prostate cancer screening. JAMA. 1995;274:1214–1220.
- Catalona WJ, Partin AW, Slawin KM, et al. Use of the percent age of free PSA to enhance differentiation of prostate cancer from benign prostatic disease: a prospective multicenter clinical trial. JAMA. 1998;279:1542–1547.
- Seaman E, Whang M, Olsson CA, et al. PSA density (PSAD). Role in patient evaluation and management. Urol Clin North Am. 1993;20:653–663.
- Ghafoori M, Varedi P, Hosseini SJ, et al. Value of prostate-specific antigen and prostate-specific antigen density in detection of prostatecancer in an Iranian population of men. Urol J. 2009;6:182–188.
- Cookson MS, Floyd MK, Ball TP, et al. The lack of predictive value of prostate specific antigen density in the detection of prostate cancer in patients with normal rectal examinations and intermediate prostate specific antigen levels. J Urol. 1995;154:107.
- Mueller EJ, Coventry J, Desmond PM, et al. Relative performance characteristics of prostate specific antigen and prostatic specific antigen density for the diagnosis of carcinoma of the prostate. Urol Oncol. 1995;1:84.
- Freedland SJ, Isaacs WB, Platz EA, et al. Prostate size and risk of high-grade, advanced prostate cancer and biochemical progression after radical prostatectomy: a search database study. Jco. 2005;23:7546–7554.
- Gorski A, Rouprêt M, Peyronnet B, et al. Accuracy of magnetic resonance imaging/ultrasound fusion targeted biopsies to diagnose clinically significant prostate cancer in enlarged compared to smaller prostates. J Urol. 2015;194:669–673.
- Cavadas V, Osorio L, Sabell F, et al. Prostate cancer prevention trial and European randomized study of screening for prostate cancer risk calculators: a performance comparison in a contemporary screened cohort. Eur Urol. 2010;58:551–558.
- Roobol MJ, Schroder FH, Hugosson J, et al. Importance of prostate volume in the European randomised study of screening for prostate cancer (ERSPC) risk calculators: results from the prostate biopsy collaborative group. World J Urol. 2012;30:149–155.
- Oesterling JE, Jacobsen SJ, Chute CG, et al. Serum prostatespecific antigen in a community-based population of healthy men. Establishment of age-specific reference ranges. JAMA. 1993;270:860–864.
- Arivazhagan J, Nandeesha H, Dorairajan LN, et al. Association of elevated interleukin-17 and angiopoietin-2 with prostate size in benign prostatic hyperplasia. Aging Male. 2017;20:115–118.
- Sreenivasulu K, Nandeesha H, Dorairajan LN, et al. Over expression of PI3K-AkT reduces apoptosis and increases prostate size in benign prostatic hyperplasia. Aging Male. 2018;6:1–7.
- Marks LS, Roehrborn CG, Wolford E, et al. The effect of dutasteride on the peripheral and transition zones of the prostate and the value of the transition zone index in predicting treatment response. J Urol. 2007;177:1408–1413.
- Qian X, Xu D, Liu H, et al. Genetic variants in 5p13.2 and 7q21.1 are associated with treatment for benign prostatic hyperplasia with the α-adrenergic receptor antagonist. Aging Male. 2017;20:250–256.
- Ohwaki K, Endo F, Shimbo M, et al. Comorbidities as predictors of incidental prostate cancer after Holmium laser enucleation of the prostate: diabetes and high-risk cancer. Aging Male. 2017;20:257–260.
- Al-Khalil S, Boothe D, Durdin T, et al. Interactions between benign prostatic hyperplasia (BPH) and prostate cancer in large prostates: a retrospective data review. Int Urol Nephrol. 2016;48:91–97.
- Chen ME, Troncoso P, Johnston D, et al. Prostate cancer detection: relationship to prostate size. Urology. 1999;53:764–768.
- Kobayashi T, Mitsumori K, Kawahara T, et al. Prostate gland volume is a strong predictor of biopsy results in men 70 years or older with prostate-specific antigen levels of 2.0-10.0 ng/mL. Int J Urol. 2005;12:969–975.
- Eskew LA, Bare RL, McCullough DL. Systematic 5 region prostate biopsy is superior to sextant method for diagnosing carcinoma of the prostate. J Urol. 1997;157:199–202.
- Babaian RJ, Toi A, Kamoi K, et al. A comparative analysis of sextant and an extended 11-core multisite directed biopsy strategy. J Urol 2000; 163:152–157.
- Presti JC Jr, Chang JJ, Bhargava V, et al. The optimal systematic prostate biopsy scheme should include 8 rather than 6 biopsies: results of a prospective clinical trial. J Urol. 2000;163:163–166.
- Kobayashi T, Nishizawa K, Watanabe J, et al. Effects of sextant transrectal prostate biopsy plus additional far lateral cores in improving cancer detection rates in men with large prostate glands. Int J Urol. 2004;11:392–396.
- Ung JO, San Francisco IF, Regan MM, et al. The relationship of prostate gland volume to extended needle biopsy on prostate cancer detection. J Urol. 2003;169:130–135.
- Grosman H, Fabre B, Lopez M, et al. Complex relationship between sex hormones, insulin resistance and leptin in men with and without prostatic disease. Aging Male. 2016;19:40–45.
- Filson CP, Natarajan S, Margolis DJA, et al. Prostate cancer detection with magnetic resonance-ultrasound fusion biopsy: the role of systematic and targeted biopsies. Cancer. 2016;122:884–892.