
Abstract
Background and objectives
Evidence has supported obesity as a risk factor for both benign prostate hyperplasia (BPH) and hypogonadism. In this paper, we performed a retrospective study and discussed the prevalence of testosterone deficiency (TD) and its relationship to body mass index (BMI) in aging Chinese men with BPH who have surgical intervention.
Material and methods
We reviewed the clinical data by age, BMI, medical history, serum prostate-specific antigen (PSA) levels, serum total testosterone (TT) levels, biochemical analysis, and transrectal ultrasound. BMI and other variables were considered to be independent variables in an effort to evaluate any potential associations between these factors and TD status using non-adjusted and multivariate-adjusted regression models.
Results
Of the 795 BPH participants, 27.2% (216) patients had TD. After adjusting for all potential covariates, there was a similar J-shaped relationship between BMI and TD, with an inflection point of 19.2 kg/m2. The effect sizes and the confidence intervals on the left and right sides of this inflection point were 0.6 (0.4–1.0) (p = .043) and 1.2 (1.1–1.3) (p < .001), respectively.
Conclusion
Nearly one-third of the aging Chinese BPH patients had TD in this study. The association between BMI and TD is not simple. A J-shaped curve correlation was detected. BMI was positively correlated with TD when it was over 19.2 kg/m2 and inversely correlated with TD when it was below 19.2 kg/m2. Long-term prospective studies are needed to confirm these findings.
Introduction
Testosterone deficiency (TD, commonly known as hypogonadism), has received much attention in recent years due to its close association with many diseases, which leads to an increased risk of mortality [Citation1,Citation2]. TD is a group of clinical syndromes caused by decreased serum testosterone levels. The pathophysiology of TD is multifactorial and associated with comorbidities, including obesity, hypertension, atherosclerosis and cardiovascular disease, insulin resistance and type-2 diabetes mellitus, inflammation, sexual dysfunction and cognitive impairment [Citation3–6].
In older male individuals, BPH is a well-recognized medical condition with important health implications [Citation7,Citation8]. Meanwhile, these aging males may have several of the above mentioned diseases simultaneously. Although it is unclear how these combined factors have an effect on serum testosterone levels, testosterone is recognized as an important factor in the development of BPH [Citation9]. In the Proscar Long-term Efficacy and Safety Study (PLESS) and the Medical Therapy of Prostatic Symptoms Study (MTOPS), Kaplan et al. reported that approximately one-fifth to one-quarter of BPH patients have low serum testosterone [Citation10,Citation11]. Obesity is thought to contribute to low testosterone in these BPH patients. However, these studies only performed a crude analysis of the relationship between body mass index (BMI) and hypogonadism, and the study population comprised BPH patients in the early stage. Clinical evidence suggests that obesity is not only associated with an increased risk of clinical BPH, as defined by the initial diagnosis of BPH, the initiation of BPH medical treatment, and prostate surgery [Citation12–16], but is also associated with a greater risk of failure of the medical or surgical management of BPH [Citation17,Citation18,Citation19]. Whether there is any change in this correlation between BMI and TD among advanced BPH patients, however, remains to be assessed. In addition, although obesity also has a significant upward trend in the Chinese population, the classification of obesity differs from that in Europe and the United States [Citation20–22]. A greater understanding of the relationship between obesity and TD in BPH patients could allow physicians to identify suspected patients who may need early intervention.
In this present paper, we performed a retrospective cross-sectional study in aging Chinese males with BPH who underwent surgery and discussed the true relationship between BMI and TD. New correlations were developed with excellent results.
Material and methods
Study population and design
We retrospectively reviewed the medical data of hospital inpatients treated for BPH at our department in Xinhua Hospital, School of Medicine, Shanghai Jiao Tong University from December 1 2012 to September 30 2018.
The general characteristics evaluated for each patient included age, height, weight, usage of medications at time of admission, medical history and the following comorbidities: hypertension, coronary disease, liver disease, dyslipidemia, diabetes, and tumors of any type. Serum blood samples were drawn after overnight fasting for at least 8 h between 6:00 AM and 8:00 AM. Blood levels of total cholesterol, triglycerides, high-density lipoprotein cholesterol (HDL-c), low-density lipoprotein cholesterol (LDL-c), total protein, albumin, creatinine, uric acid, and plasma glucose were measured using standard laboratory techniques in our hospital. The prostate-specific antigen (PSA) and total testosterone (TT) concentrations were detected by electrochemiluminescence immunoassay. Transrectal ultrasound (TRUS) was used to estimate prostate volume using a Siemens sequoia 512 ultrasound machine (EV8C4-S, frequency 3–8 MHz).
The inclusion criteria were as follows: no use of 5 alpha-reductase inhibitors in the last 6 months, accepted surgical operation, and benign pathological outcome. The exclusion criteria were malignancy and the presentation of any of the following comorbidities: liver dysfunction or psychological disease, use of hormones or steroidal agents, use of antiandrogen or antifungal agents, and surgical history of BPH.
BMI was calculated by weight in kilograms divided by the square of height in meters and was categorized as normal weight (<24 kg/m2), overweight (24 to <28 kg/m2), and obesity (≥28 kg/m2), based on the guidelines for prevention and control of overweight and obesity in Chinese adults [Citation22]. TD was defined as a serum value less than 10.4 nmol/L (300 ng/dL) [Citation10,Citation11,Citation23–25].
The study was performed in accordance with applicable laws and regulations, and ethical principles as described in the Declaration of Helsinki. The Ethics Committee of Xinhua Hospital, School of Medicine, Shanghai Jiao Tong University approved the study protocol and informed consent was exempted.
Statistical analysis
Data were expressed as the mean (standard deviation, SD) or median (interquartile range) for continuous variables, depending on the data distribution and percentages (%) for categorical variables. The differences between groups were verified with Chi-square tests for categorical variables or by independent t-tests (one-way ANOVAs) for continuous variables. A univariate linear regression model was used to evaluate the associations between factors of interest and TD status. We then applied multiple logistic regression models to evaluate the independent relationship between BMI and TD. Both non-adjusted and multivariate adjusted models were applied for potential confounders. Whether the covariance was adjusted was determined based on the following principle: if, when added to this model, the covariance changed the matched odds ratio by at least 10%, the adjustment was made [Citation26]. We also used a generalized additive model (GAM) to identify nonlinear relationships. If a nonlinear relationship was observed, a two-piecewise linear regression model was constructed to calculate the threshold effect of BMI on TD status according to the resultant smoothing plot. When the relationship between BMI and TD clearly emerged in this smoothed curve, a recursive method was used to automatically determine the inflection point, which was then used in subsequent analyses [Citation27]. All analyses were performed using Empower(R) (www.empowerstats.com, X&Y Solutions, Inc., Boston, MA) and R (http://www.R-project.org). A 2-tailed p < .05 was considered statistically significant.
Results
A total of 795 BPH patients were included in our study. The median age was 71.0 (66.0–78.0) years old. The prevalence of TD was 27.2% (216/795) in the overall study population. The baseline clinical characteristics of this group are shown in . Among the groups of patients with different BMIs, there were no statistically significant differences in cholesterol, LDL-c, serum creatinine, fasting plasma glucose, total prostate volume, coronary heart disease or diabetes mellitus. Patients with low BMI (<24 kg/m2) were significantly older and had higher PSA, higher testosterone, lower triglycerides, higher HDL-c, lower uric acid, lower total protein, lower albumin and a lower proportion of hypertension.
Table 1. The baseline characteristics of patients with benign prostate hyperplasia.
The results of the univariate analysis are shown in . Age, BMI, hypertension, diabetes, PSA, triglyceride, HDL-c, serum creatinine, uric acid, albumin, fasting plasma glucose, and total prostate volume were all correlated with TD.
Table 2. Univariate analysis for factors related to testosterone deficiency.
Multiple logistic regression analysis revealed that BMI was positively correlated with TD in the non-adjusted model (OR = 1.1, 95% CI: 1.1–1.2, p < .001). After adjusting for age, HDL-c and albumin, the results were still significant (OR = 1.2, 95% CI: 1.1–1.2, p < .001). After adjusting for age, hypertension, diabetes, PSA, triglyceride, HDL-c, albumin, fasting plasma glucose, and total prostate volume, significant results remained (OR = 1.2, 95% CI: 1.1–1.3, p < .001) ().
Table 3. The association between body mass index and testosterone deficiency in different models.
Further statistical analysis showed a nonlinear relationship between BMI and TD after adjusting for age, hypertension, diabetes, PSA, triglyceride, HDL-c, albumin, fasting plasma glucose, and total prostate volume (). Based on a two-piecewise linear regression model, we found that the BMI cut point was 19.2 kg/m2. The effect sizes and the confidence intervals on the left or right side of this model were, respectively, 0.6 (0.4, 1.0) (p = .043), and 1.2 (1.1, 1.3) (p < .001) ().
Figure 1. Association between body mass index (kg/m2) and testosterone deficiency. A threshold, nonlinear association between body mass index and testosterone deficiency was found in a generalized additive model. The middle line represents the smooth curve fit between variables. Upper and lower bands represent the 95% of confidence interval from the fit. All adjusted for age, hypertension, diabetes, prostate specific antigen, triglyceride, high-density lipoprotein cholesterol, albumin, fasting plasma glucose and total prostate volume.
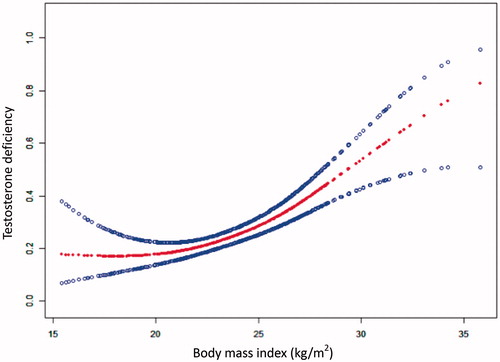
Table 4. The association between body mass index and testosterone deficiency according to the body mass index cut point with a piecewise linear regression model.
Discussion
Prior reported studies have documented the possible association between BMI and TD in BPH patients [Citation10,Citation11]. Kaplan et al. reported that the prevalence of low serum testosterone observed in patients with BPH was approximately 21.7% in the PLESS and 25.7% in the MTOPS [Citation10,Citation11]. The prevalence of TD increased with increasing BMI. Similar results could also be found in the Chinese population in Taiwan[Citation24]. Our results are in general agreement with those of previous clinical studies [Citation10,Citation11,Citation24]. The overall prevalence of low testosterone is 27.2%. However, these studies only made a crude analysis of the relationship between BMI and TD, and did not fully consider the influence of other confounding factors. In addition, the definition and degree of obesity in the Chinese population are different from those in the Western developed countries [Citation22].
In this study, we adjusted for the impact of possible confounding factors and used a GAM (generalized additive model) to identify nonlinear relationships. We found a similar J-shaped relationship between BMI and TD. A distinct correlation between BMI and TD was observed on the left and right sides of the inflection point (BMI = 19.2 kg/m2) in this model. When BMI was less than 19.2 kg/m2 (left side of the cut point), a borderline negatively significant association for TD was detected (OR = 0.6 [0.4, 1.0], p = .043). The probability of TD declined as BMI increased. However, it was opposite. When BMI was greater than 19.2 kg/m2 (right side of the cut point), the incidence of TD gradually upped with the BMI increasing (OR = 1.2 [1.1, 1.3], p < .001).
These findings extend those of earlier studies, confirming that obesity is the clinical condition most strongly associated with lowered testosterone concentrations in men [Citation28,Citation29]. However, a surprising observation noted in our study was the lack of a relationship between lower BMI and a lower likelihood of hypogonadism. When the BMI decreased below a certain level, extreme underweight may also lead to TD. The interpretation of the results seems to be more difficult. Some researchers have found similar phenomena among male athletes who had lower body fat [Citation30,Citation31]. However, the population in our study was middle-aged and elderly BPH patients who had no frequent physical activity. Further analysis of this population found that they have relatively low hemoglobin. Testosterone plays a significant role in erythropoiesis. In a cross-sectional study, Shin et al. observed that patients with low testosterone levels had low hemoglobin and hematocrit levels [Citation32]. In a controlled clinical trial, testosterone treatment significantly increased the hemoglobin levels among older men with low testosterone levels [Citation33]. Low body fat, unbalanced nutrition or the combination of both may have causally been involved in the development of secondary TD [Citation34].
Previous studies have shown that the obesity-hypogonadism relationship is bidirectional [Citation28]. There are numerous causative and correlative factors on both sides of the equation [Citation28,Citation29]. Recent evidence confirms that these two conditions exacerbate each other, and we are only beginning to understand how by treating one of these conditions, we can help to treat the other as well [Citation29,Citation35–38]. Our results provide new evidence that obesity and hypogonadism do not have a simple relationship. Physicians should be aware of the possibility of hypogonadism when patients are overweight or underweight and consider testing serum testosterone levels.
However, some limitations are worth noting. Although the present study was supported statistically, our cross-sectional study could not be used to determine causal relationships. Serum testosterone levels were only measured once and might not reflect patients’ typical testosterone levels. There may also have some selection bias, as the population included in these analyses were individuals who needed surgery intervention. The results regarding the prevalence of and relationship between TD and obesity need to be interpreted with caution.
Conclusion
Nearly one-third (27.2%) of the aging BPH patients in this study who need surgery have low serum testosterone levels. The association between BMI and TD is not simple. A J-shaped curve correlation was detected in this study. TD gradually decreased as BMI increased when it was below cutoff value 19.2 kg/m2. However reversely, TD was progressively rising as BMI increased when it was over 19.2 kg/m2. Long-term prospective studies are needed to confirm these findings.
Acknowledgements
The authors gratefully acknowledge the help of Dr. Yun-Kai Zhu, Dr. Ya-Qing Chen for their excellent technical assistance in the ultrasound examinations. Thanks are also extended to American Journal Experts (AJE) Company for professional English improvement.
Disclosure statement
The authors report no conflict of interest.
Additional information
Funding
Related Research Data
References
- Shores MM, Matsumoto AM. Testosterone, aging and survival: biomarker or deficiency. Curr Opin Endocrinol Diabetes Obes. 2014;21:209–216.
- Muraleedharan V, Jones TH. Testosterone and mortality. Clin Endocrinol. 2014;81:477–487.
- Saad F, Rohrig G, von Haehling S, et al. Testosterone deficiency and testosterone treatment in older men. Gerontology. 2017;63:144–156.
- Dean JD, McMahon CG, Guay AT, et al. The international society for sexual medicine's process of care for the assessment and management of testosterone deficiency in adult men. J Sexual Med. 2015;12:1660–1686.
- Traish AM. Adverse health effects of testosterone deficiency (TD) in men. Steroids. 2014;88:106–116.
- Russo GI, Castelli T, Urzi D, et al. Connections between lower urinary tract symptoms related to benign prostatic enlargement and metabolic syndrome with its components: a systematic review and meta-analysis. Aging Male. 2015;18:207–216.
- Ferreira FT, Daltoe L, Succi G, et al. Relation between glycemic levels and low tract urinary symptoms in elderly. Aging Male. 2015;18:34–37.
- Grosman H, Fabre B, Lopez M, et al. Complex relationship between sex hormones, insulin resistance and leptin in men with and without prostatic disease. Aging Male. 2016;19:40–45.
- Jarvis TR, Chughtai B, Kaplan SA. Testosterone and benign prostatic hyperplasia. Asian J Androl. 2015;17:212–216.
- Kaplan SA, O’Neill E, Lowe R, et al. Prevalence of low testosterone in aging men with benign prostatic hyperplasia: data from the Proscar Long-term Efficacy and Safety Study (PLESS). Aging Male. 2013;16:48–51.
- Kaplan SA, Lee JY, O’Neill EA, et al. Prevalence of low testosterone and its relationship to body mass index in older men with lower urinary tract symptoms associated with benign prostatic hyperplasia. Aging Male. 2013;16:169–172.
- Parsons JK, Sarma AV, McVary K, et al. Obesity and benign prostatic hyperplasia: clinical connections, emerging etiological paradigms and future directions. J Urol. 2013;189:S102–S106.
- Parsons JK, Sarma AV, McVary K, et al. Obesity and benign prostatic hyperplasia: clinical connections, emerging etiological paradigms and future directions. J Urol. 2009;182:S27–S31.
- Xie LP, Bai Y, Zhang XZ, et al. Obesity and benign prostatic enlargement: a large observational study in China. Urology. 2007;69:680–684.
- Lotti F, Corona G, Colpi GM, et al. Elevated body mass index correlates with higher seminal plasma interleukin 8 levels and ultrasonographic abnormalities of the prostate in men attending an andrology clinic for infertility. J Endocrinol Invest. 2011;34:e336–e342.
- Zhao MJ, Huang Q, Wang XH, et al. Comparing clinical parameters of abnormal and normal fasting blood glucose in benign prostatic hyperplasia patients. Aging Male. 2019;10:1–8. DOI: 10.1080/13685538.2019.1570493 [Epub ahead of print]
- Willder JM, Walker VC, Halbert GL, et al. Body mass index predicts failure of surgical management in benign prostatic hyperplasia. Urol Int. 2013;90:150–155.
- Raheem OA, Parsons JK. Associations of obesity, physical activity and diet with benign prostatic hyperplasia and lower urinary tract symptoms. Curr Opin Urol. 2014;24:10–14.
- Muller RL, Gerber L, Moreira DM, et al. Obesity is associated with increased prostate growth and attenuated prostate volume reduction by dutasteride. Eur Urol. 2013;63:1115–1121.
- Mi YJ, Zhang B, Wang HJ, et al. Prevalence and secular trends in obesity among Chinese adults, 1991-2011. Am J Prev Med. 2015;49:661–669.
- Du P, Zhang B, Wang HJ, et al. The prevalence and secular trends of abdominal obesity among Chinese adults, 1993-2011. Ann Epidemiol. 2015;25:797–799.
- Chen C, Lu FC. Department of disease control ministry of health PRC. The guidelines for prevention and control of overweight and obesity in Chinese adults. Biomed Environ Sci. 2004;17: 1–36.
- Schatzl G, Brossner C, Schmid S, et al. Endocrine status in elderly men with lower urinary tract symptoms: correlation of age, hormonal status, and lower urinary tract function. The Prostate Study Group of the Austrian Society of Urology. Urology. 2000;55:397–402.
- Liu CC, Wu WJ, Lee YC, et al. The prevalence of and risk factors for androgen deficiency in aging Taiwanese men. J Sexual Med. 2009;6:936–946.
- Bhasin S, Cunningham GR, Hayes FJ, et al. Testosterone therapy in men with androgen deficiency syndromes: an endocrine society clinical practice guideline. J Clin Endocrinol Metab. 2010;95:2536–2559.
- Kernan WN, Viscoli CM, Brass LM, et al. Phenylpropanolamine and the risk of hemorrhagic stroke. N Engl J Med. 2000;343:1826–1832.
- Liu S, Wang X, Lu Y, et al. The effects of intraoperative cryoprecipitate transfusion on acute renal failure following orthotropic liver transplantation. Hepatol Int. 2013;7:901–909.
- Grossmann M. Hypogonadism and male obesity: focus on unresolved questions. Clin Endocrinol. 2018;89:11–21.
- Lamm S, Chidakel A, Bansal R. Obesity and hypogonadism. Urol Clin North Am. 2016;43:239–245.
- Sonksen PH, Holt RIG, Bohning W, et al. Why do endocrine profiles in elite athletes differ between sports? Clin Diabetes Endocrinol. 2018;4:3.
- Hagmar M, Berglund B, Brismar K, et al. Body composition and endocrine profile of male Olympic athletes striving for leanness. Clin J Sport Med. 2013;23:197–201.
- Shin YS, You JH, Cha JS, et al. The relationship between serum total testosterone and free testosterone levels with serum hemoglobin and hematocrit levels: a study in 1221 men. Aging Male. 2016;19:209–214.
- Roy CN, Snyder PJ, Stephens-Shields AJ, et al. Association of testosterone levels with anemia in older men. JAMA Intern Med. 2017;177:480–490.
- Korsten-Reck U, Seufert J, Dickhuth HH, et al. Hypogonadism and anemia in an athlete. Int J Sports Med. 2012;33:154–156.
- Di Vincenzo A, Silvestrin V, Bertoli E, et al. Short-term effects of surgical weight loss after sleeve gastrectomy on sex steroids plasma levels and PSA concentration in men with severe obesity. Aging Male. 2018;17:1–5. DOI: 10.1080/13685538.2018.1528445 [Epub ahead of print]
- Yassin A, Nettleship JE, Talib RA, et al. Effects of testosterone replacement therapy withdrawal and re-treatment in hypogonadal elderly men upon obesity, voiding function and prostate safety parameters. Aging Male. 2016;19:64–69.
- Yassin DJ, Doros G, Hammerer PG, et al. Long-term testosterone treatment in elderly men with hypogonadism and erectile dysfunction reduces obesity parameters and improves metabolic syndrome and health-related quality of life. J Sexual Med. 2014;11:1567–1576.
- Haider KS, Haider A, Doros G, et al. Long-term testosterone therapy improves urinary and sexual function, and quality of life in men with hypogonadism: results from a propensity matched subgroup of a controlled registry study. J Urol. 2018;199:257–265.