
Abstract
Aim: Apnea–hypopnea index (AHI) take account only the number of apnea and hypopnea regardless of their duration and morphology. The aim of this study was to compare the mean obstructive apnea duration (MOAD), mean mixed apnea duration (MMAD), mean central apnea duration (MCAD), mean total apnea duration (MTAD) and mean hypopnea duration (MHD) with the demographic parameters, blood oxygenation and other polysomnographic sleep parameters in patients diagnosed with severe obstructive sleep apnea (OSA).
Materials and methods: A retrospective study included 121 patients who had a diagnosis of severe OSA. The correlations between the MOAD, MMAD, MCAD, MTAD, MHD and patient demographic parameters, blood oxygenation and other polysomnographic sleep parameters were analyzed.
Results: Severe OSA patients with longer MOAD and MTAD had shorter Stage N3. Longer MOAD, MMAD, MCAD, MTAD, MHD were related to lower mean oxygen saturation. Longer MOAD and MTAD were associated with higher oxygen desaturation index. MOAD, MMAD, MTAD were positively associated with a duration below oxygen saturation 85%.
Conclusions: Respiratory events can have different characteristics even though the average number of events per hour would be similar. Novel parameters like MOAD, MMAD, MCAD, MTAD, MHD could enhance the evaluation and classification of OSA in addition to AHI.
Introduction
Polysomnography (PSG) is the gold standard for the diagnosis of obstructive sleep apnea (OSA), and the apnea–hypopnea index (AHI) has been used as the main parameter to classify the severity of the disease. The AHI is the number of apneas and hypopneas recorded during the PSG per hour of sleep. Based on the AHI, the severity of OSA is classified as: normal, AHI < 5; mild, 5 ≤ AHI < 15; moderate, 15 ≤ AHI < 30; and severe, AHI ≥ 30 events per hour. The duration of respiratory events in patients with OSA can vary widely, from ten seconds to more than two minutes. These partial and total cessations of breathing can lead to a drop in the oxygen saturation. Oxygen desaturation index (ODI), representing the average number of desaturation events per hour of sleep, is another parameter currently considered in the diagnostics of sleep-disordered breathing [Citation1,Citation2]. At present, AHI remains the major and primary diagnostic and classification parameter for OSA, however, does not contain information on the duration and morphology of the breathing cessations and desaturations. Obviously, within the same severity of OSA, longer apnea–hypopnea duration and deeper desaturation may have different consequences than shorter and shallower ones. This raises the question of whether AHI is the best parameter to evaluate the overall severity of OSA. Therefore, additional new advanced parameters are necessary that more accurately reflect demographic parameters, blood oxygenation, and polysomnographic sleep parameters in patients with OSA.
The mean apnea–hypopnea duration (MAD) is a parameter that incorporates the severity of breathing events during sleep by measuring the apnea–hypopnea duration [Citation3]. Use of the MAD has been previously studied, with the relationship of the severity of hypertension, AHI, demographic and sleep parameters [Citation3,Citation4]. However, the relationship of demographic and polysomnographic sleep parameters with mean obstructive apnea duration (MOAD), mean mixed apnea duration (MMAD), mean central apnea duration (MCAD), mean total apnea duration (MTAD) and mean hypopnea duration (MHD) separately remains unclear.
Therefore, this study aimed to compare the MOAD, MMAD, MCAD, MTAD and MHD with the demographic parameters, blood oxygenation, polysomnographic sleep parameters in patients diagnosed with severe OSA.
Materials and methods
Patients and study design
A retrospective clinical study included 121 severe OSA patients who were >18 years of age and who were followed up between 2016 and 2018 in the Sleep Center, SBU Bursa Yuksek Ihtisas Education and Research Hospital. The diagnosis of OSA by PSG was supported with the use of the AHI of >5 events per hour, as recommended by the diagnostic criteria of the American Academy of Sleep Medicine (AASM). Demographic parameters were extracted from the patient medical records. The Ethics Committee of the Bursa Yuksek Ihtisas Education and Research Hospital approved the study protocol, and informed consent was obtained from all subjects who participated in the study.
Polysomnography
Polysomnography in the sleep laboratory included continuous electroencephalographic (EEG) polygraphic recording using EEG leads, the use of right and left electro-oculographic leads, and chin electromyography for sleep staging. Electrocardiography (ECG) monitoring during sleep, airflow measurement at the nose and mouth, and chest and abdominal respiratory movements were measured during sleep. Arterial oxygen saturation was measured with pulse oximetry. All sleep studies were interpreted according to the manual of the AASM for the scoring of sleep, by certified sleep physicians. Apnea was identified when the airflow amplitude in the nasal cannula was <10% of baseline and when no flow occurred on the oral airflow sensor (thermistor). Hypopneas were identified when the amplitude of the airflow was reduced by 30%, the event was followed by 4% desaturation. The AHI was defined as the total number of apnea and hypopnea events per hour of sleep.
Statistical analysis
Data were expressed as the mean ± standard deviation (SD) or the median (interquartile range). The correlations between the MOAD, MMAD, MCAD, MTAD, MHD and patient demographic parameters, blood oxygenation and other polysomnographic sleep parameters were analyzed in patients with severe OSA. Correlations were tested using Pearson’s correlation test. Data were analyzed using IBM SPSS statistics 22.0 (SPSS Inc., Chicago, IL, USA). The value of p < 0.05 was considered as statistically significant.
Results
Baseline demographics
Our retrospective study included 121 patients with severe OSA. Mean age of the patients was 51.02 ± 11.40. Demographic characteristics of the study population are summarized ().
Table 1. Demographic characteristics of the study population.
Characteristics of the MOAD, MMAD, MCAD, MTAD and MHD
The MOAD, MSAD, MMAD, MTAD and MHD results showed a non-normal distribution. The median for MOAD was 20 (min–max: 11–46), MMAD was 23 (min–max: 14–59) MCAD was 13 (min–max: 10–39) MTAD was 20 (min–max: 11–45) MHD was 21 (min–max: 10–58) for all patients in the study. There was no relationship between MOAD, MMAD, MCAD, MTAD, MHD and AHI, REM-AHI/NREM-AHI.
Relationship of MOAD, MMAD, MCAD, MTAD, MHD and demographic characteristics of patients
There was negative weak correlation between MOAD, MMAD, MCAD, MTAD and age (respectively r = −0.200, p = 0.027; r = −0.189, p = 0.038; r = −0.181, p = 0.047; r = −0.190, p = 0.037). MHD was not correlated to the age. MOAD, MMAD, MCAD, MTAD, MHD were positively moderate correlate with height (respectively r = 0.364, p < 0.001; r = 0.377, p < 0.001; r = 0.370, p < 0.001; r = 0.363, p < 0.001, r = 0.332, p < 0.001). MOAD, MMAD, MCAD, MTAD, MHD were not correlate with weight. There was negative weak correlation between MOAD, MCAD and body mass index (BMI) (respectively r = −0.194, p = 0.033; r = −0.266, p = 0.003); negative moderate correlation between MHD and BMI (r = −0.335, p <0.001). MMAD and MTAD did not correlate with BMI.
Relationship of MOAD, MMAD, MCAD, MTAD, MHD and polysomnographic sleep parameters
Relationship of MOAD, MMAD, MCAD, MTAD, MHD and polysomnographic sleep parameters is summarized ().
Table 2. Relationship of MOAD, MMAD, MCAD, MTAD, MHD and polysomnographic sleep parameters.
Relationship of MOAD, MMAD, MCAD, MTAD, MHD and blood oxygen parameters
Relationship of MOAD, MMAD, MCAD, MTAD, MHD and blood oxygen parameters during PSG is summarized ().
Table 3. Relationship of MOAD, MMAD, MCAD, MTAD, MHD and blood oxygen parameters.
Discussion
Apnea–hypopnea index, currently used for diagnosis and classification of OSA, is a quantitative parameter and does not contain information about the morphology and duration of the respiratory events and related oxygen desaturations. This is the first study that has investigated the relationship between demographic parameters, blood oxygenation, polysomnographic sleep parameters and MAD separately as MOAD, MMAD, MCAD, MTAD and MHD in severe OSA patients.
Weak correlation between the improvement of AHI and sleepiness score after surgical treatments support that AHI does not include all aspects of OSA. Meen et al. [Citation5] reported improvement in subjective symptoms of OSA such as sleepiness and overall quality of life after nasal surgery despite no improvement in AHI. Another study which compared septoplasty and sham surgery found no significant decrease in AHI for both group, however, septoplasty group reported reduced sleepiness [Citation6]. Additionally, it has been shown that patients with excessive daytime sleepiness have longer MAD and lower nocturnal oxygen saturation [Citation3]. Nakata et al. [Citation7] reported that MAD is significantly reduced after nasal surgery and nocturnal oxygenation, sleep quality, daytime sleepiness are improved. Thus, the physiological stress in patients with similar AHI could change, which is also supported by the weak correlation reported between AHI and the sleepiness score.
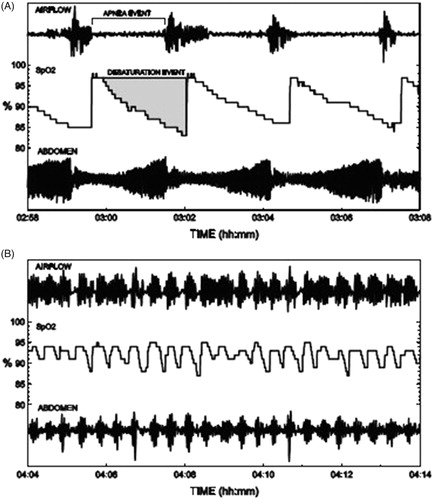
Zhan et al. [Citation3] showed that MAD is significantly, but mildly, correlated to the AHI. However, according to our study MOAD, MMAD, MCAD, MTAD, MHD did not correlate with AHI, REM-AHI, NREM-AHI. So, mean duration of all type of respiratory events is independent of OSA severity. An example of two patients with different characteristics of airflow and oxygen saturation is shown () [Citation2]. In this example, patient A with longer breathing cessations leading into deeper oxygen desaturation drops has lower AHI and the patient B with shorter breathing cessations accompanied by shallower oxygen desaturation drops has higher AHI. Despite lower AHI, patient A may experience greater physiological stress and higher risk of, e.g. sudden death due to lengthy apnea events. When the depth and duration of the apnea attacks increase, AHI may paradoxically fall [Citation2]. Similarly, according to our study patients with longer MOAD, MMAD, MTAD and MHD had less number of awakenings during all sleep. Time spent more during apnea/hypopnea with same total sleep time, could lead to fewer awakenings paradoxically. WASO (wakefulness after sleep onset) refers to periods of wakefulness occurring after defined sleep. This parameter measures wakefulness, excluding the wakefulness occurring before sleep onset. WASO time is a better reflection of sleep fragmentation [Citation8]. Also, patients with longer MOAD, MMAD, MTAD and MHD had less WASO time. Patients with longer MOAD, MMAD, MCAD, MTAD and MHD had higher sleep efficiency. MOAD, MCAD, MTAD was positively related to total sleep time. Explanation of higher sleep efficiency and total sleep time could be related to fewer awakenings. However, MOAD, MMAD, MCAD, MTAD and MHD did not affect the sleep latency and REM sleep latency.
Figure 1. Two patients with apneas and associated oxygen desaturation events with different characteristics. Patient A has longer apneas and deeper oxygen saturation drops, but as they occur more seldom. Patient B has shorter apneas and shallower oxygen saturation drops occurring more frequently and therefore also higher AHI.
In this study, patients with longer MOAD and MTAD had shorter Stage N3. Longer MOAD, MMAD, MCAD, MTAD associated with longer REM sleep and shorter Stage N1. Longer MOAD, MMAD, MTAD, MHD related to longer Stage N2, this relationship is stronger with MOAD and MTAD. Zhan et al. showed that MAD has a positive relationship with stage N1, negative relationship with stage N3 and no relationship with Stage N2 and REM sleep [Citation3]. When the MAD increased, apnea appeared to be more likely to cause respiratory arousal, which might interrupt sleep stability, resulting in sleep fragmentation. The explanation for shorter Stage 1 sleep with longer MOAD, MMAD and MTAD might have been due to less number of awakenings and WASO in our study. MAD significantly affects sleep structure, especially Stage N3 sleep [Citation3]. In addition to this finding similar to our study, longer MOAD and MTAD were associated with shorter Stage N3 rather than MMAD, MCAD and MHD. So short Stage N3 and longer breathing cessations relationship were due to mean obstructive apnea rather than other respiratory event durations. Also longer Stage N2 sleep might due to the transition of Stage N1 and Stage N3 sleep to Stage N2 Sleep.
Oxygen desaturation index is the average number of desaturation episodes per hour. ODI has a prognostic value because the complications and mortality of OSA are related to nocturnal hypoxia [Citation1]. Zhan et al. [Citation3] found that longer MAD was associated with lower oxygen saturation in patients with severe OSA. In addition to this finding, similar to our results, we had investigated the respiratory event as MOAD, MMAD, MCAD, MTAD and MHD separately. The findings of the present study indicated that longer MOAD, MMAD, MCAD, MTAD, MHD were related to deeper mean oxygen desaturation in patients with severe OSA. This relationship was stronger especially with MOAD and MTAD. Also longer MOAD and MTAD were associated with higher ODI (≥2, ≥3, ≥4 and ≥5). This relationship was stronger especially with ODI (≥4 and ≥5). Longer MHD was related to higher ODI (≥5). Additionally MOAD, MMAD, MCAD, MTAD were positively associated with the duration below oxygen saturation 90%. MOAD, MMAD, MTAD were positively associated with the duration below oxygen saturation 85%. This relationship was stronger with MOAD and MTAD. OSA has been shown to increase the risk for systemic hypertension, pulmonary vascular disease, ischemic heart disease, cerebral vascular disease, congestive heart failure and arrhythmias. Additionally, it was reported that sexual problems are common among men with OSA [Citation9,Citation10]. Reason for different complications of severe OSA with similar AHI could be the variable duration of obstructive apneas.
It is found that the most important indicator of daytime sleepiness in OSA patients is nocturnal hypoxemia [Citation3,Citation11,Citation12]. Although Zhan et al. [Citation3] showed that the length of the MAD is associated with an increased Epworth sleepiness scale (ESS) score in patients with severe OSA, which respiratory event contribute to daytime sleepiness to what extent is uncertain. In our study, the strongest relationship between respiratory event length and low oxygen saturation was the duration of obstructive apnea rather than others. In this case, it could be said severe OSA patients with longer obstructive apnea have more daytime sleepiness.
The findings of this study support that the AHI reflected the frequency of respiratory events, while the MOAD, MMAD, MCAD, MTAD and MHD represented the severity of respiratory events in varying degrees, and that these parameters are relatively independent, however, may be complementary in the evaluation of patients with severe OSA.
Disclosure statement
No potential conflict of interest was reported by the authors. Views expressed in the submitted article are authors own and not an official position of the institution or funder.
References
- Chung F, Liao P, Elsaid H, et al. Oxygen desaturation index from nocturnal oximetry: a sensitive and specific tool to detect sleep-disordered breathing in surgical patients. Anesth Analg. 2012;114:993–1000.
- Kulkas A, Tiihonen P, Julkunen P, et al. Novel parameters indicate significant differences in severity of obstructive sleep apnea with patients having similar apnea-hypopnea index. Med Biol Eng Comput. 2013;51:697–708.
- Zhan X, Fang F, Wu C, et al. Retrospective study to compare the use of the mean apnea-hypopnea duration and the apnea-hypopnea index with blood oxygenation and sleep patterns in patients with obstructive sleep apnea diagnosed by polysomnography. Med Sci Monit. 2018;24:1887–1893.
- Wu H, Zhan X, Zhao M, et al. Mean apnea-hypopnea duration (but not apnea-hypopnea index) is associated with worse hypertension in patients with obstructive sleep apnea. Medicine (Baltimore). 2016;95:e5493.
- Meen EK, Chandra RK. The role of the nose in sleep-disordered breathing. Am J Rhinol Allergy. 2013;27:213–220.
- Koutsourelakis I, Georgoulopoulos G, Perraki E, et al. Randomised trial of nasal surgery for fixed nasal obstruction in obstructive sleep apnoea. Eur Respir J. 2008;31:110–117.
- Nakata S, Noda A, Yasuma F, et al. Effects of nasal surgery on sleep quality in obstructive sleep apnea syndrome with nasal obstruction. Am J Rhinol. 2008;22:59–63.
- Shrivastava D, Jung S, Saadat M, et al. How to interpret the results of a sleep study. J Community Hosp Intern Med Perspect. 2014;4:24983
- Taken K, Ekin S, Arısoy A, et al. Erectile dysfunction is a marker for obstructive sleep apnea. Aging Male. 2016;19:102–105.
- Li X, Dong Z, Wan Y, et al. Sildenafil versus continuous positive airway pressure for erectile dysfunction in men with obstructive sleep apnea: a meta-analysis. Aging Male. 2010;13:82–86.
- Slater G, Steier J. Excessive daytime sleepiness in sleep disorders. J Thorac Dis. 2012;4:608–616.
- Mediano O, Barceló A, de la Peña M, et al. Daytime sleepiness and polysomnographic variables in sleep apnoea patients. Rev Port Pneumol. 2007;13:896–898.