
Abstract
Background: There are few studies showing that the increase in particulate matters less than 10 μm (PM10) values increases the apnea–hypopnea index (AHI). We aimed to investigate relationship between air quality parameters and the seasons with the AHI.
Methods: This was a retrospective study that included 500 adults. Polysomnography (PSG) was performed on all patients. Oxygen saturation, air temperature, relative humidity, and PM10 values were recorded in Düzce for every year. The parameters of the national air quality network and sleep parameters of 500 individuals hospitalized between 2015 and 2017 were checked.
Results: A total of 500 patients were included in the study, of whom 316 (63.2%) were male and 184 (36.8%) were female. While the AHI value of patients who presented during 2016 was 27.5, it had significantly declined to 20.2 in 2017 (p = .024). A significant decline was observed in AHI values of OSA patients from 2016 to 2017 (p = .043). A significant positive correlation was observed between REM-related AHI and relative humidity (r = 0.183, p = .002).
Conclusions: This study showed a clear relationship between AHI and PM10 during winter when air pollution parameters are high in the region. PM10 emerged as a parameter that substantially increases the relative risk for OSA.
Introduction
Air pollution is a mixture of gases and solid particulate pollutants in the ambient air [Citation1]. The effects of air pollution on health are multifaceted. In the human body, nose and lungs as the gateway are exposed to the polluted air first. Larger molecules often accumulate in the nose and large air passages, while smaller molecules reach the alveoli and systemic circulation. Molecules that accumulate in large air passages impair mucus formation, structure, and siliceous epithelial function [Citation2,Citation3].
The most common type of sleep disordered breathing (SDB) is obstructive sleep apnea (OSA). OSA contributes to the development of a series of systemic and vascular diseases. Its socioeconomic outcomes are also important with respect to the public health. One of the pathological mechanisms leading to OSA development is increased inflammation in the upper respiratory tract [Citation4]. OSA is characterized by upper airway narrowing or collapse [Citation5]. Upper respiratory tract collapse episodes during sleep are typically seen in OSA and these episodes lead to repeated oxyhemoglobin desaturations [Citation6].
SDB and air pollution have both been previously associated with increased autonomic dysfunction, pulmonary and systemic inflammation, increased blood pressure, paroxysmal atrial fibrillation, ventricular arrhythmia, myocardial infarction, and cardiovascular mortality, but the effect of pollution on SDB is not thoroughly understood [Citation7].
Although several studies investigated the relationship between air pollution and SDB, and it has been concluded that air pollution might have an effect on the severity and incidence of SDB; recently, the results are not comprehensive enough [Citation1,Citation7,Citation8]. There are also very few studies investigating the effects of seasonal changes on sleep disorders [Citation9].
Our hypothesis is that the increase in outdoor air pollution induces inflammation causing resistance in the upper respiratory tract and risk of OSA as the most common type of SDB. In order to test this hypothesis, we planned this retrospective study to investigate the relationship between SDB and ambient, particularly the particulate, air pollution.
Material and methods
Study group
This was a retrospective study that included 500 adults. Individuals who were admitted to the Chest Disease Polyclinic for Sleep Disorders of Düzce University, School of Medicine between January 2015 and December 2017 were included in the study. Polysomnography (PSG) was performed on all patients. Informed consent was obtained from all study participants.
Exclusion criteria
Individuals under 18 years of age, and pregnant women were excluded.
Polysomnography
PSG was performed on all patients for a minimum of 6 h. A PSG digital system was used (Alice 5 Sleep System, Philips, Respironics, Murrysville, PA). At the same time, electroencephalography, electro-oculography, chin electromyography, oral and nasal airflow (nasal-oral “thermistor” and nasal cannula), thorax movements, abdominal movements, arterial oxygen saturation (pulse oximetry instrument), electrocardiography and snoring recordings (>6 h) were obtained from all patients. The same device was used for all of these parameters. All records were scored manually in computer environment. Definitions of various terms are shown in the Box [Citation10–12].
Box. Definitions of various terms used in this study.
Apnea: complete lack of airflow through the mouth and nose for ≥10 s.
Hypopnea: 30% reduction of airflow for ≥10 s, along with 3% decrease in oxygen saturation or leading to arousal.
Apnea–hypopnea index (AHI): the ratio of the total duration of apnea and hypopnea observed during sleep to total length of sleep.
Severity of obstructive sleep apnea (OSA) syndrome: when evaluated based on AHI:
Normal: AHI <5/h
Mild sleep apnea: AHI 5–15/h
Moderate sleep apnea: AHI 6–30/h
Severe sleep apnea: AHI >30/h
OSA: obstructive sleep apnea
REM: rapid eye movement time.
Min O2: minimum oxygen saturation
Mean min O2 sat: average of minimum oxygen saturations throughout sleep
ODI: oxygen desaturation index
PM10: particulate matter less than 10 μm
SO2: sulfur dioxide
BMI: body mass index
Data collection
Oxygen saturation (%SO2), air temperature, relative humidity and particulate matters less than 10 μm (PM10) values were recorded from the data on the national air quality monitoring network obtained from the measuring station in Düzce for every year.
Statistical analysis
Data were analyzed using Statistical Package for Social Sciences Version 21.0 (IBM Corp. Released 2012, Armonk, NY). Comparisons were made using Student’s t-test and analysis of variance (ANOVA). Spearman’s analysis was used to investigate correlations between AHI, REM-related AHI, PM10, SO2, relative humidity, and air temperature and pressure. Linear regression analysis was used to determine the relationship between the dependent variables of AHI and REM-related AHI and the independent variables of PM10, SO2, relative humidity, air temperature, and pressure. Binary logistic model was used to obtain the odds ratios for OSA where PM10, SO2, relative humidity, body mass index, and age were independent variables. A p value <.05 was considered statistically significant.
Results
A total of 500 patients were included in the study, of whom 316 (63.2%) were male and 184 (36.8%) were female. The mean (±standard deviation) age of all participants was 47.3 ± 12.6 years. While 77% of the patients were diagnosed with OSA, 23% was reported to have normal sleep (). Based on AHI values, OSA severity was reported as mild among 143 (28.6%), moderate among 93 (18.6%), and severe among 149 (29.8%) patients. PSG was administered during winter months to 323 (64.6%) patients and during summer months to 177 (35.4%) patients ().
Table 1. Demographic characteristics.
The annual PM10 values in the city of Düzce in 2015, 2016, and 2017 were 106.1, 111.1, and 87.6 µm/m3, respectively; and the decline from 2016 to 2017 was significant. While the AHI value of patients who presented during 2016 was 27.5, it had significantly declined to 20.2 in 2017 (p = .024). A significant decline was observed in AHI values of OSA patients from 2016 to 2017 (p = .043) ().
Table 2. AHI and PM10 values over the years.
Mean AHI and REM-related AHI values were significantly declined in 2017, compared to the previous years. Cases diagnosed with OSA had lower mean AHI values in 2017 than they did in 2016. Mean PM10 and relative humidity values and SO2 were also significantly lower in 2017 compared to 2016 ().
A significant positive correlation was observed between REM-related AHI and relative humidity (r = 0.183, p = .002). Linear regression analysis yielded that only relative humidity had an independent effect on REM-related AHI (beta: 0.183, t = 3.140, p = .002).
Table 3. Presents yearly air quality parameters (PM10, SO2, relative humidity, temperature and pressure) of Düzce between 2015 and 2017, and sleep parameters in same time.
Two two-month periods, known to have the highest (December–January) and lowest (June–July) PM10 levels were investigated. Though not statistically significant, AHI values in all participants and patients with OSA diagnoses were higher during winter months known to have high PM10 levels. Total sleep duration was higher during winter compared to the summer months, the difference was significant in 2017 (p = .028) ().
Table 4. Comparison of PM10, AHI, REM-related AHI, min O2, ODI and total sleep duration in June–July and December–January across 2015–2017.
PM10, air temperature, age, and BMI increased odds ratio by onefold for OSA development, as presented in .
Table 5. Effects of PM10, air temperature, age, and BMI on OSA-development.
Discussion
Previous studies have shown that air pollution is associated with morbidity and mortality. World Health Organization reported that, in 2012, three million deaths were associated with ambient air pollution and 14% of these deaths were caused by respiratory diseases [Citation13,Citation14]. More than one billion people were affected by air pollution in 2015 and this number is estimated to reach four billion by 2050 [Citation15]. OSA effects the quality of life is a serious health problem and rising worldwide [Citation16]. Sleep disorders are one of the most important clinical conditions that can worsen quality of life [Citation17].
One of the air pollutants is PM10, the particles found suspended in the atmosphere. PM10 penetrates into the lungs and can cause inflammation and other respiratory diseases such as asthma, chronic bronchitis, and respiratory tract obstruction. The PMs larger than 10 µm that enter the respiratory tract are caught in the nose and the nasopharynx while the particles smaller than 10 μm accumulate in the bronchi, those with diameters of 1–2 μm gather in the alveoli, and the ones that are 0.5 μm in size diffuse into the intracapillary space from the alveoli [Citation18,Citation19].
Increase in outdoor air pollution can cause upper or lower respiratory tract inflammation, autonomic dysfunction, and/or increased oxidative stress and consequently resulting in SDB [Citation7]. In our study, we hypothesized that the increase in PM10 levels may increase inflammation in the upper respiratory tract and cause apnea. In a study by Ramanathan et al., mice inhaled PM2.5 for 6 weeks and a marked increase was observed in epithelial barrier dysfunction, along with a decrease in the expression of adhesion molecules including claudin-1 and epithelial cadherin. A significant increase was observed in eosinophilic inflammation including increased IL-13, eotaxin-1 and eosinophil accumulation. Studies have shown that air pollutants can trigger nonspecific inflammation in respiratory tract and increase respiratory tract resistance [Citation3,Citation8,Citation20]. It is also known that chronic inflammation and allergic reactions occur in the upper respiratory tract as a result of interactions between genes and various internal/external pollutant components of air [Citation21]. This study showed that the increase in PM10 caused an increase in AHI values. Decrease in PM10 values from 111.1 to 87.6 between 2016 and 2017 led to a decrease in AHI from 27.5 to 20.2 (p = .024). Additionally, when the mean AHI values of OSA-positive patients were examined, the lower PM10 values were observed in 2017 (28.4) than in 2016 (34.1) (p = .043).
In a study by Zanobetti et al. of 6441 participants at seven centers in the USA, the relationship between PM10 concentrations and sleep outcome was examined, and it has been shown that the increase in PM10 causes an increase in the respiratory disturbance index (RDI) and the time of oxygen saturation under 90% during sleep was interpreted as an association with the decrease in sleep efficiency. Their study also reported PM10 values to be higher during summer months [Citation7]. In our study, we observed AHI values to be higher during winter time. Use of stoves for heating in our region can explain the reason for higher PM10 values during winter. However, we could not detect any relationship between air pollution parameters and oxygen parameters (min O2, ODI, mean min O2).
Shen et al. conducted a survey of 4312 participants in the Taipei-Keelung metropolitan area (Taipei City, New Taipei City, and Keelung City) between 2006 and 2013 to investigate the relationship between air pollution and SDB, and reported an increase in PM2.5 caused by increase in AHI and ODI, but no relationship was found with PM10 [Citation1].
Cassol et al. studied 7523 patients between 2000 and 2009, and reported that AHI was positively correlated with atmospheric pressure, relative humidity, and carbon monoxide levels; and negatively correlated with air temperature. In our study, we found a positive correlation between REM-related AHI and relative humidity via linear regression analysis. In the same study, no significant correlation was found between AHI and PM10, ozone, or sulfur dioxide, and only humidity among the atmospheric variables had a significant correlation with AHI. During colder months, AHI was found to be significantly higher compared to warmer times [Citation9].
In a study investigated whether relative humidity increased OSA severity, 12 mild–moderate OSA patients were admitted to sleep laboratory for two days. The laboratory setting provided high humidity on the first day and low humidity on the second. Through continuous monitoring with a humidity measurement tool, the humidity was maintained over 80% in the first day (average high humidity: 85%, average low humidity: 14%). As a result, they found that the relative humidity had no effect on OSA severity. However, it is important to note that patients with severe OSA were excluded from this study [Citation22].
In a study conducted on 1773 people in Germany, the effects of short-term ozone exposure and air temperature on sleep were investigated. The findings showed that the air temperature (especially more significantly so in the summer) and short-term changes in the ozone levels were associated with sleep. They have found that increase in air temperature and ozone level caused increased AHI. No association was detected between AHI and PM10, but they have stated that PM10 levels were similar at all times [Citation23]. In this study, there was a significant difference between the PM10 levels during summer and winter.
Lappharat et al. investigated the relationship of OSA severity and sleep quality with PM10 levels, air temperature, and relative humidity. With this purpose, the measurements of PM10, air temperature, and relative humidity were made in the bedroom to evaluate their effects on sleep. As a result, it was found that an increase in 1-year average PM10 values had a significant effect on the increases in AHI levels. They have found that increased air temperatures during sleep were associated with decreased sleep quality. Our study results showed that increase in PM10 levels and air temperature increased relative risk of OSA positivity by onefold [Citation24].
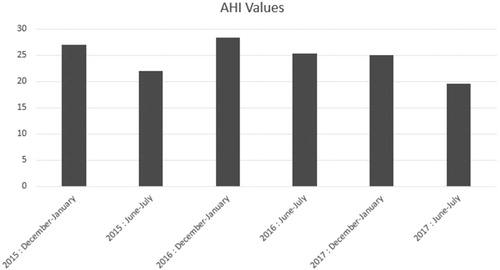
We compared the AHI values of the cases monitored by PSG during December–January and June–July periods, and the levels of PM10 values that are known to be the highest and the lowest of the year, respectively. Between 2015 and 2017, we discovered that the AHI values increased during the December–January period and decreased during the June–July period (). This indicates that the increase in PM10 levels may be related to OSA.
Figure 1. AHI values over the years during the months when the PM10 values are measured the highest and lowest of the year.
The major limitation of our study is that the exposure of our cases to air pollution is based on estimation. The home specific exposure assessments could not be performed due to lack of exact geographical addresses. The monitoring was limited by the number of observations made by the National Air Quality Monitoring Network stations. Moreover, important air pollutants PM2.5 and ozone measurements were not monitored in our region; therefore, the effects of these pollutants could not be investigated.
As a result, this study showed a clear relationship between AHI and PM10 during winter when air pollution parameters are high in the region. PM10 emerged as a parameter that substantially increases the relative risk for OSA almost as much as BMI does. There is a need for larger-scale studies to understand the pathogenesis of the relationship between air pollution and sleep.
Disclosure statement
No potential conflict of interest was reported by the authors.
References
- Shen YL, Liu WT, Lee KY, et al. Association of PM2.5 with sleep-disordered breathing from a population-based study in Northern Taiwan urban areas. Environ Pollut. 2018;233:109–113.
- Künzli N, Perez L, Rapp R. Air quality and health. Basel (Switzerland): European Respiratory Society; 2010. Available from: https://www.ersnet.org/pdf/publications/air-quality-ENG.pdf
- Ramanathan M Jr., London NR Jr., Tharakan A, et al. Airborne particulate matter induces nonallergic eosinophilic sinonasal inflammation in mice. Am J Respir Cell Mol Biol. 2017;57:59–65.
- Turkish Thoracic Society. Obstructive sleep apnea syndrome diagnosis and treatment consensus report. Turk Thorac J. 2012;13:33–35.
- Li X, Dong Z, Wan Y, et al. Sildenafil versus continuous positive airway pressure for erectile dysfunction in men with obstructive sleep apnea: a meta‐analysis. Aging Male. 2010;13:82–86.
- Dikis OS, Acat M, Casim H, et al. The relationship of thiol/disulfide homeostasis in the etiology of patients with obstructive sleep apnea: a case-control study. Aging Male. 2019;1–8. doi:10.1080/13685538.2019.1573890
- Zanobetti A, Redline S, Schwartz J, et al. Associations of PM10 with sleep and sleep-disordered breathing in adults from seven U.S. urban areas. Am J Respir Crit Care Med. 2010;182:819–825.
- Fang SC, Schwartz J, Yang M, et al. Traffic-related air pollution and sleep in the Boston Area Community Health Survey. J Expo Sci Environ Epidemiol. 2015;25:451–456.
- Cassol CM, Martinez D, da Silva F, et al. Is sleep apnea a winter disease? Meteorologic and sleep laboratory evidence collected over 1 decade. Chest. 2012;142:1499–1507.
- Si-Jie CAI, Rui C, Yan-Lin Z, et al. Correlation of Epworth Sleepiness Scale with multiple sleep latency test and its diagnostic accuracy in assessing excessive daytime sleepiness in patients with obstructive sleep apnea hypopnea syndrome. Chin Med J (Engl). 2013;126:3245–3250.
- Gulec Balbay E, Balbay O, Annakkaya AN, et al. Obstructive sleep apnoea syndrome in patients with primary open-angle glaucoma. Hong Kong Med J. 2014;20;379–385.
- Kapur VK, Auckley DH, Chowdhuri S, et al. Clinical practice guideline for diagnostic testing for adult obstructive sleep apnea: an American Academy of Sleep Medicine Clinical Practice Guideline. J Clin Sleep Med. 2017;13:479–504.
- Rabiei K, Hosseini SM, Sadeghi E, et al. Air pollution and cardiovascular and respiratory disease: rationale and methodology of CAPACITY study. ARYA Atheroscler. 2017;13:264–273.
- Liu WT, Lee KY, Lee HC, et al. The association of annual air pollution exposure with blood pressure among patients with sleep-disordered breathing. Sci Total Environ. 2016;543:61–66.
- Paramesh H. Air pollution and allergic airway diseases: social determinants and sustainability in the control and prevention. Indian J Pediatr. 2018;85:284–294.
- Taken K, Ekin S, Arisoy A, et al. Erectile dysfunction is a marker for obstructive sleep apnea. Aging Male. 2016;19:102–105.
- Shigehara K, Konaka H, Koh E, et al. Effects of testosterone replacement therapy on nocturia and quality of life in men with hypogonadism: a subanalysis of a previous prospective randomized controlled study in Japan. Aging Male. 2015;18:169–174.
- Bayram H, Dörtbudak Z, Fişekçi FE, et al. “Hava Kirliliğinin İnsan Sağlığına Etkileri, Dünyada, Ülkemizde ve Bölgemizde Hava Kirliliği Sorunu” Paneli Ardından. Dicle Tıp Dergisi. 2006;33:105–112.
- Lee JW, Seok JK, Boo YC. Ecklonia cava extract and dieckol attenuate cellular lipid peroxidation in keratinocytes exposed to PM10. Evid Based Complement Alternat Med. 2018;2018:8248323.
- Bonay M, Aubier M. Air pollution and allergic airway diseases. Med Sci (Paris). 2007;23:187–192.
- Tenero L, Piacentini G, Nosetti L, et al. Indoor/outdoor not-voluptuary-habit pollution and sleep-disordered breathing in children: a systematic review. Transl Pediatr. 2017;6:104–110.
- Jokic R, Bhagchandani L, Zintel T, et al. Effect of high versus low ambient humidity on the severity of obstructive sleep apnoea. Thorax. 1999;54:711–713.
- Weinreich G, Wessendorf TE, Pundt N, et al. Association of short-term ozone and temperature with sleep disordered breathing. Eur Respir J. 2015;46:1351–1254.
- Lappharat S, Taneepanichskul N, Reutrakul S, et al. Effects of bedroom environmental conditions on the severity of obstructive sleep apnea. J Clin Sleep Med. 2018;14:565–573.