
 ?Mathematical formulae have been encoded as MathML and are displayed in this HTML version using MathJax in order to improve their display. Uncheck the box to turn MathJax off. This feature requires Javascript. Click on a formula to zoom.
Abstract
Purpose
To analyze routine preoperative prostate MRI to predict erectile function (EF) before and after radical prostatectomy (RP).
Methods
Patients who underwent RP with an existing preoperative MRI including dynamic contrast-enhanced images and completed International Index of Erectile Function (IIEF-5) questionnaires at baseline and 12 months postoperative. They were divided into four erectile dysfunction (ED) groups according to preoperative IIEF-5 score. The perfusion quality was measured in the peripheral zone of the prostate by the ratio of signal increase 120 s after wash-in of contrast agent (Ratio120) in preoperative MRI and compared between the ED groups.
Results
Ratio120 showed differences among the preoperative ED groups (p = .020) in 97 patients. According to IIEF-5 at 12 months postoperative, 43 patients were dichotomized into “no to mild” (≥17 points) and “moderate to severe” (≤16) ED groups. Ratio120 revealed differences among the postoperative ED groups (128.84% vs. 101.95%; p = .029) and stayed an independent predictor for ED in the multivariable regression analysis (adjusted for age, nerve-sparing and preoperative IIEF-5). ROC curves demonstrated an additional diagnostic benefit.
Conclusions
Preoperative MRI of the prostate may be used for the prediction of EF and postsurgical recovery after RP. This may serve as important tool in preoperative patient counseling and management of expectations.
Introduction
Erectile dysfunction (ED) and urinary incontinence (UI) remain major adverse effects and severely influence the postoperative quality of life (QoL) in patients undergoing radical prostatectomy (RP) [Citation1]. Several studies described the negative impact of RP on erectile function (EF) in patients treated for localized prostate cancer (PCa) [Citation2–4]. Besides the oncological outcome, functional results such as ED and UI are rated as equally important for patients during follow-up [Citation5–7]. Further, these functional parameters significantly influence psychological health and are directly associated with overall QoL [Citation8–11]. The neurovascular bundle (NVB) runs very close to the prostate and carries blood supply as well as sympathetic and parasympathetic neural branches from the pelvic plexus to the corpora cavernosa and the external urinary sphincter muscle, mediating penile erection and urinary continence [Citation12–14]. To improve not only ED but also UI following RP, the extent of nerve sparing (NS) is of highest importance – if technically possible and oncologically feasible. Furthermore, the early postoperative recovery of functional outcomes is an important benchmark, since the chance of a full recovery diminishes with increasing time since surgery [Citation15]. According to the literature, NS in robot-assisted RP was still associated with a wide range of 10–46% of the patients suffering from ED one year after surgery [Citation16].
Up to date, there are limited publications on postoperative ED prediction through preoperative clinical parameters [Citation17]. Age, extension of NS, baseline erection scores and important co-morbidities were promoted as predictors of potency recovery following RP [Citation16,Citation18]. However, the information from dynamic contrast-enhancement (CE) of routine preoperative multiparametric magnetic resonance imaging (mpMRI) of the prostate has not yet been analyzed to evaluate the chances of ED. Hence, the aim of our study was to evaluate the preoperative dynamic CE in prostate MR images for the prediction of pre- and postoperative EF. We hypothesized, that CE in the peripheral zone of the prostate is a surrogate for the perfusion via the NVB with its branches to the prostate and that a better perfusion goes along with the quality of pre- and postoperative EF.
Materials and methods
Clinical cohort
This publication is based on a retrospective analysis of prospectively gathered data. All patients (n = 354) who underwent robot-assisted RP between 01/2015 and 12/2018 in our institution and agreed on participating in the study were reviewed. Inclusion criteria were a preoperative mpMRI of the prostate (in-house or external) at 3 T with dynamic CE images and a completed as well as evaluable International Index of Erectile Function questionnaire (IIEF-5) at baseline (preoperative). The IIEF-5 questionnaires were filled-in by the patients during regular visits in the outpatient clinic of our hospital and it consists of five questions to assess the presence and severity of ED [Citation19]. For each question, five possible answers render points from one (lowest) to five (highest). The total cumulated score is subdivided into subgroups referring to the severity of ED: “no” (25-22 points), “mild” (21-17), “mild to moderate” (16-12), “moderate” (11-8) and “severe” (7-5). For the evaluation of post-surgical recovery, only patients with a preoperative IIEF-5 score of ≥17 points (“no” or “mild” ED) and a completed IIEF-5 questionnaire at 12 months postoperatively were analyzed. The study was approved by the local Ethics Committee (ProCOC: The Prostate Cancer Outcomes Cohort Study, protocol number: Ref. Nr. StV KEK-ZH-Nr. 06/08) [Citation20].
Outcome assessment
The cohort was divided into four groups of “no” (IIEF-5 score = 25-22), “mild” (21-17), “moderate” (16-12) and “severe” (11-5) ED according to the scores of the preoperative IIEF-5 questionnaire. For post-surgical recovery, patients were dichotomized into two different ED groups of “no to mild” (25-17) vs. “moderate to severe” (16-5) ED according to the IIEF-5 questionnaires at 12 months postoperatively. Here, an intact EF at baseline with IIEF-5 score of ≥17 points (“no to mild” ED) was a prerequisite. This clinical cut-off value was chosen on behalf of the accepted international definition as “sufficient for intercourse”, supported by a recent Cochrane systematic review [Citation21]. Further, a change score (CS) analysis was performed to demonstrate the clinical outcome as change in IIEF-5 score from pre- to postoperative. Therefore, we defined a “small” CS as <4 points, “intermediate” CS as 4-15 points and “large” CS as >15 points difference between pre- and postoperative scores on IIEF-5 questionnaires.
MRI of the prostate
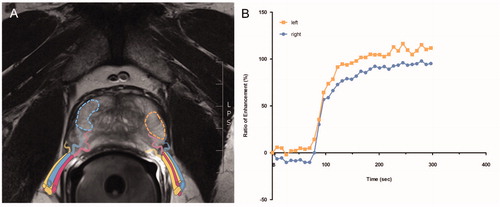
In-house MRI examinations were performed at 3 T MRI scanner (Magnetom Skyra, Siemens Healthcare, Erlangen, Germany) with a 18-channel phased-array receiver body coil featuring a dedicated mpMRI protocol including high-resolution T2-weighted sequences in three planes, a diffusion-weighted sequence and a dynamic CE 3 D fat-saturated gradient-echo sequence with a temporal resolution <8 s and concurrent application of gadoterate meglumine (Dotarem®, Guerbet, Roissy, France). MpMRIs conducted in-house and at external sites (all at 3 T) were acquired in accordance with the PIRADS guidelines [Citation22]. For every subject, the contrast enhancement (CE) over time was measured as a ratio to the baseline signal (percentage of the signal increase) after 120 s (Ratio120) in the peripheral zone on hyperintense areas in axial T2w-images in both peripheral lobes of the prostate separately. Signal-intensity time curves were chosen as semi-quantitative model for a reliable tissue characterization and to calculate the gradient of the upsweep until maximum signal intensity were achieved [Citation23]. With a commercially available software (MR Prostate workflow, Syngo.via, Siemens Healthcare, Erlangen, Germany), we measured the Ratio120 after wash-in of the contrast agent (adjusting for patient-specific lag time from contrast injection to first contrast agent occurrence) in regions-of-interest (ROI) that were manually drawn on both sides in the peripheral zone of the prostate (). To achieve this, T2w-hyperintense areas were specifically chosen to omit relevant PIRADS lesions (i.e. tumor), inflammatory changes (i.e. prostatitis) or adenoma tissue (i.e. benign prostatic hyperplasia). The ROIs were automatically superimposed on CE images and related signal intensity change curves were derived.
Figure 1. ROI’s placed on the right and left side of the peripheral zone of the prostate in hyperintense areas of axial T2w sequence. The NVB indicates the perfusion coming from posterolateral direction (A). Ratio of enhancement measured over time via signal intensity curves of contrast agent (B).
Statistical analysis
The statistical was analysis was performed using the software R for statistical computing [Citation24]. Shapiro-Wilk normality test was employed to confirm that the assessed data follows a Gaussian distribution. Therefore, one-way ANOVA (4 groups) and Welch two sample t-test (2 groups) was used to compare the Ratio120 among the corresponding ED groups. Pearson’s correlation was computed to describe the association between the Ratio120 and the pre-/postoperative IIEF-5 scores. The CS between the groups was analyzed using a one-way ANOVA (3 groups). Further, a multivariable regression analysis was fitted to predict EF according to the Ratio120 adjusted for age and co-morbidities in the preoperative setting as well as age, preoperative IIEF-5 score and the extent of NS in the postoperative setting. To display the discriminative ability of these models, receiver operating characteristic (ROC) curves including an area under the curve (AUC) with the optimal threshold, specificity and sensitivity were computed as diagnostic models. p-Values < .05 were considered as statistically significant (two-sided).
Results
Patient cohort and characteristics
All 354 patients were screened for a preoperative mpMRI with dynamic CE images as well as a completed preoperative IIEF-5 questionnaire. Finally, 97 patients met the inclusion criteria and were included in the analysis. The division according to the preoperative IIEF-5 score yielded four groups of “no” (n = 45), “mild” (n = 33), “moderate” (n = 14) and “severe” (n = 5) ED (see ). In accordance with the postoperative IIEF-5 score at 12 months, 43 patients were dichotomized in two groups of “no to mild” (n = 22) and “moderate to severe” (n = 21) ED (see ). All relevant patient characteristics are displayed in . Exploratory p-values show differences between the four preoperative ED groups in age, Gleason score and co-morbidities. The two postoperative ED groups differed in percentage of T3 disease and extension of NS. Other important baseline characteristics, such as body-mass index (BMI), prostate size, prostate-specific antigen (PSA), smoker status, preoperative IIEF-5 scores and usage of phosphodiesterase-5-inhibitors were similarly distributed.
Table 1a. Patient characteristics stratified by ED groups according to IIEF-5 score preoperative: “no” (IIEF-5 score = 25-22), “mild” (21-17), “moderate” (16-12) and “severe” (11-5).
Table 1b. Patient characteristics stratified by ED groups according to IIEF-5 score at 12 months postoperative: “no to mild” (IIEF-5 score = 25-17 points) vs. “moderate to severe” (16-5 points).
Ratio of signal increase
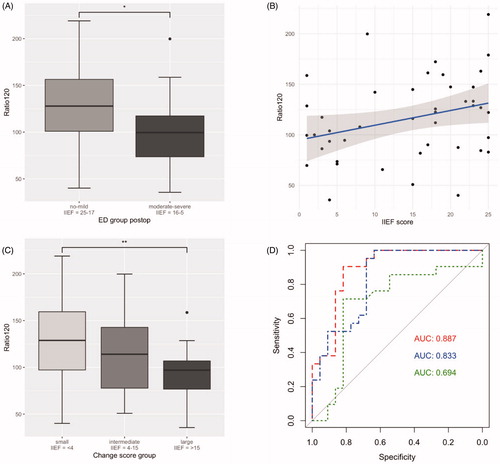
The Ratio120 was compared between the four preoperative groups (according to ): One-way ANOVA showed statistically significant differences among all of the ED groups (2(3,93) = 3.43; p = .020). Welch two sample t-test showed a statistically significant difference comparing the Ratio120 between “no to mild” and “moderate to severe” ED group in the preoperative status (113.7% vs. 83.7%, respectively; difference = −32.5%; 95% confidence interval (CI): −46.3 to −13.8; p < .001). See results as boxplots in , respectively. In the postoperative setting (according to ), the comparison of the Ratio120 showed a statistically significant difference between the “no to mild” and the “moderate to severe” ED group (128.84% vs. 101.95%, respectively; difference = −26.89%; 95% CI: −50.88 to −2.89; p = .029). See boxplot in .
Figure 2. Difference in Ratio120 between ED groups according to preoperative IIEF-5 score, displayed as boxplots: Divided into four ED groups “no” (IIEF-5 score = 25-22 points) vs. “mild” (21-17) vs. “moderate” (16-12) vs. “severe” (11-5) (A) and into two ED groups “no to mild” (25-17) vs. “moderate to severe” (16-5) (B). *p < .05, ***p < .001. Correlation plot displaying the association between preoperative IIEF-5 score and the Ratio120 (r = 0.25, p = .012) (C). Diagnostic model as ROC curves with Ratio120 including age and comorbidities (AUC 0.833, threshold 0.14, specificity 70.5%, sensitivity 89.5%, dashed line). Compared to ROC curve for diagnostic model with age and comorbidities (AUC 0.800, threshold 0.37, specificity 94.9%, sensitivity 57.9%, dot-dashed line) and ROC curve for age alone (AUC 0.718, threshold 0.37, specificity 94.9%, sensitivity 42.1%, dotted line). Cohort of .
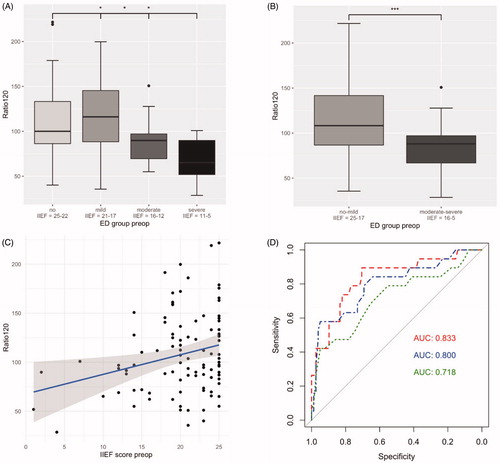
Figure 3. Difference in Ratio120 between the postoperative ED group “no to mild” (IIEF-5 score = 25-17) vs. “moderate to severe” (16-5) displayed as boxplot (128.84% vs. 101.95%, p = .029) (A). Correlation plot displaying the association between postoperative IIEF-5 score and the Ratio120 (r = 0.31, p = .044) (B). Cohort of . Boxplots of difference in Ratio120 between clinical outcome groups of “small” (IIEF-5 score <4 points), “intermediate” (4-15 points) and “large” (>16 points) CS (Citation2(2,40) = 3.21; p = .051). Illustrated difference in Ratio120 between best (“small”) and worst (“large”) CS group (129.6% vs. 95.7%, p < .0071). Usage of PDE-5-I was present in 10/21 patients in the “small”, 5/8 patients in the “intermediate” and 1/14 patient in the “large” CS group (47.6% vs. 62.5% vs. 7.1%, respectively) (C). ROC curve for demonstration of the discriminative ability of a diagnostic model with Ratio120 together with age, preoperative IIEF-5 score and NS (AUC 0.887, threshold: 0.45, specificity: 81.8%, sensitivity: 90.5%, dashed line). ROC curve for model with age, preoperative IIEF-5 score and NS (AUC 0.833, threshold: 0.34, specificity 63.6%, sensitivity 100.0%, dot-dashed line) and ROC curve for model with age and preoperative IIEF-5 score (AUC 0.694, threshold 0.52, specificity 81.8%, sensitivity 71.4%, dotted line) (D).
IIEF-Score
Pearson’s correlation demonstrated an association between the preoperative IIEF-5 score and the Ratio120 (r = 0.25; 95% CI: 0.058 to 0.43; p = .012). We also found a statistically significant correlation between postoperative IIEF-5 score and the Ratio120 (r = 0.31; 95% CI: 0.0086 to 0.56; p = .044). See corresponding correlation plots in and , respectively.
Diagnostic model to predict preoperative EF
To evaluate the discriminative ability of the Ratio120, we have designed a diagnostic model including age and comorbidities as important co-variables to predict preoperative IIEF-5 scores. The ROC curve demonstrates the added value of including the measurement of the Ratio120 together with age and comorbidities in a diagnostic model to predict the preoperative IIEF-5 score with an AUC of 0.833 (95% CI: 0.72 to 0.94, threshold 0.14 with specificity 70.5% and sensitivity 89.5%, dashed line). As comparison, the ROC curve for a model with age and comorbidities shows a smaller AUC of 0.800 (95% CI: 0.68 to 0.92, threshold 0.37 with specificity 94.9% and sensitivity 57.9%, dot-dashed line). The AUC for a ROC curve with age as diagnostic variable alone demonstrates an AUC of 0.718 (95% CI: 0.57 to 0.86, threshold 0.37 with specificity 94.9% and sensitivity 42.1%, dotted line). See ROC curves in .
Change score analysis
To analyze the change in IIEF-5 scores from pre- to postoperative, we examined the Ratio120 in the “small”, “intermediate” and “large” CS group together with a one-way ANOVA (Citation2(2,40) = 3.21; p = .051). When comparing the best and the worst clinical outcome, the group with a “small” CS presented a higher Ratio120 than the group with a “large” CS according to a Welch two sample t-test (129.6% vs. 95.7%, respectively; difference = −48.1%; 95% CI: −57.97 to −9.89; p < .0071). Postoperative usage of PDE-5-Is was present in 10/21 patients in the “small”, 5/8 patients in the “intermediate” and 1/14 patient in the “large” CS group (47.6% vs. 62.5% vs. 7.1%, respectively). See results displayed as boxplot in .
Uni- and multivariable regression analysis
In a univariable regression model, we analyzed the Ratio120 as independent factor for postoperative ED. The odds of belonging to the “no to mild” ED group at 12 months postoperative were higher in those patients with a better Ratio120 than those with a worse Ratio120 (OR = 1.019; 95% CI: 1.00 to 1.037; p = .039). Slightly elevated odds for belonging to the “no to mild” ED group were also found in patients with a higher Ratio120 in a multivariable regression model after adjusting for age, preoperative IIEF-5 score and bilateral NS (OR = 1.022; 95% CI: 1.00 to 1.04; p = .048). However, next to the Ratio120, bilateral NS was also an independent predictor with highly elevated odds for “no to mild” postoperative ED (OR = 12.21; 95% CI: 2.17 to 68.60; p = .0045). Age and preoperative IIEF-score were not of statistically significant influence in the multivariable regression analysis. See .
Table 2. Univariable regression analysis for the Ratio120 (A) and multivariable regression analysis adjusted for age, preoperative IIEF-5 score and bilateral NS (B) to predict the odds of belonging to the “no to mild” ED group.
Diagnostic model to predict postoperative EF
The fitted model of the multivariable regression analysis was used to design a ROC curve to demonstrate the discriminative ability of the performed measurements in the preoperative mpMRI as predictor of postoperative IIEF-5 score at 12 months. The ROC curve for the Ratio120 together with age, preoperative IIEF-5 score and bilateral NS reveals an AUC of 0.887 (95% CI: 0.79 to 0.99, threshold 0.45 with specificity 81.8% and sensitivity 90.5%, dashed line). The ROC curves for a model with age, preoperative IIEF-5 score and bilateral NS (AUC 0.833, threshold 0.34 with specificity 63.6% and sensitivity 100.0%, dot-dashed line) and age with preoperative IIEF-5 score (AUC 0.694, threshold 0.52 with specificity 81.8% and sensitivity 71.4%, dotted line), demonstrated smaller AUCs. The ROC curves are depicted in .
Discussion
Our results demonstrate that the measurement of CE over time in the peripheral zone of the prostate may be used as marker for EF. The measured Ratio120 was different in preoperative as well as postoperative ED groups according to completed IIEF-5 questionnaires ( and ). From a clinical point of view, a higher CE (as measured in Ratio120) can be interpreted as a better perfusion quality of the prostate, which indicates not only a superior preoperative EF but may also prevent the development of postoperative ED according to our change score analysis (). In a uni- and multivariable regression analysis adjusted for important co-variables such as the age, preoperative IIEF-5 score and bilateral NS, the Ratio120 stayed an independent predictor of postoperative EF in the present cohort (). Further, preliminary predictive models were designed: ROC curves demonstrate the discriminative ability of our measurements ( and ) and revealed that the Ratio120 may be used as valuable add-on to accepted clinical parameters (such as age, co-morbidities, NS and preoperative IIEF-5 score) to improve diagnostic accuracy in predicting pre- and postoperative EF through routine preoperative prostate MRI.
The ability to forecast postoperative functional outcomes through the analysis of routine imaging would be valuable for selecting individualized treatment options and improved preoperative patient consulting. “Trifecta” is defined as the absence of biochemical recurrence, urinary incontinence and erectile dysfunction after RP in patients treated for PCa [Citation5,Citation25]. As functional outcomes have an important influence on the postoperative QoL and the psychological well-being [Citation1,Citation2,Citation7,Citation9,Citation26], they need to be addressed as part of the preoperative counseling in order to choose the right treatment path together with our patients. A recently published study has demonstrated a similar approach to predict post-prostatectomy incontinence through evaluation of CE in preoperative mpMRI [Citation27]. However, patients’ expectations do not always match the actual outcomes regarding functional aspects 1 year after RP [Citation28]. It is known that patients and their partners do have concerns about the implications of ED and its’ effect on their relationship [Citation29]. Therefore, it is of utmost importance to address these topics as part of the preoperative patient counseling and to ameliorate the prognostic process. Bringing current evidence together with the present study, further efforts should be made to improve preoperative patient guidance regarding postoperative expectations on functional outcomes, which decisively influence QoL.
Substantial research looked into clinical, laboratory or imaging parameters to predict postoperative EF in patients that underwent RP for PCa. Age, extension of NS, baseline EF, presence of comorbidities, apical dissection time and time after treatment were all identified as independent parameters for functional outcome [Citation30–33]. Mulhall and colleagues developed nomograms for the preoperative and postoperative setting as aid for the clinician to estimate recovery of EF following RP [Citation34]. In addition, various imaging studies analyzed the configuration of neurovascular bundle before and after the operation to evaluate influencing factors of potency [Citation35,Citation36]. Periprostatic fascia thickness measured by preoperative 3 T MRI was further identified as correlating positively with postoperative EF [Citation37]. In a paper from Vargas et al., dynamic CE MRI from the corpora cavernosa of the penis was used to derive quantitative perfusion-related parameters in patients with newly diagnosed PCa and was correlated to self-reported sexual function [Citation38] - however, only the preoperative status of EF was assessed.
The limitations of the underlying study are the retrospective nature with a rather limited sample size and the associated reduced statistical power. Further, patient reported outcomes, such as pre- and postoperative IIEF-5 questionnaires, were not mandatory during follow up in our prospective cohort study, reducing the number of included patients. This may have led to selection bias. Further, there were slight variations in the acquisition protocol between in-house and external mpMRIs, although all imaging was performed at 3 T and according to PIRADS guidelines [Citation22].
Conclusions
Dynamic CE images in routine mpMRI of the prostate may be used to predict pre- and postoperative EF. Our approach may help to improve preoperative patient consulting towards managing realistic postoperative expectations. Further investigations and larger cohorts in prospective trials are needed to confirm our hypothesis and the postulated results.
Disclosure statement
The authors report no conflict of interest.
References
- Sanda MG, Dunn RL, Michalski J, et al. Quality of life and satisfaction with outcome among prostate-cancer survivors. N Engl J Med. 2008;358(12):1250–1261.
- Donovan JL, Hamdy FC, Lane JA, ProtecT Study Group*, et al. Patient-reported outcomes after monitoring, surgery, or radiotherapy for prostate cancer. N Engl J Med. 2016;375(15):1425–1437.
- Barocas DA, Alvarez J, Resnick MJ, et al. Association between radiation therapy, surgery, or observation for localized prostate cancer and patient-reported outcomes after 3 years. JAMA. 2017;317(11):1126–1140.
- Wilt TJ, Jones KM, Barry MJ, et al. Follow-up of prostatectomy versus observation for early prostate cancer. N Engl J Med. 2017;377(2):132–142.
- Salomon L, Saint F, Anastasiadis AG, et al. Combined reporting of cancer control and functional results of radical prostatectomy. Eur Urol. 2003;44(6):656–660.
- King MT, Viney R, Smith DP, et al. Survival gains needed to offset persistent adverse treatment effects in localised prostate cancer. Br J Cancer. 2012;106(4):638–645.
- Carrier J, Edwards D, Harden J. Men's perceptions of the impact of the physical consequences of a radical prostatectomy on their quality of life: a qualitative systematic review. JBI Database System Rev Implement Rep. 2018;16(4):892–972.
- Sciarra A, Gentilucci A, Salciccia S, et al. Psychological and functional effect of different primary treatments for prostate cancer: a comparative prospective analysis. Urol Oncol. 2018;36(7):e7-340.
- Meyer JP, Gillatt DA, Lockyer R, et al. The effect of erectile dysfunction on the quality of life of men after radical prostatectomy. BJU Int. 2003;92(9):929–931.
- Gannon K, Guerro-Blanco M, Patel A, et al. Re-constructing masculinity following radical prostatectomy for prostate cancer. Aging Male. 2010;13(4):258–264.
- Richards AB, Davis K, Gooden RO. Assessing the impact of sexual function on perceptions of masculinity among prostate cancer survivors in the United States: findings from the prostate cancer registry. Aging Male. [cited 2018 Nov 20];[5p.]. DOI:10.1080/13685538.2018.1535582
- Walsh PC, Donker PJ. Impotence Following Radical Prostatectomy: Insight into Etiology and Prevention. J Urol. 2017;197(2S):S165–S170.
- Walz J, Epstein JI, Ganzer R, et al. A critical analysis of the current knowledge of surgical anatomy of the prostate related to optimisation of cancer control and preservation of continence and erection in candidates for radical prostatectomy: an update. Eur Urol. 2016;70(2):301–311.
- Nguyen LN, Head L, Witiuk K, et al. The risks and benefits of cavernous neurovascular bundle sparing during radical prostatectomy: a systematic review and meta-analysis. J Urol. 2017;198(4):760–769.
- Abdollah F, Sun M, Suardi N, et al. Prediction of functional outcomes after nerve-sparing radical prostatectomy: results of conditional survival analyses. Eur Urol. 2012;62(1):42–52.
- Ficarra V, Novara G, Ahlering TE, et al. Systematic review and meta-analysis of studies reporting potency rates after robot-assisted radical prostatectomy. Eur Urol. 2012;62(3):418–430.
- Mulhall JP, Kattan MW, Bennett NE, et al. Development of nomograms to predict the recovery of erectile function following radical prostatectomy. J Sex Med. 2019;16(11):1796–1802.
- Taniguchi H, Kinoshita H, Koito Y, et al. Preoperative sexual status of Japanese localized prostate cancer patients: comparison of sexual activity and EPIC scores. Aging Male. 2017;20(4):261–265.
- Rosen RC, Cappelleri JC, Smith MD, et al. Development and evaluation of an abridged, 5-item version of the International Index of Erectile Function (IIEF-5) as a diagnostic tool for erectile dysfunction. Int J Impot Res. 1999;11(6):319–326.
- Umbehr M, Kessler TM, Sulser T, et al. ProCOC: the prostate cancer outcomes cohort study. BMC Urol. 2008;8:9.
- Philippou YA, Jung JH, Steggall MJ, et al. Penile rehabilitation for postprostatectomy erectile dysfunction. Cochrane Database Syst Rev. 2018;10:CD012414.
- Weinreb JC, Barentsz JO, Choyke PL, et al. PI-RADS prostate imaging – reporting and data system: 2015, version 2. Eur Urol. 2016;69(1):16–40.
- Alonzi R, Padhani AR, Allen C. Dynamic contrast enhanced MRI in prostate cancer. Eur J Radiol. 2007;63(3):335–350.
- R Core Team. R: A language and environment for statistical computing. R Foundation for Statistical Computing V, Austria. 2017. [cited 2020 Aug 26]. Available from: https://www.R-project.org/.
- Bianco FJ, Jr., Scardino PT, Eastham JA. Radical prostatectomy: long-term cancer control and recovery of sexual and urinary function ("trifecta"). Urology. 2005;66(5 Suppl):83–94.
- Lane A, Metcalfe C, Young GJ, the ProtecT Study group, et al. Patient-reported outcomes in the ProtecT randomized trial of clinically localized prostate cancer treatments: study design, and baseline urinary, bowel and sexual function and quality of life. BJU Int. 2016;118(6):869–879.
- Schmid FA, Wettstein MS, Kessler TM, et al. Contrast media kinetics in multiparametric magnetic resonance imaging before radical prostatectomy predicts the probability of postoperative incontinence. World J Urol. 2020;38(7):1741–1748.
- Wittmann D, He C, Coelho M, et al. Patient preoperative expectations of urinary, bowel, hormonal and sexual functioning do not match actual outcomes 1 year after radical prostatectomy. J Urol. 2011;186(2):494–499.
- Boehmer U, Babayan RK. Facing erectile dysfunction due to prostate cancer treatment: perspectives of men and their partners. Cancer Invest. 2004;22(6):840–848.
- Gandaglia G, Suardi N, Gallina A, et al. Preoperative erectile function represents a significant predictor of postoperative urinary continence recovery in patients treated with bilateral nerve sparing radical prostatectomy. J Urol. 2012;187(2):569–574.
- Rabbani F, Stapleton AM, Kattan MW, et al. Factors predicting recovery of erections after radical prostatectomy. J Urol. 2000;164(6):1929–1934.
- Kilminster S, Muller S, Menon M, et al. Predicting erectile function outcome in men after radical prostatectomy for prostate cancer. BJU Int. 2012;110(3):422–426.
- Garcia FJ, Violette PD, Brock GB, et al. Predictive factors for return of erectile function in robotic radical prostatectomy: case series from a single centre. Int J Impot Res. 2015;27(1):29–32.
- Mulhall JP. Defining and reporting erectile function outcomes after radical prostatectomy: challenges and misconceptions. J Urol. 2009;181(2):462–471.
- Kwon T, Lee C, Jung J, et al. Neurovascular bundle size measured on 3.0-T magnetic resonance imaging is associated with the recovery of erectile function after robot-assisted radical prostatectomy. Urol Oncol. 2017;35(9):542 e11–542 e17.
- Panebianco V, Sciarra A, Osimani M, et al. 2D and 3D T2-weighted MR sequences for the assessment of neurovascular bundle changes after nerve-sparing radical retropubic prostatectomy with erectile function correlation. Eur Radiol. 2009;19(1):220–229.
- Grivas N, van der Roest RC, de Korne CM, et al. The value of periprostatic fascia thickness and fascia preservation as prognostic factors of erectile function after nerve-sparing robot-assisted radical prostatectomy. World J Urol. 2019;37(2):309–315.
- Vargas HA, Donati OF, Wibmer A, et al. Association between penile dynamic contrast-enhanced MRI-derived quantitative parameters and self-reported sexual function in patients with newly diagnosed prostate cancer. J Sex Med. 2014;11(10):2581–2588.