
Abstract
Background
The aim of this study was to evaluate the efficiency of prostate-specific antigen (PSA) density (PSAD) calculated through prostate volume (PV) obtained via transrectal ultrasound (TRUS) and magnetic resonance imaging (MRI) and actual prostate weight (PW) methods obtained via pathological evaluation on the prediction of biochemical recurrence (BCR) in the follow-ups of patients who had undergone radical prostatectomy (RP).
Methods
A total of 335 clinically localized prostate cancer (PCa) patients who had received open RP between January 2015 and December 2018 were enrolled in the study. Pre and postoperative demographic data, clinical and pathological findings and BCR conditions were recorded. The PSAD was calculated using information obtained through preoperative TRUS examinations, MRI, and collected pathological specimens after RP by dividing the maximum preoperative PSA value and PV/PW.
Results
In a mean follow-up duration of 20.2 ± 8.5 months, recurrence was observed in 52 patients (24.4%) and progression was observed in 8 (3.8%) patients. The TRUS-PSAD, MRI-PSAD, and PW-PSAD values were statistically significantly higher in BCR patients compared to non-BCR patients. The International Society of Urologic Pathologists (ISUP) grade 5 and pT3b as a pathological stage were detected as independent variables in the prediction of BCR formation. Actual PW had a high prediction value compared to other PSAD measurements at <40 g prostate weights, but it had a low prediction value in prostates with an actual PW >60 g.
Conclusions
In this study, it was stated that PSAD acquired through different imaging methods does not affect the usability of PSAD in BCR prediction in clinical practice. The ISUP grade 5 and pT3b stage PCa were detected as independent markers in BCR prediction after RP.
Introduction
Although the organ specificity of prostate-specific antigen (PSA) is high, its specificity is low in prostate cancer (PCa) diagnosis [Citation1]. Different derivatives of PSA are used today to distinguish clinically important PCa, avoid unnecessary prostate biopsies, and predict the pathological and clinical phases after PCa treatment [Citation2]. Prostate volume plays an active role in predicting PCa [Citation3]. The PSA density (PSAD) acquired through dividing serum PSA value with prostate volume was presented for clinical use in 1992 to distinguish PCa from benign prostate hyperplasia (BPH) [Citation4]. The PSAD has an important role inclinically insignificant PCa definition and disease progression prediction during active follow-up and after definitive treatment [Citation5–7]. To calculate PSAD correctly, prostate volume (PV) should also be appropriately determined. Furthermore, the correct measurement of PV is important in the determination of the core count to be taken in a biopsy and the selection of a treatment strategy for BPH or PCa [Citation8]. In case the surgical treatment (perineal, retropubic radical prostatectomy) or radiotherapy (external beam radiotherapy [EBRT], high-intensity focused ultrasound [HIFU], brachytherapy) options for PCa are preferred, correct calculation of PV provides maximal benefit with a minimal treatment sideeffect ratio [Citation9]. The PV has also been used for prostate cancer risk calculations in recent years [Citation10]. A transrectal ultrasound (TRUS) is among the most used methods for PV calculation due toits reachability as well as cost and time advantages. But TRUS has some limitations such as being dependent on the clinical condition of the user and the patients (anal fissure, colostomy, etc.), being affected by sonographic artifacts, and when presented with irregularities in the prostate’s ellipsoid form [Citation8]. The TRUS was stated to calculate a lower PV compared to some studies and higher compared to others [Citation11]. Apart from TRUS, PV can be calculated in different ways in clinical practice (digital rectal examination [DRE], transabdominal ultrasound [TAUS], computed tomography [CT], magnetic resonance imaging [MRI]). Technical and software developments in MRI can calculate PV more accurately through the provision of higher soft tissue contrast resolution [Citation8,Citation12]. But there is discordance among the TRUS, MRI, and CT measurements in the literature and this prevents the correct calculation of PSAD [Citation11,Citation13,Citation14]. PSAD is used in different studies for the prediction of biochemical recurrence and clinical progression after surgical treatment but the inconsistencies in calculations restrict this efficiency [Citation8,Citation15]. The aim of this study was to evaluate the efficiencies of PSADs calculated using PV obtainedvia TRUS and MRI measurements and actual prostate weight (PW) methods obtainedvia pathological evaluation on the prediction of biochemical recurrence (BCR) in the follow-ups of the patients who had radical prostatectomy (RP).
Materials and methods
Patient selection
After obtaining consent from the Istanbul Medeniyet University institutional review board (2018/0368), a total of 335 clinically localized PCa patients who received open RP at Istanbul Medeniyet University Goztepe Research and Training Hospital between January 2015 and December 2018 were enrolled in the study. A prospectively populated database was the source of retrospectively obtained clinical data. All surgical procedures were made by a single surgeon (AY). Pre and postoperative serum total (t) and free (f) PSA (ng/ml) values, clinical stages, MRI findings (lesion dimension, lesion localization, Prostate Imaging Reporting and Data System version 2 [PIRADS] scores, capsule and seminal vesicle invasion), histopathological findings for RP specimens, and BCR conditions of the patients were recorded. Patients with a history of pre-surgical androgen deprivation therapy, external beam radiotherapy (EBRT), brachytherapy, transurethral resection or open prostatectomy, metastatic patients, and patients without regular-follow-ups were excluded from the study.
Techniques and prostate volume measurements
The TRUS examination was performed with the patients placed in the lateral decubitus position and a 7.5 MHz transrectal probe (GE Healthcare systems, USA). The prostate was scanned in the transverse and longitudinal planes with the largest dimensions (width, height, length) being recorded by a senior urologist. The prolate ellipsoid formula (height × width × length π/6) was used to calculate volume [Citation11]. The MRI was performed using the 1.5 Tesla whole body MRI (GE Healthcare systems, USA), and MRI-based PVs were calculated from radiologist performed, maximum diameter, tri-planar measurements of the prostate gland onhigh-resolution, focused field-of-view T2-weighted images using the ellipsoid formula [Citation8]. The actual prostate weight (PW) of the radical prostatectomy specimens were measured by placing the prostate with seminal vesicles excised after its removal (within one hour of specimen delivery) in a scaled jug already filled with water and measuring the displaced water in the jug after placement of prostate [Citation11]. The PSA density was calculated by using all three methods by dividing the maximum preoperative PSA value and PV/PW [Citation7].
Pathological findings
The 1997 TNM staging system was used to classify the clinical and pathological stages. The tumors were graded using the Gleason grading system. Positive surgical margins were defined as positive lateral margins, urethral margins, or bladder margins. The specimens were processed as previously mentioned by Radwan et al. [Citation16].
Biochemical failure
Biochemical failure was defined as any two consecutive PSA levels greater than 0.2 ng/mL. Patients were routinely seen in follow-up visits one month after the prostatectomy and every three months for up to one or two years according to their risk group.
Statistical analysis
Categorical data are presented as numbers and percentages. Data for continuous variables are presented as mean and standard deviation. The Shapiro–Wilk test was used to determine whether the distributions of continuous variables were normal. Mean differences between two independent groups of normally distributed data were compared with an independent t-test, while the Mann–Whitney U test was used to compare irregularly distributed data. The Wilcoxon signed-rank test was used for the comparison of irregularly distributed dependent groups. The frequencies of categorical variables were compared using Pearson’schi-square, Yates’ chi-square, or Fisher’s exact test, when appropriate. Statistical significance was considered when the p value was <0.05. Univariate and multivariate logistic regression analyses were performed to determine predictors of BCR. The receiver operating characteristic (ROC) analysis was used to assess the predictive ability of PSAD measurements by three different methods on BCR. Statistical analysis was performed using Statistical Package of Social Sciences version 21 (IBM SPSS Statistics; IBM Corp., Armonk, NY), and MedCalc Statistical Software version 19.2.1 (MedCalc Software Ltd., Ostend, Belgium) application was used to compare ROC curves.
Results
A total of 213 patients were included in the study. Demographic data, PVs from TRUS and MRI measurements, actual pathological PW and PSAD calculated through these methods, Gleason scores, ISUP degree, clinical and pathological stages, BCR and progression presence, and progression durations of the patients are summarized in . In a mean follow-up duration of 20.2 ± 8.5 months, recurrence was observed in 52 patients (24.4%) and progression was observed in 8 (3.8%) patients. BCR and non-BCR patients were compared for age, PSA, s/t PSA ratio, PVs in TRUS and MRI measurements, actual pathological PW and PSAD calculated through these methods, Gleason scores, ISUP degree, clinical stage, pathological findings, and progression. The TRUS-PSAD, MRI-PSAD, and PW-PSAD values were statistically significantly higher in BCR patients compared to non-BCR patients (p < 0.001; p < 0.001; p < 0.001 respectively). A statistically significant relationship was detected between BCR formation and removed lymph node count (p < 0.001), lymph node involvement count (p = 0.034), clinical stage (p = 0.006), pathological stage (p < 0.001), capsule invasion (p < 0.001), seminal vesicle invasion (p < 0.001), and progression formation (p < 0.001) (). While tPSA, TRUS-PSAD, MRI-PSAD, PW-PSAD, Gleason score, ISUP grade, clinical stage, pathological stage, capsule invasion, and seminal vesicle invasion (SVI) were significant factors in BCR formation prediction in univariate analysis, only ISUP grade 5 and pT3b as a pathological stage were detected as independent variables in the prediction of BCR formation (). In the comparison between prostate weight calculated through different imaging methods and actual PW, a difference was not detected between actual PW and PV calculated through TRUS and MRI in individuals with PW <40 g. In individuals with PW between 40 and 60 g a lower PV was predicted compared to actual PW through both imaging methods. While TRUS measured PV at a value statistically lower than the actual PW in individuals with PW >60 cm3, MRI provided the closest measurement to actual PW (). In the ROC analysis performed for BCR prediction ability of PSAD values, AUC values were 0.679 (95% CI 0.624–0.752), 0.691 (95% CI 0.620–0.749), and 0.687 (95% CI 0.612–0.741, p < 0.001) respectively for TRUS-PSAD, MRI-PSAD, and PW-PSAD. Cut-off values for TRUS-PSAD, MRI-PSAD, and PW-PSAD calculated with the Youden index method were 0.21 ng/ml/cc, 0.32 ng/ml/cc, and 0.36 ng/ml/cc respectively (). Overall accuracy, sensitivity, specificity, and positive and negative cut-off values based on determined cut-off values are shown in . Although PSAD has high specificity and NPV, its sensitivity and PPV were low. Overall accuracy ratios were below 50% for all three PSAD values. In the subgroup ROC analysis based on prostate weights, while PSAD was detected as a statistically significant marker for <40 g and >60 g actual prostate weight in BCR prediction, it was not for actual PW between 40 and 60 g. It was observed that TRUS-PSAD and MRI-PSAD had a similar power in BCR prediction with prostate weights <40 g and >60 g (<40 g; AUC: 0.702 vs 0.702; >60 g; AUC: 0.748 vs 0.753). And while PW-PSAD actual PW had a high prediction value (0.748) compared to other PSAD measurements at <40 g prostate weights, it had a low prediction value (0.697) in prostates with an actual PW >60 g. Despite different AUC values detected in the BCR prediction of all PSAD values, a statistically significant difference was not observed in the comparison of ROC curves ().
Figure 1. Receiver operating characteristic (ROC) curves for each PSA density measurement methods according to prostate weights in predicting biochemical recurrence.
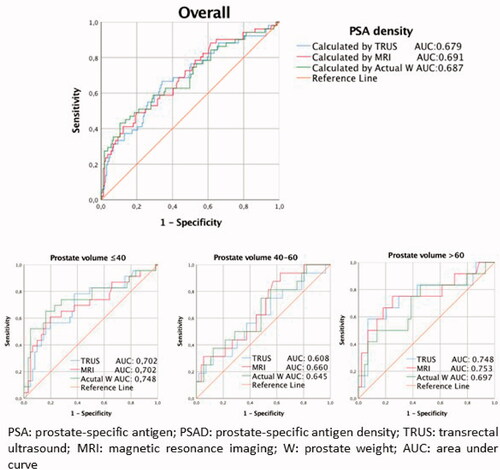
Table 1. Demographic characteristics and clinicopathological findings of the patients.
Table 2. Comparison of patients with biochemical recurrence and without biochemical recurrence.
Table 3. Logistic regression analysis of factors predicting biochemical recurrence.
Table 4. Actual weight and estimated weight levels measured by imaging methods according to the weight of the prostate.
Table 5. Predictive characteristics of PSAD values in patients eligible for biochemical recurrence.
Discussion
The BCR incidence is stated as 27–53% following PCa curative treatment [Citation17]. Prediction of BCR in early phases after surgical treatments may provideinsight about the application timings of adjuvant or salvage treatments [Citation16,Citation18]. It was shown that different markers of many preop or postop periods— such as PSA, age, Gleason score, and clinical stage—are independent markers for recurrence-free survival [Citation19,Citation20]. Conflicting information on the fact that PSAD valuesare a predictive factor for BCR is seen despite completed studies [Citation5,Citation16]. Koie et al. showed that five-year recurrence-free survival ratios were significantly higher in individuals withPSAD ≤0.468 ng/mL–1/cm−2 compared to those with PSAD >0.468 ng/mL–1/cm−2 in high-risk localized PCa [Citation21]. But no statistical difference was detected in terms of the prognostic value of PSA and PSAD in extraprostatic extension (EPE), SVI, lymph node (LN) involvement, and BCR prediction in patients with Gleason >8 [Citation22]. In the univariate analyses of this study, tPSA, TRUS, PSAD, MRI-PSAD, PW-PSAD, Gleason score, ISUP grade, clinical stage, pathological stage, capsule invasion, and SVI were found as significant predictive factors for BCR prediction, but PSAD wasn’t determined as an independent risk factor for BCR prediction in the multivariate analysis. In line with the literature, ISUP grade 5 and the pT3b stage were determined as independent risk factors for BCR prediction in this study [Citation23,Citation24]. The possibility of forming differences in BCR prediction after surgical treatment is contradictive for PSADs determined through different measurement methods [Citation6]. Although TRUS is the most used method in PV determination, all methods have their own limitations [Citation15]. Thus, TRUS is calculated in some studies while PW and PSAD are calculated in others [Citation16]. The PW-PSAD was determined to provide more accurate pathological findings compared to TRUS-PSAD and had a stronger correlation with BCR as well as a better C-index. Therefore, the possibility that PW can determine PV more correctly than TRUS or TAUS must be considered [Citation6,Citation16]. But PW cannot be determined until after the surgery and the correct determination of PV is provided through imaging methods in EBRT applied patients. Also, the PV index—a PSA derivative used in recent years—is inversely related to PCa risk and is preferred for active follow-up to decrease the possibility of overtreatment in different studies [Citation8]. In the study by Lee et al. MRI measurements werefound to be superior to TRUS in determining PV [Citation25]. In another study, it was determined that measurements using TAUS and CT cause overestimation compared to the actual PW [Citation15]. The strength of measurement techniques performed with different cut-off values of PV also changes. While TRUS causes overestimation in PV >30 cm3 prostates, it was observed to cause underestimation in PV <30 cm3 [Citation15]. Similarly, it was detected in another study that MRI can predict PV overestimation in patients with PV >35 cm3 and underestimation in those with PV <35 cm3 [Citation25]. When the efficiencies of TRUS, TAUS, and CT in PV determination at different PV values are evaluated, it was observed that all three measurements provided statistically significant measurement predictions compared to the actual PW [Citation26]. While TRUS and MRI provided measurements with a similar efficiency in individuals with PW <40 g in this study, it was observed that both techniques provided underestimation compared to actual PW at 40–60 g and MRI could provide measurement with similar efficiency with actual PW at >60 g. It was also observed that PSADs calculated through all three methods to determine BCR provided higher predictive values in patients with PW >60 g; MRI-PSAD had the highest AUC value among these methods (AUC: 0.753; CI 95%). This study is important for the evaluation of the efficiencies of TRUS and MRI methods in the determination of estimated PW and BCR prediction at different prostate volume value ranges. The superiority of MRI was shown in the calculation of PV and PSAD in patients who will receive non-surgical treatment and will have a preoperative evaluation. However, TRUS measurements may provide different results due to measurer-dependence and cross-sectional angle differences [Citation26]. As more soft tissue contrast resolution and more complex software is used with MRI, results similar to the actual PW can be acquired. Although many techniques are used for MRI calculation, the most used method is the application of the ellipsoid formula [Citation9,Citation16]. In this study, the ellipsoid formula was used, which is the most efficient method in PV calculation. Based on current knowledge, this study’s aim to understand the efficiency of PSAD values acquired through different methods such as pathological evaluation and calculating TRUS, MRI, and actual PW in BCR prediction following RP was not previously evaluated in the literature. With the findings we obtained, besides the primary outcome of our study, it is ensured that measurement methods show their superiority to each other in different prostate volumes, which are reflected in clinical practice. Additionally it becomes clear which PSAD measurement method should be used in the follow-up of patients under active surveillance. Our study will shed light on the use of MRI for various treatment or diagnostic methods that are planned to be performed using PV-based modeling in the future. However, this study does have some limitations. Instead of being retrospective, having fewer patients, a short follow-up duration, and only including patients who had open RP, future studies that include patient groups who had robot-assisted laparoscopic RP or the gradually increasing use of laparoscopic RP could provide more inclusive results. The present study was not blind as to the prostate volume measured between the TRUS and MRI as well as between the imaging methods and the RP specimen. This situation may occur a bias in our study.
Conclusion
It was stated that PSAD values acquired through different imaging methods does not affect the usability of PSADs in BCR prediction in clinical practice. In this study, it was shown that MRI could provide the measurement closest to actual PW, especially in patients with PW >60 g in prostate volume measurement. In this study, ISUP grade 5 and pT3b stage PCa were detected as independent markers in BCR prediction after RP. The results of this study must be supported by prospective studies with more patients and longer follow-up durations.
Disclosure statement
No potential conflict of interest was reported by the author(s).
References
- Salman J, Schoots I, Carlsson S, et al. Prostate specific antigen as a tumor marker in prostate cancer: biochemical and clinical aspects. Adv Exp Med Biol. 2015;867:93–114.
- Loeb S, Dani H. Whom to biopsy: pre-diagnostic risk stratification with biomarkers, nomograms and risk calculators. Urol Clin North Am. 2017;44(4):517–524.
- Erdogan A, Polat S, Keskin E, et al. Is prostate volume better than PSA density and free/total PSA ratio in predicting prostate cancer in patients with PSA 2.5–10 ng/mL and 10.1–30 ng/mL? Aging Male. 2020;23(1):59–65.
- Nordström T, Akre O, Aly M, et al. Prostate-specific antigen (PSA) density in the diagnostic algorithm of prostate cancer. Prostate Cancer Prostatic Dis. 2018;21(1):57–63.
- Brassell SA, Kao T-C, Sun L, et al. Prostate-specific antigen versus prostate-specific antigen density as predictor of tumor volume, margin status, pathologic stage, and biochemical recurrence of prostate cancer. Urology. 2005;66(6):1229–1233.
- Freedland SJ, Kane CJ, Presti JJ, et al. Comparison of preoperative prostate specific antigen density and prostate specific antigen for predicting recurrence after radical prostatectomy: results from the search data base. J Urol. 2003;169(3):969–973.
- Kundu SD, Roehl KA, Yu X, et al. Prostate specific antigen density correlates with features of prostate cancer aggressiveness. J Urol. 2007;177(2):505–509.
- Bezinque A, Moriarity A, Farrell C, et al. Determination of prostate volume: a comparison of contemporary methods. Acad Radiol. 2018;25(12):1582–1587.
- Mazaheri Y, Goldman DA, Di Paolo PL, et al. Comparison of prostate volume measured by endorectal coil MRI to prostate specimen volume and mass after radical prostatectomy. Acad Radiol. 2015;22(5):556–562.
- Roobol MJ, van Vugt HA, Loeb S, et al. Prediction of prostate cancer risk: the role of prostate volume and digital rectal examination in the ERSPC risk calculators. Eur Urol. 2012;61(3):577–583.
- Paterson NR, Lavallée LT, Nguyen LN, et al. Prostate volume estimations using magnetic resonance imaging and transrectal ultrasound compared to radical prostatectomy specimens. Can Urol Assoc J. 2016;10(7–8):264–268.
- Toth R, Bloch BN, Genega EM, et al. Accurate prostate volume estimation using multifeature active shape models on T2-weighted MRI. Acad Radiol. 2011;18(6):745–754.
- Rasch C, Barillot I, Remeijer P, et al. Definition of the prostate in CT and MRI: a multi-observer study. Int J Radiat Oncol Biol Phys. 1999;43(1):57–66.
- Jeong CW, Park HK, Hong SK, et al. Comparison of prostate volume measured by transrectal ultrasonography and MRI with the actual prostate volume measured after radical prostatectomy. Urol Int. 2008;81(2):179–185.
- Varkarakis I, Zarkadoulias A, Bourdoumis A, et al. Measurement of PSA density by 3 imaging modalities and its correlation with the PSA density of radical prostatectomy specimen. Urol Oncol. 2013;31(7):1038–1042.
- Radwan MH, Yan Y, Luly JR, et al. Prostate-specific antigen density predicts adverse pathology and increased risk of biochemical failure. Urology. 2007;69(6):1121–1127.
- Cornford P, Bellmunt J, Bolla M, et al. EAU-ESTRO-SIOG guidelines on prostate cancer. Part II: treatment of relapsing, metastatic, and castration-resistant prostate cancer. Eur Urol. 2017;71(4):630–642.
- Van den Broeck T, van den Bergh RC, Arfi N, et al. Prognostic value of biochemical recurrence following treatment with curative intent for prostate cancer: a systematic review. Eur Urol. 2019;75(6):967–987.
- Bishara S, Vasdev N, Lane T, et al. Robotic prostatectomy has a superior outcome in larger prostates and PSA density is a strong predictor of biochemical recurrence. Prostate Cancer. 2014;2014:1–6.
- Ün S, Türk H, Koca O, et al. Factors determining biochemical recurrence in low-risk prostate cancer patients who underwent radical prostatectomy. Turk J Urol. 2015;41(2):61–66.
- Koie T, Mitsuzuka K, Yoneyama T, et al. Prostate-specific antigen density predicts extracapsular extension and increased risk of biochemical recurrence in patients with high-risk prostate cancer who underwent radical prostatectomy. Int J Clin Oncol. 2015;20(1):176–181.
- Magheli A, Rais-Bahrami S, Trock BJ, et al. Prostate specific antigen versus prostate specific antigen density as a prognosticator of pathological characteristics and biochemical recurrence following radical prostatectomy. J Urol. 2008;179(5):1780–1784.
- Grogan J, Gupta R, Mahon KL, et al. Predictive value of the 2014 International Society of Urological Pathology grading system for prostate cancer in patients undergoing radical prostatectomy with long‐term follow‐up. BJU Int. 2017;120(5):651–658.
- Abdel Raheem A, Chang KD, Alenzi MJ, et al. Predictors of biochemical recurrence after Retzius‐sparing robot‐assisted radical prostatectomy: analysis of 359 cases with a median follow‐up period of 26 months. Int J Urol. 2018;25(12):1006–1014.
- Lee JS, Chung BH. Transrectal ultrasound versus magnetic resonance imaging in the estimation of prostate volume as compared with radical prostatectomy specimens. Urol Int. 2007;78(4):323–327.
- Kilic M, Özdemir AT, Altinova S, et al. What is the best radiological method to predict the actual weight of the prostate? Turk J Med Sci. 2014;44(1):31–35.