
Abstract
Background
Currently, China has an increasingly aging population. However, the prevalence of metabolic syndrome (MetS) in this high-risk population for metabolic diseases remains unknown. This study investigates the age- and gender-specific prevalence and associated factors of MetS in the middle-aged and elderly Chinese population.
Methods
Data were collected and subjected to descriptive statistics. Further, univariate logistic regression was used to evaluate the relevant factors, and then multivariate logistic regression was selected to construct the final model.
Results
A total of 10,834 participants were included in the present study. The overall prevalence of MetS is 32.97% as defined by International Diabetes Federation (IDF) and 29.75% under National Cholesterol Education Program-The Adult Treatment Panel III (NCEP-ATP III) criteria. With aging, the prevalence of MetS descends in males while ascends in females. In the >70 years old group, the prevalence of MetS is three times higher in females than that in males (50.43% versus 16.03%). Across all age groups and sexes, the prevalence of MetS in urban areas is significantly higher than in rural areas. Besides, regardless of gender, the prevalence of MetS is the highest for those living in the north region (28.41% for males and 51.74% for females) and the lowest for those living in the southwest region (13.91% for males and 31.58% for females). Finally, an afternoon nap has been identified as a positively associated factor, while blood urea nitrogen (BUN) has been identified as a negatively associated factor (p < 0.05).
Conclusion
The prevalence of MetS varies in different age groups, sexes, living areas, and regions. An afternoon nap is positively associated with the prevalence of MetS, while BUN is negatively associated with MetS.
Background
Metabolic syndrome (MetS), also known as syndrome X, is composed of abdominal obesity, insulin resistance, dyslipidemia, and hypertension [Citation1]. Currently, threats from communicable diseases have gradually declined, while hazards from metabolic diseases like MetS have surged [Citation2,Citation3]. Patients with MetS have higher odds of cancer [Citation4,Citation5], cardiovascular diseases [Citation6,Citation7], lower urinary tract symptoms [Citation8], etc., affecting people’s daily lives heavily. Besides, these increased risks are much more evident for the aged than the young [Citation1]. Therefore, exploring the prevalence and associated factors of MetS in the specific high-risk group, the middle-aged and elderly population in China, remains requisite.
There are diverse ways to construct MetS, such as definitions from National Cholesterol Education Program-The Adult Treatment Panel III (NCEP-ATP III) and International Diabetes Federation (IDF) [Citation9]. In the United States, according to the definition of NCEP-ATP III, an overall prevalence of MetS was 33% from 2003 to 2012 [Citation10], which slightly increased to 34.7% in 2011–2016 [Citation11]. In Iran, a meta-analysis of 69 studies disclosed a prevalence of 30.4% [Citation12]. The results show that the prevalence in women and the aged are significantly higher than men and the young. Similar conclusions are also seen in Bangladesh, Peru, Portugal, etc. [Citation13–17]. The literature has disclosed observational results in the overall population. However, no specific study targeting the middle-aged and elderly Chinese population is performed.
To date, some associated factors have been investigated, comprising age, living areas, educational levels, physical activities [Citation9,Citation18–20]. Although most previous studies indicated that risk factors and its negative effects in different ages and gender were different [Citation18,Citation21,Citation22], a few studies showed the opposite conclusion [Citation16], needing further exploration. Besides, risk factors identified previously were explored in the overall population. However, few studies were performed on the aged. There are 111 million people aged 65 years above who resided in China (8.2% of the country residents) [Citation23]. Performing one specific study targeting the aged seems imminent.
In this study, the prevalence of MetS and associated factors was scanned, including depression, sleep duration, liver diseases, kidney diseases, digestive diseases, etc. These factors were reported elsewhere to be closely implicated with MetS but not investigated in the Chinese aging population [Citation24]. This study enrolled these factors to describe MetS and its comorbidities better.
Methods
Study sample and data cleansing
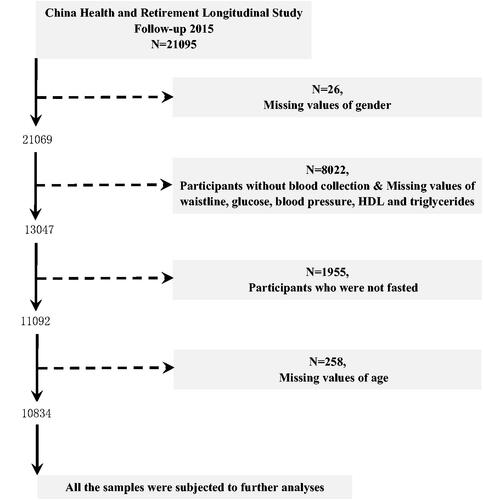
In order to scan the prevalence of MetS in the middle-aged and elderly Chinese population, data from China Health and Retirement Longitudinal Study (CHARLS) Follow-up Questionnaire 2015 were used. Further detailed description regarding this representative program could be accessed in their official website (http://charls.pku.edu.cn/) or publications [Citation25]. In this national cross-sectional survey, a total of 21,095 participants aged 40 years old above were enrolled. Data cleansing was performed due to the missing values of covariates and unqualified blood samples. The study flowchart is displayed in . Finally, 10,834 participants remained and were subjected to further analyses whose blood was collected under fasting status.
Figure 1. Flowchart of data cleansing. HDL: high-density lipoprotein.
Definition of MetS and data collection
Currently, there are diverse definitions to construct MetS, such as NCEP-ATP III, and IDF. Of note, the definition of IDF considers the ethnic characteristics of the Chinese and has lower cutoff values than other definitions, which benefits early diagnosis and intervention. Therefore, the definition of IDF was adopted to scan the prevalence of MetS. Besides, for comparing the results of this paper with those of other studies employing different definitions, the NCEP-ATP III definition was also used to scan the morbidity of MetS.
The definition of IDF requires abdominal obesity (waist circumference ≥90 cm for males and ≥80 cm for females) and two or more of the following: hyperglycemia, low HDL cholesterol, high blood triglycerides, and hypertension. Hyperglycemia is defined as blood glucose greater than 5.6 mmol/l (100 mg dl−1) or diagnosed as diabetes. Low HDL cholesterol is defined as <1.0 mmol/l (40 mg dl−1) in men or <1.3 mmol/l (50 mg dl−1) in women or drug treatment for low HDL. High blood triglycerides are defined as blood triglycerides >1.7 mmol/l (150 mg dl−1) or drug treatment for elevated triglycerides. Hypertension is defined as blood pressure >130/85 mmHg or drug treatment for hypertension. As for NCEP-ATP III, the presence of any three or more of the components stated above is sufficient to diagnose MetS. However, the cutoff of waist circumference to diagnose abdominal obesity is 102 cm for men or 88 cm for women. Detailed definitions of IDF and NCEP-ATP III can also be viewed in the previous literature [Citation9].
Five components, including waistline, HDL, triglycerides, blood glucose, and blood pressure, are requisite to construct MetS. All the measurements of these five components were carried out by well-trained researchers from the Chinese Center for Disease Control and Prevention (CCDC). Tapes were placed over the clothing around the waist at the level of the navel to measure waistlines. Participants were asked to be relaxed and seated until three blood pressure measurements were completed. Final blood pressures were recorded using the average of three measurements. Before the blood collection, participants were asked to fast from the night until the next morning for assessing blood biomarkers. Venous blood of participants was collected and centrifuged into plasma, which was immediately stored at −20 °C for transporting to CCDC in Beijing within 2 weeks. Blood biomarkers, including HDL, blood glucose, low-density lipoprotein (LDL), etc., were determined using enzymatic colorimetric tests.
Covariates
In this study, covariates comprising individual characteristics, blood biomarkers, and medical histories were collected. Individual behaviors include age, gender, marital status, depression, sleeping time, afternoon nap, geographic region, smoking, alcohol consumption, and body mass index (BMI). According to previous studies, age was divided into four groups: 40–50 years old, 50–60 years old, 60–70 years old, and >70 years old [Citation26,Citation27]. Marital status consisted of two groups. One included the married or cohabitated, and the other incorporated the divorced, widowed, married but not living with spouses. Participants with scores ≥10 assessed by the Center for Epidemiologic Studies Depression scale (CESD)-10 questionnaire were seen as depressed patients [Citation28]. Sleeping time was stratified into 0–6 h, 6–8 h, and >8 h. An afternoon nap was gathered as 0 min, 1–30 min, 31–60 min, 61–90 min, and > 90 min. The living regions were also divided into the rural region and urban region. The rural region only referred to villages, and other regions were unified as the urban region. Smoking and alcohol consumption were also collected and stratified according to their status. Smoking was reported as yes, no, and quitted. Alcohol consumption was divided as never, drunk but less than once a month, and drunk but more than once a month.
Blood biomarkers consist of uric acid, LDL, total cholesterol, and blood urea nitrogen (BUN). Hyperuricemia is defined as a blood uric acid concentration higher than 420 μmol/l in men and 357 μmol/l in women. LDL is classified into two groups ≥120 mg/dl and <120 mg/dl. Total cholesterol is classified into ≥200 mg/dl and <200 mg/dl. According to the previous study, BMI was split into <18.5 kg/m2, <24 kg/m2, < 28 kg/m2, and ≥28 kg/m2 [Citation29]. After referring to Arihan’s research [Citation30], BUN was divided as 0–20 mg/dl and >20 mg/dl. Furthermore, medical histories including liver diseases, kidney diseases, digestive diseases, arthritis were recorded. Digestive diseases included digestive ulcer, gastritis, etc. except for tumor or cancer. Renal disorders included kidney stones, chronic kidney diseases, etc. except for tumor or cancer. Hepatic disorders included hepatitis, liver cyst, hepatic aneurysm, etc. excluding fatty liver, tumors, and cancer. Due to the different living and cultural habits, living localities of the participants were also categorized into six regions as the previous study did [Citation27], which were East (Jiangsu, Fujian, Shanghai, Shandong, Zhejiang, Jiangxi, and Anhui), North (Shanxi, Hebei, Beijing, Tianjin, and Inner Mongolia), North-East (Jilin, Liaoning, and Heilongjiang), North-West (Qinghai, Shanxi, Xinjiang, and Gansu), South-Central (Hunan, Henan, Guangdong, Hubei, and Guangxi), and South-West (Sichuan, Chongqing, Yunnan, and Guizhou).
Statistical analysis
Data, composed of continuous and categorical data in this study, were presented as mean ± SD and proportions (%), respectively. Descriptive statistics were performed to investigate the prevalence and distribution of MetS in different subgroups. Further, univariate logistic regression was adopted to evaluate the associated factors with MetS under the IDF criteria. Covariates with p values < 0.05 were enrolled into the final model assessed by multivariate logistic regression. Considering that LDL, total cholesterol, uric acid and BMI may be correlated with the components of MetS, the four variables were not enrolled into further multivariate testing. Besides, restricted cubic spline regression (RCS) was used to test the relationship between MetS and the duration of the afternoon nap. All the analyses were made by R 3.6.3, and all the figures were drawn by R 3.6.0 and GraphPad Prism 8.0 (GraphPad Software Inc., San Diego, CA). p < 0.05 (two-sided) was considered statistically significant.
Results
Baseline characteristics and prevalence of MetS in grouped population
In total, 10,834 participants aged 40 years old above were enrolled and 18 covariates were collected in this study. The distribution of participants in these covariates is shown in . The overall prevalence of MetS is 32.97% (95% CI = 32.09–33.86) under IDF definition and 29.75% (95% CI = 28.90–30.62) under NCEP-ATP III definition. The specific prevalence among different variables is displayed in .
Table 1. Baseline population characteristics and prevalence in the grouped population.
Age- and gender-specific prevalence of MetS and its components
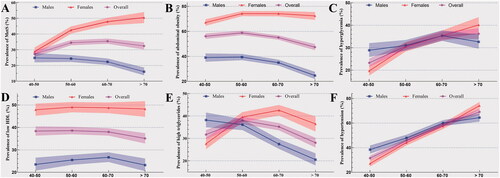
With aging, the prevalence of MetS under IDF definition in males descends while ascends in females (). In the >70 years old group, the prevalence of MetS in females is three times higher than that in males (50.43%, 95% CI = 46.98–53.88 versus 16.03%, 95% CI = 13.76–18.59). With aging, the increasing and decreasing trend for the prevalence of abdominal obesity remain identical in females and males, respectively (). As for hyperglycemia, the prevalence in both the overall population and females increases. However, this increasing trend in males has not been observed in the >70 years old group (). Besides, the prevalence of low HDL in females is nearly the same in all four age groups and thereof in males increases from 40–50 years old to 60–70 years, but decreases in the >70 years old group (). In , the prevalence of high triglycerides in the overall population and females fluctuates, but this prevalence in males remains its downward trend in all four age groups. In , the increasing trend of hypertensive patients is obvious in males, females, and the overall population.
Figure 2. Age and gender-specific prevalence of metabolic syndrome and its components. MetS: metabolic syndrome; HDL: High-density lipoprotein.
Age- and gender-specific prevalence of MetS in urban and rural areas
In , the prevalence of MetS in urban areas increases from 30.94% (95% CI = 27.22–34.92) to 43.37% (95% CI = 40.09–46.72) and then fluctuates (45.54% in 60–70 years old group and 44.16% in > 70 years old group). In females, the prevalence of MetS ascends in all four age groups (30.86% in 40–50 years old group, 50.21% in 50–60 years old group, 56.55% in 60–70 years old group, and 61.66% in > 70 years old group). In males, the prevalence of MetS fluctuates in all the four age groups (31.05% in 40–50 years old group, 34.74% in 50–60 years old group, 34.40% in 60–70 years old group, and 27.36% in >70 years old group).
Figure 3. Age and gender gender-specific prevalence of metabolic syndrome in urban and rural areas.
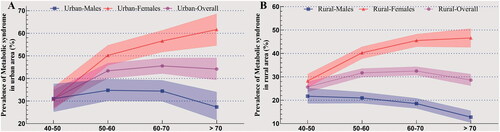
In rural and urban areas, the female and overall population show the same increasing and fluctuating trends (). However, in the male population, the prevalence of MetS has revealed a fluctuating trend in urban areas in contrast to a decreasing trend in rural areas. Among the male population in rural areas, the prevalence of MetS is 21.70% in the 40–50 age group, 20.97% in the 50–60 age group, 18.55% in the 60–70 age group, and 12.76% in >70 age group.
Gender-specific prevalence in different regions
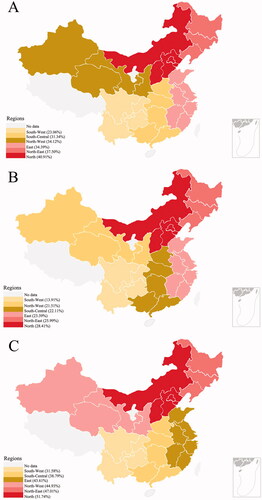
The gender-specific prevalence in different regions is displayed in . In , people living in north region have the highest prevalence (40.91%, 95% CI = 38.44–43.42) and people living in south-west region have the lowest prevalence (23.06%, 95% CI = 21.14–25.11). In , the difference between the south and north still exists in both males and females (13.91% [95% CI = 11.72–16.43] for males in south-west region, 28.41% [95% CI = 25.17–31.88] for males in north region, 31.58% [95% CI = 28.62–34.71] for females in south-west region, 51.74% [95% CI = 48.28–55.19] for females in north region).
Figure 4. Gender-specific prevalence of metabolic syndrome in different regions.
Associated factors of MetS in the Middle-aged and elderly population
In , results from univariate logistic regression revealed that participants who have higher age, afternoon nap, and arthritis are found to have higher odds of MetS (p < 0.05). Moreover, this increased risks of MetS are also found in females and participants who are not married or cohabitated (p < 0.05). In univariate testing, subjects who have cigarette consumption or quitted, alcohol consumption, higher BUN or digestive system diseases or live in rural areas display lower risks of MetS than their counterparts (p < 0.05).
Table 2. The associated factors and adjusted ORs for MetS.
In multivariate testing, this increased risk of MetS is observed in participants who have higher age, afternoon nap (p < 0.05). For females and those living in urban areas, smoked or quitted now, the elevated risk of MetS still exists (p < 0.05). Additionally, the results of RCS regression reveal a nonlinear relationship between the duration of afternoon naps and MetS (p < 0.05, ). A decreased risk of MetS is observed in participant with elevated BUN or living in rural areas (p < 0.05).
Discussion
In the present study, the prevalence of MetS in the participants aged 40 years and older is 32.97%, according to the IDF definition. Under the NCEP-ATP III definition, the prevalence of MetS is 29.75%. According to Li’s report, the prevalence of MetS in Chinese adults aged 18 years and older was 24.2% under the NCEP-ATP III definition in 2010–2012 [Citation22]. According to He’s study, the prevalence of MetS in the overall population was 9.5% in 2002 and 18.7% in 2010–2012 [Citation31]. The figures revealed that the aged had higher odds of MetS, which were in line with other studies [Citation9,Citation32]. According to IDF criteria, the prevalence of MetS was 45.5% in Tunisia, 37.4% in Iran, and 53.9% in Gwalior, a city in India [Citation33,Citation34]. Compared with studies in other countries, the prevalence reported in the present study seems lower than in these countries, which was probably attributed to different races, lifestyles, etc. In the aging population, the prevalence was 35% in the 40-59 years group and 46.7% in the >60 years group in the United States [Citation10]. The prevalence of MetS in the aging population was high in the United States but still lower than developed countries. Besides, in 2009, this number was 31.5% among people over 35 years old in Jiangsu province, China [Citation35], indicating that the trend of MetS in the aging population did not vary wildly.
With aging, the prevalence of MetS descends in males while ascends in females. This trend has also been observed in Korean [Citation36], Indian [Citation34], Spanish [Citation37], etc., which is probably partly attributed to hormone secretion. According to Jeenduang’s study, the prevalence of MetS was 29.37% in postmenopausal women, while it was 16.97% in premenopausal women [Citation38]. Hormones hidden behind menopause probably lead to this alteration [Citation39]. However, one previous article performed in the U.S. presented an opposite observational result that males had a higher prevalence of MetS than females [Citation40]. Due to the limited samples, this finding is probably biased, which still needs more evidence.
This study also found that the prevalence of MetS in urban areas was significantly higher than one in rural areas due to the sedentary lifestyles in modern cities possibly [Citation41]. Of note, with aging, this upward trend of MetS prevalence in females was not observed in males, especially for those settling in rural areas who displayed a downward trend. This result was in line with previous studies performed in China [Citation17], India [Citation42], sub-Saharan Africa [Citation43], and Mexico [Citation44] but contrary to Lee’s study in the middle-aged Koreans [Citation45]. The study from Javier concluded that men were more susceptible to the urbanization-associated worsening of cardiometabolic health [Citation44], which clarified this disparity partly. Notwithstanding, the specific reasons remain hazy. Besides hormones and lifestyles stated above, some other potential factors may contribute to this difference, including household income, educational levels, the annual cost of healthcare, etc. [Citation46,Citation47].
This disparity of MetS prevalence has been detected in different regions. Regardless of gender, participants have the highest prevalence in the north region and the lowest in the southwest region, which is linked to dietary nutrient intake according to previous reports [Citation48]. Residents in the north region mainly eat food made of flour, such as noodles, which are rich in carbohydrates. The intake of carbohydrates and sodium is closely associated with the increased risk of MetS [Citation45]. Besides, a diet rich in carbohydrates is a principal reason for aggravation glucose intolerance [Citation49] and dyslipidemia [Citation50]. Therefore, improving the diet structure seems sensible for those participants. Another possible reason for interpreting the disparity of the prevalence of MetS is the different income levels. According to the China Statistical Yearbook issued by the National Bureau of Statistics of China in 2020, the north regions (e.g. Beijing, Shanghai) have the highest per-capita disposable income than all other regions (39,438.9 RMB versus 27,370.6 RMB versus 26,025.3 RMB versus 23,986.1 RMB) [Citation51]. Multiple epidemiological studies have disclosed the pandemic of obesity in developing countries, with better GDP performance and consequently more food consumption (e.g. sugar) than ever [Citation52]. Hence, suppressing the rising trend of excessive food consumption in regions with higher GDP can decrease the prevalence of MetS.
In this special aging population, some relevant factors, including age, gender, living areas, etc., were identified as revealed by previous literature [Citation53]. Among them, marital status and arthritis were found not to be associated with MetS. Jung et al. [Citation54] revealed that the widowed tended to have a higher risk of MetS in middle-aged Korean women. However, in Jordan, Ajlouni et al. [Citation55] disclosed that the married had a significantly higher prevalence of MetS in both men and women. The results were concluded in different countries, races, and habits which were inconsistent with our study due to different socioeconomic factors and health behaviors. The different conclusions also highlighted the importance of performing studies in different countries, races, and economic levels. As for arthritis, Müller et al. revealed that the prevalence of MetS did not differ between the patients with early rheumatoid arthritis and the control group (35.2% versus 34.1%) [Citation56]. Even restricted to the middle-aged and elderly population in Germany, the compound MetS showed no association with osteoarthritis, in line with our conclusion [Citation57]. However, one multi-center study by Pan et al. [Citation58] indicated that MetS and low HDL were associated with medial compartment cartilage volume loss and the increase of bone marrow lesion size, indicating that although MetS were not associated with arthritis, the damage to the cartilage also should be noted. Patients with MetS should take notice of their joint health.
In addition, two pivotal factors (afternoon nap and BUN) are little reported elsewhere. Maria’s study [Citation59] showed that participants with an afternoon nap (<30 min/day) had lower risks of suffering MetS in the overall population, contrary to what we reported. This discrepancy is probably due to the different definitions of an afternoon nap. According to Cao’s study of 27,009 participants (mean age of 63.6 years), nappers with longer nap duration had a fairly higher rate of hypertension [Citation60]. Maria’s study was limited to the <30 min/day group, constraining this conclusion. More importantly, BUN >20 mg dl−1 was also determined to be a negative correlate. In Arora’s study, both metabolically healthy obesity and metabolically unhealthy obesity displayed normal kidney function [Citation61]. However, their target population was children and adolescents. This varied risk in different populations reminded of renal function in these particular middle-aged and elderly MetS patients.
This study has several defects. First, although some associated factors have been identified, this association still awaits further cohort study to demonstrate in this specific population. Among the associated factors, it should be specifically noted that the negative association between BUN and MetS is mainly based on the cross-sectional design. No causal link between them can be provided. Additionally, given the price of monitoring devices in a large cohort, it is hard to collect the sleep duration using objective equipment. Therefore, a simplified approach relying on the participants' self-reports has been used in this study, which may bring bias.
Conclusion
In the middle-aged and elderly Chinese population, the overall prevalence of MetS is 32.97% as defined by IDF and 29.75% under NCEP-ATP III criteria. The prevalence varies in different age groups, sexes, living areas, and regions. An afternoon nap is positively associated with MetS, while BUN is negatively associated with MetS.
Author contributions
Conceptualization: Y. X. and Y. C. Z. Data curation: Y. X., Y. C. Z., and F. X. Z. Formal analysis: Y. X. and Y. C. Z. Funding acquisition: J. H. Y. Investigation: Y. C. Z., F. X. Z., and C. J. W. Methodology: Y. X. and F. Q. Project administration: J. H. Y. and F. Q. Resources: Y. X. and Y. C. Z. Software: Y. X. and S. W. Supervision: J. H. Y. and F. Q. Validation: Y. X. and F. Q. Visualization: Y. C. Z. Writing – original draft: Y. X. Writing – review and editing: J. H. Y. and F. Q.
Ethics approval and consent to participate
The CHARLS study was approved by research ethics committees of Peking University (IRB00001052-13074). All participants provided written informed consent. No experimental interventions were performed.
Acknowledgments
The authors express thanks to the office of China Health and Retirement Longitudinal Study (CHARLS) and the assistance from Dr Xiaoyingzi Huang for her suggestions.
Disclosure statement
The authors declare no conflict of interest.
Data availability statement
The data that support the findings of this study are available from China Health and Retirement Longitudinal Study (CHARLS) website (http://charls.pku.edu.cn/). The full datasets used in this analysis are available from the corresponding author upon reasonable request.
Additional information
Funding
References
- Eckel RH, Grundy SM, Zimmet PZ. The metabolic syndrome. Lancet. 2005;365(9468):1415–1428.
- Dong Y, Wang L, Burgner DP, et al. Infectious diseases in children and adolescents in China: analysis of national surveillance data from 2008 to 2017. BMJ. 2020;369:m1043.
- NCD Risk Factor Collaboration (NCD-RisC). Worldwide trends in body-mass index, underweight, overweight, and obesity from 1975 to 2016: a pooled analysis of 2416 population-based measurement studies in 128·9 million children, adolescents, and adults. Lancet. 2017;390(10113):2627–2642.
- Hammarsten J, Damber JE, Haghsheno MA, et al. A stage-dependent link between metabolic syndrome components and incident prostate cancer. Nat Rev Urol. 2018;15(5):321–333.
- Wu YT, Luo QQ, Li X, et al. Clinical study on the prevalence and comparative analysis of metabolic syndrome and its components among Chinese breast cancer women and control population. J Cancer. 2018;9:548–555.
- Boden-Albala B, Sacco RL, Lee HS, et al. Metabolic syndrome and ischemic stroke risk: Northern Manhattan study. Stroke. 2008;39:30–35.
- DeBoer MD, Filipp SL, Gurka MJ. Associations of a metabolic syndrome severity score with coronary heart disease and diabetes in fasting vs. non-fasting individuals. Nutr Metab Cardiovasc Dis. 2020;30(1):92–98.
- Xiong Y, Zhang F, Wu C, et al. The circadian syndrome predicts lower urinary tract symptoms suggestive of benign prostatic hyperplasia better than metabolic syndrome in aging males: a 4-year follow-up study. Front Med. 2021;8:715830.
- Saklayen MG. The global epidemic of the metabolic syndrome. Curr Hypertens Rep. 2018;20(2):12.
- Aguilar M, Bhuket T, Torres S, et al. Prevalence of the metabolic syndrome in the United States, 2003–2012. Jama. 2015;313(19):1973–1974.
- Hirode G, Wong RJ. Trends in the prevalence of metabolic syndrome in the United States, 2011–2016. Jama. 2020;323(24):2526–2528.
- Kalan Farmanfarma K, Kaykhaei MA, Adineh HA, et al. Prevalence of metabolic syndrome in Iran: a meta-analysis of 69 studies. Diabetes Metab Syndr. 2019;13(1):792–799.
- Chowdhury MZI, Anik AM, Farhana Z, et al. Prevalence of metabolic syndrome in Bangladesh: a systematic review and meta-analysis of the studies. BMC Public Health. 2018;18(1):308.
- Adams KJ, Chirinos JL. Prevalence of risk factors for metabolic syndrome and its components in community kitchen users in a district in Lima. Peru Rev Peru Med Exp Salud Publica. 2018;35:39–45.
- Raposo L, Severo M, Barros H, et al. The prevalence of the metabolic syndrome in Portugal: the PORMETS study. BMC Public Health. 2017;17(1):555.
- Mulatinho LM, Ferraz A, Francisqueti FV, et al. Prevalence of metabolic syndrome and associated factors in adults living in Fernando de Noronha, Brazil. Diabetes Metab Syndr. 2019;13(1):554–558.
- Li R, Li W, Lun Z, et al. Prevalence of metabolic syndrome in Mainland China: a meta-analysis of published studies. BMC Public Health. 2016;16:296.
- Li Y, Zhao L, Yu D, et al. Metabolic syndrome prevalence and its risk factors among adults in China: a nationally representative cross-sectional study. PLoS One. 2018;13:e0199293.
- Gronner MF, Bosi PL, Carvalho AM, et al. Prevalence of metabolic syndrome and its association with educational inequalities among Brazilian adults: a population-based study. Braz J Med Biol Res. 2011;44(7):713–719.
- Myers J, Kokkinos P, Nyelin E. Physical activity, cardiorespiratory fitness, and the metabolic syndrome. Nutrients. 2019;11:1652.
- Liu CC, Chang HT, Chiang SC, et al. Sex differences in relationships between metabolic syndrome components and factors associated with health-related quality of life in middle-aged adults living in the community: a cross-sectional study in Taiwan. Health Qual Life Outcomes. 2018;16(1):76.
- Block A, Schipf S, Van der Auwera S, et al. Sex- and age-specific associations between major depressive disorder and metabolic syndrome in two general population samples in Germany. Nord J Psychiatry. 2016;70(8):611–620.
- Zeng Y. Towards deeper research and better policy for healthy aging – using the unique data of Chinese longitudinal healthy longevity survey. China Economic J. 2012;5(2–3):131–149.
- Zimmet P, Alberti KGMM, Stern N, et al. The circadian syndrome: is the metabolic syndrome and much more!. J Intern Med. 2019;286(2):181–191.
- Zhao Y, Hu Y, Smith JP, et al. Cohort profile: the China Health and Retirement Longitudinal Study (CHARLS). Int J Epidemiol. 2014;43(1):61–68.
- Xiong Y, Zhang YC, Li XY, et al. The prevalence and associated factors of lower urinary tract symptoms suggestive of benign prostatic hyperplasia in aging males. Aging Male. 2020;1–8: 1432–1439.
- Zhang W, Zhang X, Li H, et al. Prevalence of lower urinary tract symptoms suggestive of benign prostatic hyperplasia (LUTS/BPH) in China: results from the China health and retirement longitudinal study. BMJ Open. 2019;9:e022792.
- Andresen EM, Byers K, Friary J, et al. Performance of the 10-item center for epidemiologic studies depression scale for caregiving research. SAGE Open Med. 2013;1:2050312113514576.
- Xiong Y, Zhang YC, Jin T, et al. Depressive males have higher odds of lower urinary tract symptoms suggestive of benign prostatic hyperplasia: a retrospective cohort study based on propensity score matching. Asian J Androl. 2021;23(6):633–639.
- Arihan O, Wernly B, Lichtenauer M, et al. Blood urea nitrogen (BUN) is independently associated with mortality in critically ill patients admitted to ICU. PLoS One. 2018;13:e0191697.
- He Y, Li Y, Bai G, et al. Prevalence of metabolic syndrome and individual metabolic abnormalities in China, 2002–2012. Asia Pac J Clin Nutr. 2019;28(3):621–633.
- Li W, Song F, Wang X, et al. Prevalence of metabolic syndrome among middle-aged and elderly adults in China: current status and temporal trends. Ann Med. 2018;50(4):345–353.
- Delavari A, Forouzanfar MH, Alikhani S, et al. First nationwide study of the prevalence of the metabolic syndrome and optimal cutoff points of waist circumference in the Middle East: the national survey of risk factors for noncommunicable diseases of Iran. Diabetes Care. 2009;32(6):1092–1097.
- Subramani SK, Mahajan S, Chauhan P, et al. Prevalence of metabolic syndrome in Gwalior region of Central India: a comparative study using NCEP ATP III, IDF and harmonized criteria. Diabetes Metab Syndr. 2019;13(1):816–821.
- Zuo H, Shi Z, Hu X, et al. Prevalence of metabolic syndrome and factors associated with its components in Chinese adults. Metabolism. 2009;58:1102–1108.
- Kwon HS, Park YM, Lee HJ, et al. Prevalence and clinical characteristics of the metabolic syndrome in middle-aged Korean adults. Korean J Intern Med. 2005;20(4):310–316.
- Castro Vilela ME, Quilez Pina RM, Bonafonte Marteles JL, et al. Prevalence of metabolic syndrome in elderly patients. Rev Esp Geriatr Gerontol. 2014;49(1):20–23.
- Jeenduang N, Trongsakul R, Inhongsa P, et al. The prevalence of metabolic syndrome in premenopausal and postmenopausal women in Southern Thailand. Gynecol Endocrinol. 2014;30:573–576.
- Minkin MJ. Menopause: hormones, lifestyle, and optimizing aging. Obstet Gynecol Clin North Am. 2019;46(3):501–514.
- Ford ES, Li C, Zhao G. Prevalence and correlates of metabolic syndrome based on a harmonious definition among adults in the US. J Diabetes. 2010;2(3):180–193.
- Wang LX, Filipp SL, Urbina EM, et al. Longitudinal associations of metabolic syndrome severity between childhood and young adulthood: the Bogalusa Heart Study. Metab Syndr Relat Disord. 2018;16(5):208–214.
- Harikrishnan S, Sarma S, Sanjay G, et al. Prevalence of metabolic syndrome and its risk factors in Kerala, South India: analysis of a community based cross-sectional study. PLoS One. 2018;13:e0192372.
- Jaspers Faijer-Westerink H, Kengne AP, Meeks KAC, et al. Prevalence of metabolic syndrome in Sub-Saharan Africa: a systematic review and meta-analysis. Nutr Metab Cardiovasc Dis. 2020;30(4):547–565.
- Moreno-Ulloa J, Moreno-Ulloa A, Martinez-Tapia M, et al. Comparison of the prevalence of metabolic syndrome and risk factors in urban and rural Mexican Tarahumara-foot runners. Diabetes Res Clin Pract. 2018;143:79–87.
- Lee S, Shin Y, Kim Y. Risk of metabolic syndrome among middle-aged Koreans from rural and urban areas. Nutrients. 2018;10(7):859.
- Ferguson TS, Younger N, Tulloch-Reid MK, et al. Prevalence of the metabolic syndrome in Jamaican adults and its relationship to income and education levels. West Indian Med J. 2010;59(3):265–273.
- Chapel JM, Ritchey MD, Zhang D, et al. Prevalence and medical costs of chronic diseases among adult medicaid beneficiaries. Am J Prev Med. 2017;53(6S2):S143–S154.
- Cornier MA, Dabelea D, Hernandez TL, et al. The metabolic syndrome. Endocr Rev. 2008;29(7):777–822.
- Feskens EJ, Bowles CH, Kromhout D. Carbohydrate intake and body mass index in relation to the risk of glucose intolerance in an elderly population. Am J Clin Nutr. 1991;54(1):136–140.
- Feng R, Du S, Chen Y, et al. High carbohydrate intake from starchy foods is positively associated with metabolic disorders: a cohort study from a Chinese population. Sci Rep. 2015;5:16919.
- The National Bureau of Statistics of China. [(accessed on 18 March 2020)]; Available online: http://www.stats.gov.cn/tjsj/ndsj/2020/indexch.htm.
- Popkin BM, Adair LS, Ng SW. Global nutrition transition and the pandemic of obesity in developing countries. Nutr Rev. 2012;70(1):3–21.
- Xi B, He D, Hu Y, et al. Prevalence of metabolic syndrome and its influencing factors among the Chinese adults: the China Health and Nutrition Survey in 2009. Prev Med. 2013;57(6):867–871.
- Jung YA, Kang LL, Kim HN, et al. Relationship between marital status and metabolic syndrome in Korean middle-aged women: the sixth Korea national health and nutrition examination survey (2013–2014). Korean J Fam Med. 2018;39(5):307–312.
- Ajlouni K, Khader Y, Alyousfi M, et al. Metabolic syndrome amongst adults in Jordan: prevalence, trend, and its association with socio-demographic characteristics. Diabetol Metab Syndr. 2020;12(1):100.
- Müller R, Kull M, Põlluste K, et al. The metabolic profile in early rheumatoid arthritis: a high prevalence of metabolic obesity. Rheumatol Int. 2017;37(1):21–27.
- Walter SS, Wintermeyer E, Klinger C, et al. Association between metabolic syndrome and hip osteoarthritis in middle-aged men and women from the general population. PLoS One. 2020;15(3):e0230185.
- Pan F, Tian J, Mattap SM, et al. Association between metabolic syndrome and knee structural change on MRI. Rheumatology (Oxford). 2020;59(1):185–193.
- Arralda-Del-Villar M, Carlos-Chilleron S, Diaz-Gutierrez J, et al. Healthy lifestyle and incidence of metabolic syndrome in the SUN cohort. Nutrients. 2018;11(1):65.
- Cao Z, Shen L, Wu J, et al. The effects of midday nap duration on the risk of hypertension in a middle-aged and older Chinese population: a preliminary evidence from the Tongji-Dongfeng cohort study, China. J Hypertens. 2014;32(10):1993–1998; discussion 8.
- Arora S, Dunkley L, Waldman LM, et al. Kidney function in minority children and adolescents with metabolically healthy and unhealthy obesity. Clin Obes. 2020;10:e12345.